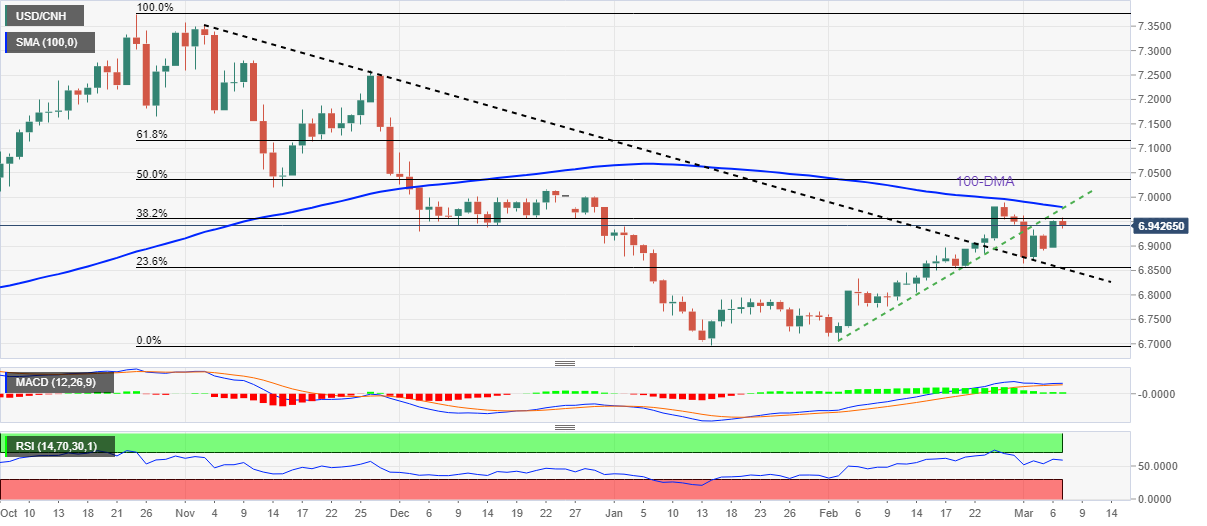
- USD/CNH eases from a one-week high to pare the previous day’s gain.
- 100-DMA, support-turned-resistance from early February appears a tough nut to crack for bulls.
- Looming bear cross on MACD, steady RSI (14) hints at further grinding towards the previous resistance line.
USD/CNH takes offers to extend the initial pullback from a one-week high, down 0.15% intraday near 6.9400 during Tuesday’s Asian session. In doing so, the offshore Chinese Yuan (CNH) pair consolidates the previous day’s gains amid downbeat oscillators and a failure to cross the key upside hurdle.
That said, the MACD signals lose their bullish bias and the bear cross seems to loom. On the same line, the RSI (14) also remains mostly steady and backs the latest weakness of the pair.
It’s worth noting that the failure to cross the 38.2% Fibonacci retracement level of the pair’s October 2022 to January 2023 fall, near 6.9560, triggered the quote’s latest pullback.
Apart from the immediate Fibonacci retracement hurdle, a convergence of the 100-DMA and an upward-sloping trend line from early February, the previous support line, close to 6.9800, appears a tough nut to crack for the USD/CNH bulls.
Meanwhile, pullback moves appear on the way to test the resistance-turned-support line from October 2022, close to 6.8550.
Following that, the late January swing high near 6.7950 could entertain the USD/CNH bears before directing them to the yearly low of 6.6975.
USD/CNH: Daily chart
Trend: Further downside expected
