Gold prices staged a turnaround on Friday, reversing the earlier decline and trading just above the $5,170 mark per troy ounce. The yellow metal continues to draw support from safe haven demand linked to tensions in the Middle East, although gains remain measured as investors weigh the prospect of higher inflation.
USD/JPY poised to test 158.00 despite weak US jobs data
The USD/JPY rises and challenges the 158.00 figure on Friday up over 0.20% after the latest employment report in the US revealed weakness in the labor market. Also, the Middle East conflict deteriorates market mood, maintaining the US Dollar bid during the week.
US Dollar holds firm on risk aversion even as NFP miss boosts Fed cut bets
February’s Nonfarm Payrolls print was worse than expected as the US economy slashed 92K jobs in the month missing estimates of for a creation of 59K jobs. At the same time, the Unemployment Rate rose from 4.3% to 4.4% a tenth below the Federal Reserve’s 4.5% projected for 2026, with the data increasing the chances for a rate cut in the foreseeable future.
Money markets saw the odds for a 25-basis points Fed rate cut, rising from around 35% ahead to the data to 50%, according to Prime Market Terminal.
Mary Daly, the San Francisco Fed President said that both of the goals are risks now, said that no one month of data is decisional, yet revealed that the labor market is vulnerable. Nevertheless, she added that although she is concerned, strikes, snow and population benchmarking make the NFP report harder to interpret.
Daly favors holding rates steady “while we collect more information,” regarding the jobs market and inflation.
At the same time, US Retail Sales contracted -0.2% MoM better than the expected -0.3% fall
In Japan, the Bank of Japan Deputy Governor Ryozo Himino commented that the central bank is vigilant of Japanese Yen moves as it could affect core inflation. He said at the parliament that “We need to be mindful that exchange-rate fluctuation has a bigger impact on price moves than in the past. Through this channel, they could affect inflation expectations and underlying inflation.”
USD/JPY Price Forecast: Technical outlook
In the daily chart, USD/JPY trades at 157.73. The near-term bias is bullish as spot holds well above the rising support trend line from 152.10 and rides a sequence of higher daily lows. Price action trades above the clustered simple moving averages around 156.10, confirming an upside trend backdrop, while the break of the prior descending resistance line from 159.23 has shifted former capping pressure into a more supportive configuration. The RSI at 61 signals firm bullish momentum without entering overbought territory, reinforcing the view that buyers retain control in the near term.
Initial support emerges at the 156.10 moving average area, ahead of the broken resistance trend-line region near 154.70, where a deeper pullback would test the integrity of the latest breakout. Below that, the higher rising trend line from 152.10 forms a more distant but important structural floor. On the upside, immediate resistance sits near the recent highs around 157.70, with a sustained break opening the way toward the 159.20 region as the next bullish target. As long as price holds above 156.10 on a daily closing basis, the path of least resistance remains to the upside.
(The technical analysis of this story was written with the help of an AI tool.)
Japanese Yen Price This week
The table below shows the percentage change of Japanese Yen (JPY) against listed major currencies this week. Japanese Yen was the strongest against the Euro.
| USD | EUR | GBP | JPY | CAD | AUD | NZD | CHF | |
|---|---|---|---|---|---|---|---|---|
| USD | 1.54% | 0.36% | 1.07% | -0.20% | 0.47% | 1.06% | 1.42% | |
| EUR | -1.54% | -1.17% | -0.51% | -1.71% | -1.05% | -0.46% | -0.12% | |
| GBP | -0.36% | 1.17% | 0.46% | -0.56% | 0.12% | 0.71% | 1.05% | |
| JPY | -1.07% | 0.51% | -0.46% | -1.18% | -0.52% | 0.12% | 0.40% | |
| CAD | 0.20% | 1.71% | 0.56% | 1.18% | 0.63% | 1.32% | 1.61% | |
| AUD | -0.47% | 1.05% | -0.12% | 0.52% | -0.63% | 0.58% | 0.94% | |
| NZD | -1.06% | 0.46% | -0.71% | -0.12% | -1.32% | -0.58% | 0.35% | |
| CHF | -1.42% | 0.12% | -1.05% | -0.40% | -1.61% | -0.94% | -0.35% |
The heat map shows percentage changes of major currencies against each other. The base currency is picked from the left column, while the quote currency is picked from the top row. For example, if you pick the Japanese Yen from the left column and move along the horizontal line to the US Dollar, the percentage change displayed in the box will represent JPY (base)/USD (quote).
US Nonfarm Payrolls set to show moderate job growth as traders pare Fed rate cut bets
The United States (US) Bureau of Labor Statistics (BLS) will release the Nonfarm Payrolls (NFP) data for February at 13:30 GMT.

Volatility around the US Dollar (USD) will likely ramp up on the employment report, with investors looking for fresh insights on the US Federal Reserve’s (Fed) path forward on interest rates, especially after the crisis in the Middle East revived concerns over rising inflation.
What to expect from the next Nonfarm Payrolls report?
Investors expect NFP to rise by 59K following the impressive 130K increase recorded in January. The Unemployment Rate is expected to remain unchanged at 4.3%, while the annual wage inflation, as measured by the change in the Average Hourly Earnings, is projected to hold steady at 3.7%.
Previewing the employment report, TD Securities analysts note that they expect job gains to moderate to 90K in February.
“The moderation should be led by healthcare after it posted unusually strong gains last month. Private payrolls likely saw a 100k gain while government likely declined 10k. We also look for the Unemployment Rate to stay at 4.3%, while we flag the risk of an increase to 4.4%. Average Hourly Earnings likely moderated to 0.2% m/m (3.7% y/y),” they add.
Recent employment-related data releases from the US hinted at relatively healthy labor market conditions in February. The Employment Index of the Institute for Supply Management’s (ISM) Manufacturing Purchasing Managers’ Index (PMI) survey edged higher to 48.8 from 48.1 in January (although still in contraction), while the Automatic Data Processing (ADP) reported that employment in the private sector rose 63K, surpassing the market expectation of 50K. Finally, the Employment Index of the ISM Services PMI survey rose to 51.8 from 50.3, reflecting an acceleration in job creation in the key service sector.
How will the US February Nonfarm Payrolls affect EUR/USD?
The USD has capitalized on safe-haven flows and started the month on a firm footing after the US and Israel carried out a joint attack against Iran, causing EUR/USD to come under heavy bearish pressure.
Earlier in the week, the US Senate rejected a resolution that is designed to force US President Donald Trump to seek congressional approval for further military action against Iran. Additionally, CNN reported that a top US official said that the US will start attacking deeper into Iran, noting that the operation is still in its early days.
From a monetary policy perspective, investors are keeping a close eye on the impact of the Middle East crisis on energy prices and how that could alter the inflation outlook. According to the CME FedWatch Tool, the probability of the Federal Reserve (Fed) leaving the policy rate unchanged in the next three meetings climbed to nearly 70% from about 50% before the US-Iran war started.

While speaking at the Bloomberg Invest Conference earlier in the week, Neel Kashkari, President of the Federal Reserve (Fed) Bank of Minneapolis, said that it is too soon to know how the Iran war will affect inflation, but acknowledged that it could have an impact on monetary policy.
In case NFP comes in at 70K or higher, and the Unemployment Rate remains steady at 4.3% as forecast, markets could assess the employment data as “good enough” for the Fed to continue to delay interest-rate cuts until the second half of the year. In this scenario, the USD could continue to gather strength and trigger another leg lower in EUR/USD.
On the other hand, a significant downside surprise in NFP, a reading at or below 30K, combined with an increase in the Unemployment Rate, would be required for investors to lean back toward a rate cut in June.
Still, the USD’s losses could remain limited in this case unless there is a de-escalation of the conflict in the Middle East. The most bearish scenario for the USD, fueling a decisive rebound in EUR/USD, would be a combination of a sharp correction in Crude Oil prices with the naval activity in the Strait of Hormuz returning to normal, and an employment report that highlights worsening labor market conditions.
Societe Generale analysts note that they expect a solid NFP print after “four out of four US labour market anecdotes surprised to the upside.”
“Under the current circumstances, it’s a stretch to conclude that good data is reassuring and therefore bullish for risk assets and currencies (bearish dollar),” they add. “We assume that a 30K-70K employment gain should not move the dial and it’s where oil and natural gas prices close the week that we think will govern the price action.”
Eren Sengezer, European Session Lead Analyst at FXStreet, offers a brief technical outlook for EUR/USD:
“There is a clear bearish tilt in EUR/USD’s short-term outlook. The pair made a daily close below the 200-day Simple Moving Average (SMA) for the first time in a year and the Relative Strength Index (RSI) dropped below 40.”
“1.1500 (static level, round level) aligns as first significant support ahead of 1.1400 (static level, round level) and 1.1300-1.1290 (round level, static level). On the upside, a strong resistance area seems to have formed at 1.1670-1.1700 (200-day SMA, 100-day SMA). The pair would need to clear that hurdle and stabilize to attract technical buyers. In this case, the 50-day SMA could act as the next resistance at 1.1770.”

Nonfarm Payrolls FAQs
Nonfarm Payrolls (NFP) are part of the US Bureau of Labor Statistics monthly jobs report. The Nonfarm Payrolls component specifically measures the change in the number of people employed in the US during the previous month, excluding the farming industry.
The Nonfarm Payrolls figure can influence the decisions of the Federal Reserve by providing a measure of how successfully the Fed is meeting its mandate of fostering full employment and 2% inflation.
A relatively high NFP figure means more people are in employment, earning more money and therefore probably spending more. A relatively low Nonfarm Payrolls’ result, on the either hand, could mean people are struggling to find work.
The Fed will typically raise interest rates to combat high inflation triggered by low unemployment, and lower them to stimulate a stagnant labor market.
Nonfarm Payrolls generally have a positive correlation with the US Dollar. This means when payrolls’ figures come out higher-than-expected the USD tends to rally and vice versa when they are lower.
NFPs influence the US Dollar by virtue of their impact on inflation, monetary policy expectations and interest rates. A higher NFP usually means the Federal Reserve will be more tight in its monetary policy, supporting the USD.
Nonfarm Payrolls are generally negatively-correlated with the price of Gold. This means a higher-than-expected payrolls’ figure will have a depressing effect on the Gold price and vice versa.
Higher NFP generally has a positive effect on the value of the USD, and like most major commodities Gold is priced in US Dollars. If the USD gains in value, therefore, it requires less Dollars to buy an ounce of Gold.
Also, higher interest rates (typically helped higher NFPs) also lessen the attractiveness of Gold as an investment compared to staying in cash, where the money will at least earn interest.
Nonfarm Payrolls is only one component within a bigger jobs report and it can be overshadowed by the other components.
At times, when NFP come out higher-than-forecast, but the Average Weekly Earnings is lower than expected, the market has ignored the potentially inflationary effect of the headline result and interpreted the fall in earnings as deflationary.
The Participation Rate and the Average Weekly Hours components can also influence the market reaction, but only in seldom events like the “Great Resignation” or the Global Financial Crisis.
Japan’s Katayama: Government ready to act to combat economic impact from Iran conflict

Japan’s Finance Minister Satsuki Katayama said on Friday that compiling extra budget would of course be an option as Prime Minister had said before. Katayama added that the government ready to take steps in timely fashion to combat economic impact from Iran conflict. She stated that Japan is not fully exited from deflation.
Meanwhile, Bank of Japan (BoJ) Deputy Governor Himino said that the central bank keeps monetary conditions accommodative and gradually adjust degree of monetary accommodation.
Key quotes from BoJ’s Himino
Japan is in inflation in sense consumer prices rising, up to govt to decide whether Japan completely out of deflation.
BoJ keeping monetary conditions accommodative, gradually adjusting degree of monetary accommodation.
Underlying inflation gradually accelerating toward BoJ’s 2% target.
Will continue to scrutinise market moves, impact on economy and prices.
Market reaction
At the time of press, the USD/JPY pair is up 0.16% on the day at 157.80.
Japanese Yen FAQs
The Japanese Yen (JPY) is one of the world’s most traded currencies. Its value is broadly determined by the performance of the Japanese economy, but more specifically by the Bank of Japan’s policy, the differential between Japanese and US bond yields, or risk sentiment among traders, among other factors.
One of the Bank of Japan’s mandates is currency control, so its moves are key for the Yen. The BoJ has directly intervened in currency markets sometimes, generally to lower the value of the Yen, although it refrains from doing it often due to political concerns of its main trading partners. The BoJ ultra-loose monetary policy between 2013 and 2024 caused the Yen to depreciate against its main currency peers due to an increasing policy divergence between the Bank of Japan and other main central banks. More recently, the gradually unwinding of this ultra-loose policy has given some support to the Yen.
Over the last decade, the BoJ’s stance of sticking to ultra-loose monetary policy has led to a widening policy divergence with other central banks, particularly with the US Federal Reserve. This supported a widening of the differential between the 10-year US and Japanese bonds, which favored the US Dollar against the Japanese Yen. The BoJ decision in 2024 to gradually abandon the ultra-loose policy, coupled with interest-rate cuts in other major central banks, is narrowing this differential.
The Japanese Yen is often seen as a safe-haven investment. This means that in times of market stress, investors are more likely to put their money in the Japanese currency due to its supposed reliability and stability. Turbulent times are likely to strengthen the Yen’s value against other currencies seen as more risky to invest in.
Canadian Dollar advances despite lower Oil prices

USD/CAD struggles after registering modest gains in the previous session, trading around 1.3660 during the Asian hours on Friday. However, the downside of the USD/CAD pair could be restrained as the Canadian Dollar (CAD) could face challenges amid lower Oil prices, given Canada’s status as the largest crude exporter to the United States (US).
West Texas Intermediate (WTI) Oil price declines after three days of gains, trading around $77.60 at the time of writing. Crude Oil prices retreated after the US President Donald Trump administration signaled it is weighing several options to address the recent price surge caused by supply disruptions linked to the US-Israeli war with Iran.
Bloomberg reported on Friday that US Interior Secretary Doug Burgum said the administration is reviewing multiple measures before announcing plans to provide insurance guarantees and naval escorts to ensure safe passage for Oil tankers and other vessels through the Strait of Hormuz.
The US Dollar (USD) strengthens against its major peers, with Federal Reserve (Fed) officials continuing to consider the possibility of further rate hikes if inflation remains above target, despite calls from some policymakers who argue that the time to begin rate cuts has arrived.
Market participants are also awaiting Friday’s US Nonfarm Payrolls (NFP) report, where consensus expectations are around 59K for February, following January’s above-trend reading of 130K. Additionally, Retail Sales are expected to fall 0.3% month-over-month in January, after a flat reading in the previous month.
Canadian Dollar FAQs
The key factors driving the Canadian Dollar (CAD) are the level of interest rates set by the Bank of Canada (BoC), the price of Oil, Canada’s largest export, the health of its economy, inflation and the Trade Balance, which is the difference between the value of Canada’s exports versus its imports. Other factors include market sentiment – whether investors are taking on more risky assets (risk-on) or seeking safe-havens (risk-off) – with risk-on being CAD-positive. As its largest trading partner, the health of the US economy is also a key factor influencing the Canadian Dollar.
The Bank of Canada (BoC) has a significant influence on the Canadian Dollar by setting the level of interest rates that banks can lend to one another. This influences the level of interest rates for everyone. The main goal of the BoC is to maintain inflation at 1-3% by adjusting interest rates up or down. Relatively higher interest rates tend to be positive for the CAD. The Bank of Canada can also use quantitative easing and tightening to influence credit conditions, with the former CAD-negative and the latter CAD-positive.
The price of Oil is a key factor impacting the value of the Canadian Dollar. Petroleum is Canada’s biggest export, so Oil price tends to have an immediate impact on the CAD value. Generally, if Oil price rises CAD also goes up, as aggregate demand for the currency increases. The opposite is the case if the price of Oil falls. Higher Oil prices also tend to result in a greater likelihood of a positive Trade Balance, which is also supportive of the CAD.
While inflation had always traditionally been thought of as a negative factor for a currency since it lowers the value of money, the opposite has actually been the case in modern times with the relaxation of cross-border capital controls. Higher inflation tends to lead central banks to put up interest rates which attracts more capital inflows from global investors seeking a lucrative place to keep their money. This increases demand for the local currency, which in Canada’s case is the Canadian Dollar.
Macroeconomic data releases gauge the health of the economy and can have an impact on the Canadian Dollar. Indicators such as GDP, Manufacturing and Services PMIs, employment, and consumer sentiment surveys can all influence the direction of the CAD. A strong economy is good for the Canadian Dollar. Not only does it attract more foreign investment but it may encourage the Bank of Canada to put up interest rates, leading to a stronger currency. If economic data is weak, however, the CAD is likely to fall.
USD/MXN jumps above 17.70 as Middle East war spurs risk-off
The Mexican Peso (MXN) depreciates sharply on Thursday as hostilities intensify in the Middle East, triggering a flight to safety, which underpinned the US Dollar (USD). Additionally, solid jobs data in the US decreased the chances that the Federal Reserve (Fed) might cut rates twice this year. At the time of writing, the USD/MXN pair trades at 17.72, up more than 0.95%.
Flight to safety and strong US jobs data pressure the Mexican Peso
Market mood remains dismal as the US–Iran conflict entered its sixth day with no signs of a de-escalation. Tehran forces attacked two vessels on Thursday, while US President Donald Trump rejected the son of the Ayatollah to lead Iran.
Trump added that he would be involved in deciding Iran’s new leadership, Axios reported, while sirens heard in multiple Gulf nations paint a gloomy geopolitical scenario, which favors further US Dollar appreciation to the detriment of the Mexican currency.
The US Labor Department reported that Initial Jobless Claims totaled 213K for the week ending February 28, below the expected 215K, suggesting ongoing strength in the labor market.
Data from Challenger, Gray & Christmas indicated that announced layoffs dropped to 48,300 in February, a 55% decrease from January’s 108,435. Digging into the report, hiring plans soared 140% from January but were down 63% compared to last February.
Investors trimmed Fed dovish bets
Following the data, Richmond Fed President Thomas Barkin said inflation remains sticky and that recent labor market data was solid. He added that the balance of risks could change as recent inflation data raises questions about whether the central bank has fully won the battle against higher prices.
Money markets had priced in a less-dovish Fed, according to Prime Market Terminal data. A day ago, traders priced in 40 basis points (bps) of easing towards the year’s end, but it fell to 35 bps as of writing.
The Fed Beige Book highlighted those economic expectations “were optimistic” with most districts expecting “moderate growth.” Regarding the labor market, officials find conditions “generally stable,” yet the low-hiring, low-firing scenario persists.
Across the southern border, Gross Fixed Investment in Mexico was unchanged in December, after a -6.5% decline in November, but exceeded forecasts for a 2.8% drop, and was 0.5%, little changed.
Next week, traders will eye the release of Mexican inflation figures. In the US, Friday’s Nonfarm Payrolls for February is awaited, along with the unemployment rate.
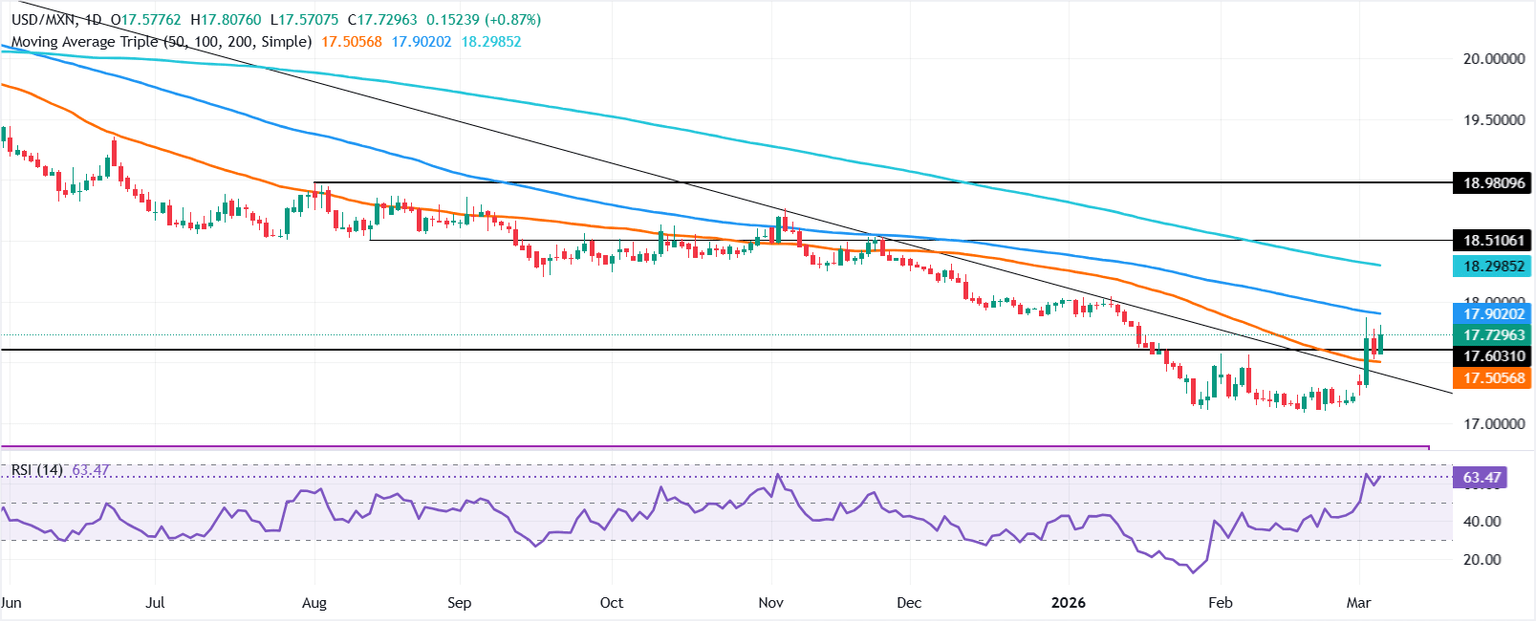
USD/MXN Price Forecast: Downtrend intact unless bulls reclaim 18.00
The USD/MXN technical picture is mixed. Although price action is respecting the market structure of lower-highs and lower-lows, the break of a resistance trendline drawn from around April’s 2025 highs near 21.07 broke on March 3, increasing speculation of an upward correction.
The Relative Strength Index (RSI) has been bullish, after spending time below its 50-neutral level since the end of November 2025, a sign that sellers are losing some strength. In addition to this, if the index clears the latest peak at 64.88, it will mean that buyers are stepping in.
For a bullish resumption, traders must clear the 100-day SMA at 17.90. If surpassed, the next key resistance is 18.00, followed by the 200-day SMA at 18.30. Downwards lies the 50- and 20-day SMAs, each at 17.49 and 17.26, respectively. On further weakness, the 17.00 figure is up next.
Mexican Peso FAQs
The Mexican Peso (MXN) is the most traded currency among its Latin American peers. Its value is broadly determined by the performance of the Mexican economy, the country’s central bank’s policy, the amount of foreign investment in the country and even the levels of remittances sent by Mexicans who live abroad, particularly in the United States. Geopolitical trends can also move MXN: for example, the process of nearshoring – or the decision by some firms to relocate manufacturing capacity and supply chains closer to their home countries – is also seen as a catalyst for the Mexican currency as the country is considered a key manufacturing hub in the American continent. Another catalyst for MXN is Oil prices as Mexico is a key exporter of the commodity.
The main objective of Mexico’s central bank, also known as Banxico, is to maintain inflation at low and stable levels (at or close to its target of 3%, the midpoint in a tolerance band of between 2% and 4%). To this end, the bank sets an appropriate level of interest rates. When inflation is too high, Banxico will attempt to tame it by raising interest rates, making it more expensive for households and businesses to borrow money, thus cooling demand and the overall economy. Higher interest rates are generally positive for the Mexican Peso (MXN) as they lead to higher yields, making the country a more attractive place for investors. On the contrary, lower interest rates tend to weaken MXN.
Macroeconomic data releases are key to assess the state of the economy and can have an impact on the Mexican Peso (MXN) valuation. A strong Mexican economy, based on high economic growth, low unemployment and high confidence is good for MXN. Not only does it attract more foreign investment but it may encourage the Bank of Mexico (Banxico) to increase interest rates, particularly if this strength comes together with elevated inflation. However, if economic data is weak, MXN is likely to depreciate.
As an emerging-market currency, the Mexican Peso (MXN) tends to strive during risk-on periods, or when investors perceive that broader market risks are low and thus are eager to engage with investments that carry a higher risk. Conversely, MXN tends to weaken at times of market turbulence or economic uncertainty as investors tend to sell higher-risk assets and flee to the more-stable safe havens.
Dow Jones Industrial Average tumbles as Iran situation broils
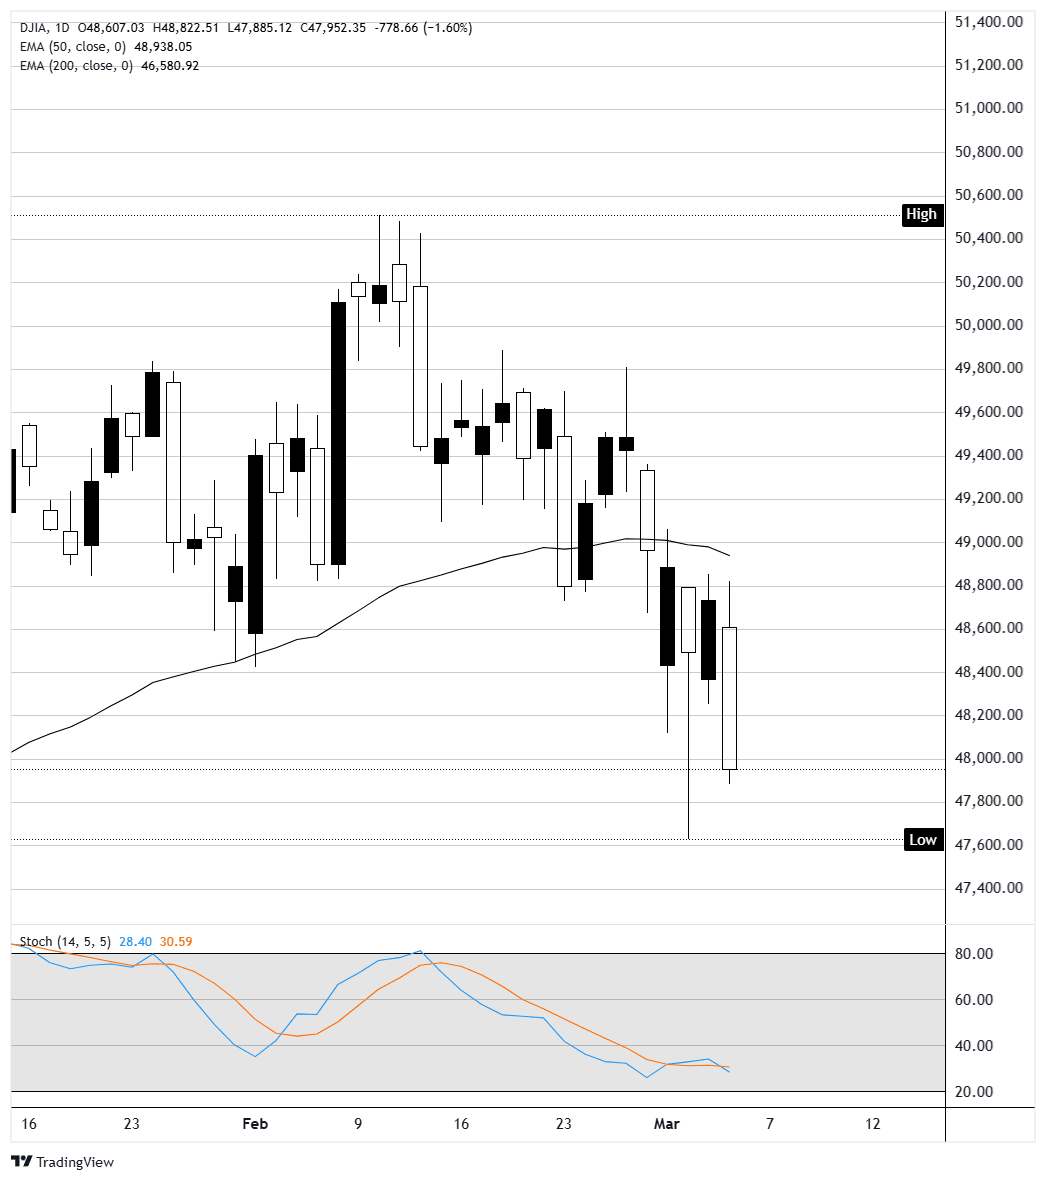
The Dow Jones Industrial Average was down 840 points, or 1.73%, to 47,885 at the time of writing, giving back all of Wednesday’s gains and then some. The S&P 500 fell 0.82% to around 6,810, while the Nasdaq Composite dipped 0.50% to the 22,690 region. The Russell 2000 dropped 1.65% to land near 2,590, with small caps bearing the brunt of the risk-off shift. Thursday’s selling was broad, but the Dow’s underperformance was notable, dragged lower by defensive and consumer staple names including Merck (MRK), Johnson & Johnson (JNJ), and Walmart (WMT), all falling more than 2%.
Iran conflict sends Oil to nine-month highs
The catalyst for Thursday’s selloff was a fresh escalation in the Middle East. Iran claimed it struck an Oil tanker with a missile, according to state media reports, while the British Navy confirmed a large explosion at a tanker at anchor in Iraqi territorial waters. West Texas Intermediate (WTI) crude futures surged 6% to trade above $79 per barrel — its highest since June 2025 — while Brent crude jumped 3% to over $84. Tanker traffic through the Strait of Hormuz has effectively ground to a halt since the US-Israeli war against Iran began last weekend, with Iran’s Revolutionary Guard having ordered the strait’s closure and threatened to attack any vessel that passes through. Around 20% of global Oil consumption is exported through the waterway. President Trump said earlier in the week that the US would provide political risk insurance for tankers and, if necessary, US Navy escorts, but the missile strike on Thursday undercut that reassurance.
Rate cut bets narrow as Oil-driven inflation fears build
The sharp move higher in crude is starting to filter into rate expectations. Traders are now positioning for just a single Federal Reserve (Fed) rate cut this year, down from expectations of multiple cuts as recently as last week. According to the CME FedWatch tool, there is roughly a 96% probability that the Fed holds rates steady at 3.50-3.75% at its March 18 meeting. The repricing reflects growing concern that a prolonged conflict could push energy costs sustainably higher, reigniting inflationary pressures just as the Personal Consumption Expenditures Price Index (PCE) data from late February already rattled markets with a hotter-than-expected print. Treasury yields moved higher on Thursday, adding to the pressure on equity valuations. The combination of sticky inflation and geopolitical risk premium has created a difficult backdrop for the Fed, which had been widely expected to resume cutting later this year.
Broadcom bucks the selloff with blockbuster AI earnings
Broadcom (AVGO) was a rare bright spot, rallying around 6% after reporting first-quarter results that beat on both the top and bottom line. The chipmaker posted earnings per share of $2.05 versus $2.03 expected and revenue of $19.31 billion versus $19.18 billion estimated, a 29% increase year-over-year. The standout was AI revenue of $8.4 billion, up 106% year-over-year, driven by surging demand for custom AI accelerators and networking chips. CEO Hock Tan told analysts the company has a line of sight to AI chip revenue exceeding $100 billion in 2027. Broadcom guided second-quarter revenue to approximately $22 billion, implying 47% year-over-year growth, and announced a new $10 billion share repurchase program. Salesforce (CRM) also outperformed, gaining nearly 5%, while Microsoft (MSFT) and IBM (IBM) eked out modest gains in an otherwise ugly session for the Dow.
Gold and safe havens hold firm above $5K
Gold continued to attract safe-haven flows on Thursday, trading around $5,175 per ounce — up roughly 1% on the day — as the widening Middle East conflict kept demand elevated. The precious metal has climbed about 20% year-to-date, supported by central bank buying, geopolitical uncertainty, and a softer US Dollar. Silver was also firmer, rising over 1% to around $84.50. Separately, Berkshire Hathaway (BRK.B) disclosed that it has resumed share buybacks for the first time since 2024, with new CEO Greg Abel purchasing $15 million worth of stock personally. Abel told CNBC he consulted with Warren Buffett on the timing and valuation. Bitcoin also continued to attract interest as an alternative haven, trading above $71K after gaining roughly 5% on Wednesday.
Labor market steady ahead of Friday’s payrolls report
Thursday’s weekly initial Jobless Claims data showed filings unchanged at 213K for the week ending February 28, slightly below the consensus estimate of 215K. Continuing claims rose by 46K to 1.868 million, modestly above the 1.850 million expected. The data points to a labor market that remains stable, with low firing activity offsetting a gradual slowdown in hiring. Initial claims filed by federal employees — closely watched for signs of disruption from government shutdowns — fell by 25 to 529. The focus now shifts to Friday’s February Nonfarm Payrolls (NFP) report, where economists expect payroll growth of around 60K and an unchanged unemployment rate of 4.3%. A weak print could reignite rate cut speculation, while a hot number would further cement the single-cut-in-2026 narrative that took hold this week.
Dow Jones daily chart
Dow Jones FAQs
The Dow Jones Industrial Average, one of the oldest stock market indices in the world, is compiled of the 30 most traded stocks in the US. The index is price-weighted rather than weighted by capitalization. It is calculated by summing the prices of the constituent stocks and dividing them by a factor, currently 0.152. The index was founded by Charles Dow, who also founded the Wall Street Journal. In later years it has been criticized for not being broadly representative enough because it only tracks 30 conglomerates, unlike broader indices such as the S&P 500.
Many different factors drive the Dow Jones Industrial Average (DJIA). The aggregate performance of the component companies revealed in quarterly company earnings reports is the main one. US and global macroeconomic data also contributes as it impacts on investor sentiment. The level of interest rates, set by the Federal Reserve (Fed), also influences the DJIA as it affects the cost of credit, on which many corporations are heavily reliant. Therefore, inflation can be a major driver as well as other metrics which impact the Fed decisions.
Dow Theory is a method for identifying the primary trend of the stock market developed by Charles Dow. A key step is to compare the direction of the Dow Jones Industrial Average (DJIA) and the Dow Jones Transportation Average (DJTA) and only follow trends where both are moving in the same direction. Volume is a confirmatory criteria. The theory uses elements of peak and trough analysis. Dow’s theory posits three trend phases: accumulation, when smart money starts buying or selling; public participation, when the wider public joins in; and distribution, when the smart money exits.
There are a number of ways to trade the DJIA. One is to use ETFs which allow investors to trade the DJIA as a single security, rather than having to buy shares in all 30 constituent companies. A leading example is the SPDR Dow Jones Industrial Average ETF (DIA). DJIA futures contracts enable traders to speculate on the future value of the index and Options provide the right, but not the obligation, to buy or sell the index at a predetermined price in the future. Mutual funds enable investors to buy a share of a diversified portfolio of DJIA stocks thus providing exposure to the overall index.
United States Challenger Job Cuts fell from previous 108.435K to 48.307K in February
Gold price extends its gains for the second successive session on Thursday as traders seek safety amid the ongoing war in the Middle East. US and Israeli strikes across Iranian territory and widespread Iranian missile and drone retaliation across the Middle East, including attacks on regional targets and military sites, prolong the crisis and its impact.
Switzerland Unemployment Rate s.a (MoM) increased to 3% in February from previous 2.9%
Gold price extends its gains for the second successive session on Thursday as traders seek safety amid the ongoing war in the Middle East. US and Israeli strikes across Iranian territory and widespread Iranian missile and drone retaliation across the Middle East, including attacks on regional targets and military sites, prolong the crisis and its impact.
Trump presses Congress on CLARITY bill after meeting with Coinbase CEO

US President Donald Trump is urging legislators to pass the CLARITY Act after allegedly meeting with Coinbase CEO Brian Armstrong amid growing dispute over stablecoin yields.
Stablecoin yield dispute escalates as Trump presses Senate on crypto legislation
US President Donald Trump has urged Congress to pass the crypto market structure legislation, putting pressure on lawmakers.
In a Truth Social post on Tuesday, Trump called for swift approval of the CLARITY Act and accused major banks of attempting to weaken existing crypto reforms.
“The US needs to get Market Structure done, ASAP. Americans should earn more money on their money,” Trump wrote, adding that banks should not “hold The Clarity Act hostage.”
The President’s comments allegedly followed a private White House meeting with Coinbase CEO Brian Armstrong earlier on Tuesday, Politico reported, citing two people familiar with the matter. Details of the discussion were not disclosed.
The legislative standoff centers on whether third parties should be permitted to offer yield or rewards on customer holdings.
The CLARITY Act seeks to define regulatory oversight for digital assets by delineating authority between the Securities and Exchange Commission (SEC) and the Commodity Futures Trading Commission (CFTC).
It builds on the GENIUS Act, signed into law in July, which established a federal framework for stablecoins but prohibited issuers from paying interest to avoid replicating traditional banking activities without equivalent regulation. However, the bill didn’t prevent third parties, like exchanges, from offering yield. Banks are aiming to close that “loophole” through the CLARITY bill.
Crypto firms, including Coinbase, argue that restricting yield payments limits innovation and reduces competitiveness. Banking groups counter that allowing stablecoin issuers to offer interest-like products without full banking oversight would create regulatory arbitrage and introduce systemic risks.
The debate intensified after JPMorgan CEO Jamie Dimon addressed the issue in a CNBC interview. Dimon noted that stablecoin issuers offering rewards or yield should be regulated under the same standards as traditional banks.
“Rewards are the same as interest,” he said, adding that firms holding customer balances and paying returns should be subject to capital requirements, liquidity rules, anti-money laundering standards, and other banking regulations.
He warned that yield-bearing stablecoins could divert deposits from traditional institutions and disrupt lending markets if not subject to equivalent oversight.
With Senate negotiations ongoing, lawmakers now face mounting pressure to resolve the stablecoin yield dispute and deliver the market structure legislation, which has been on hold since July.