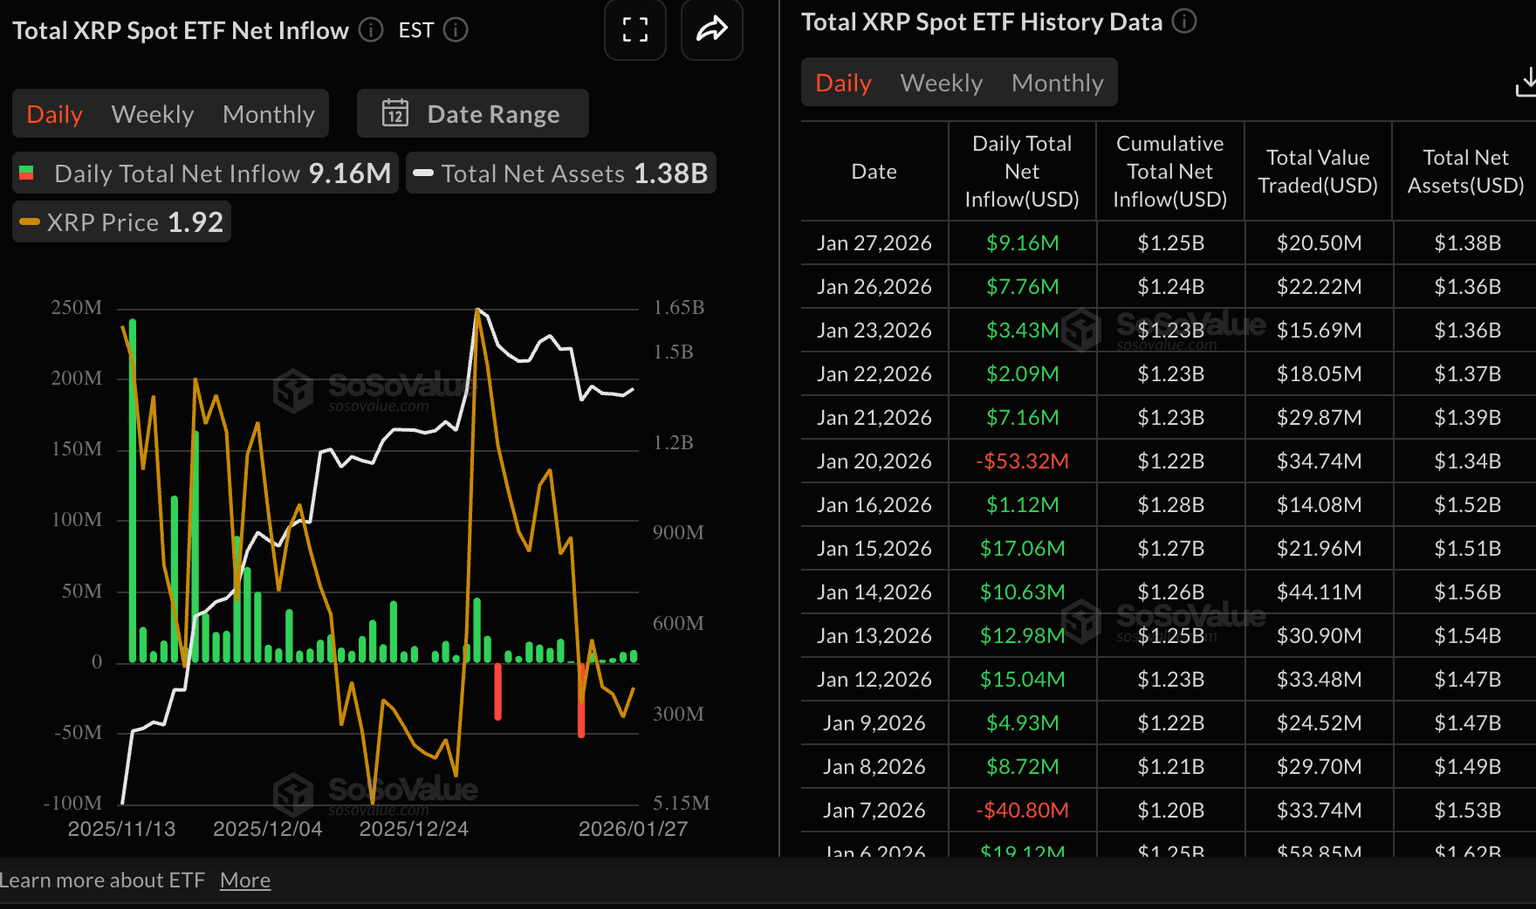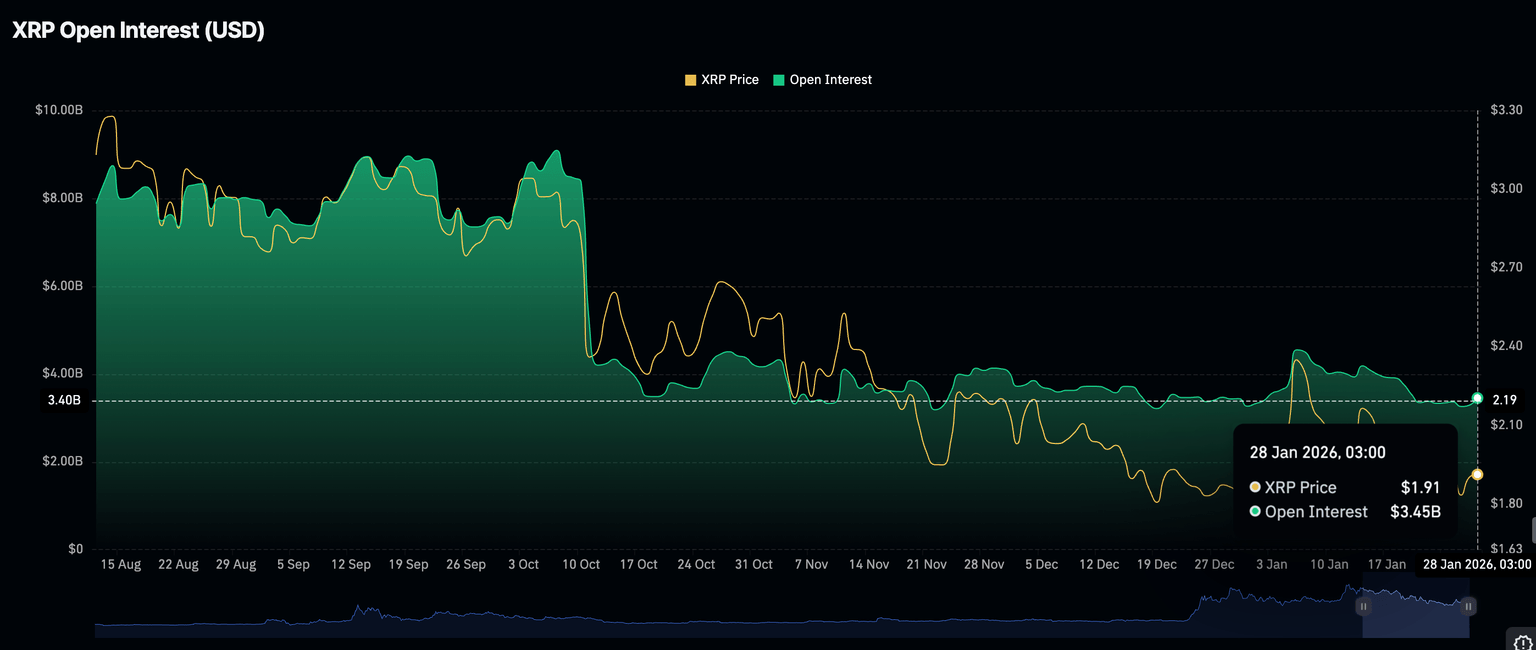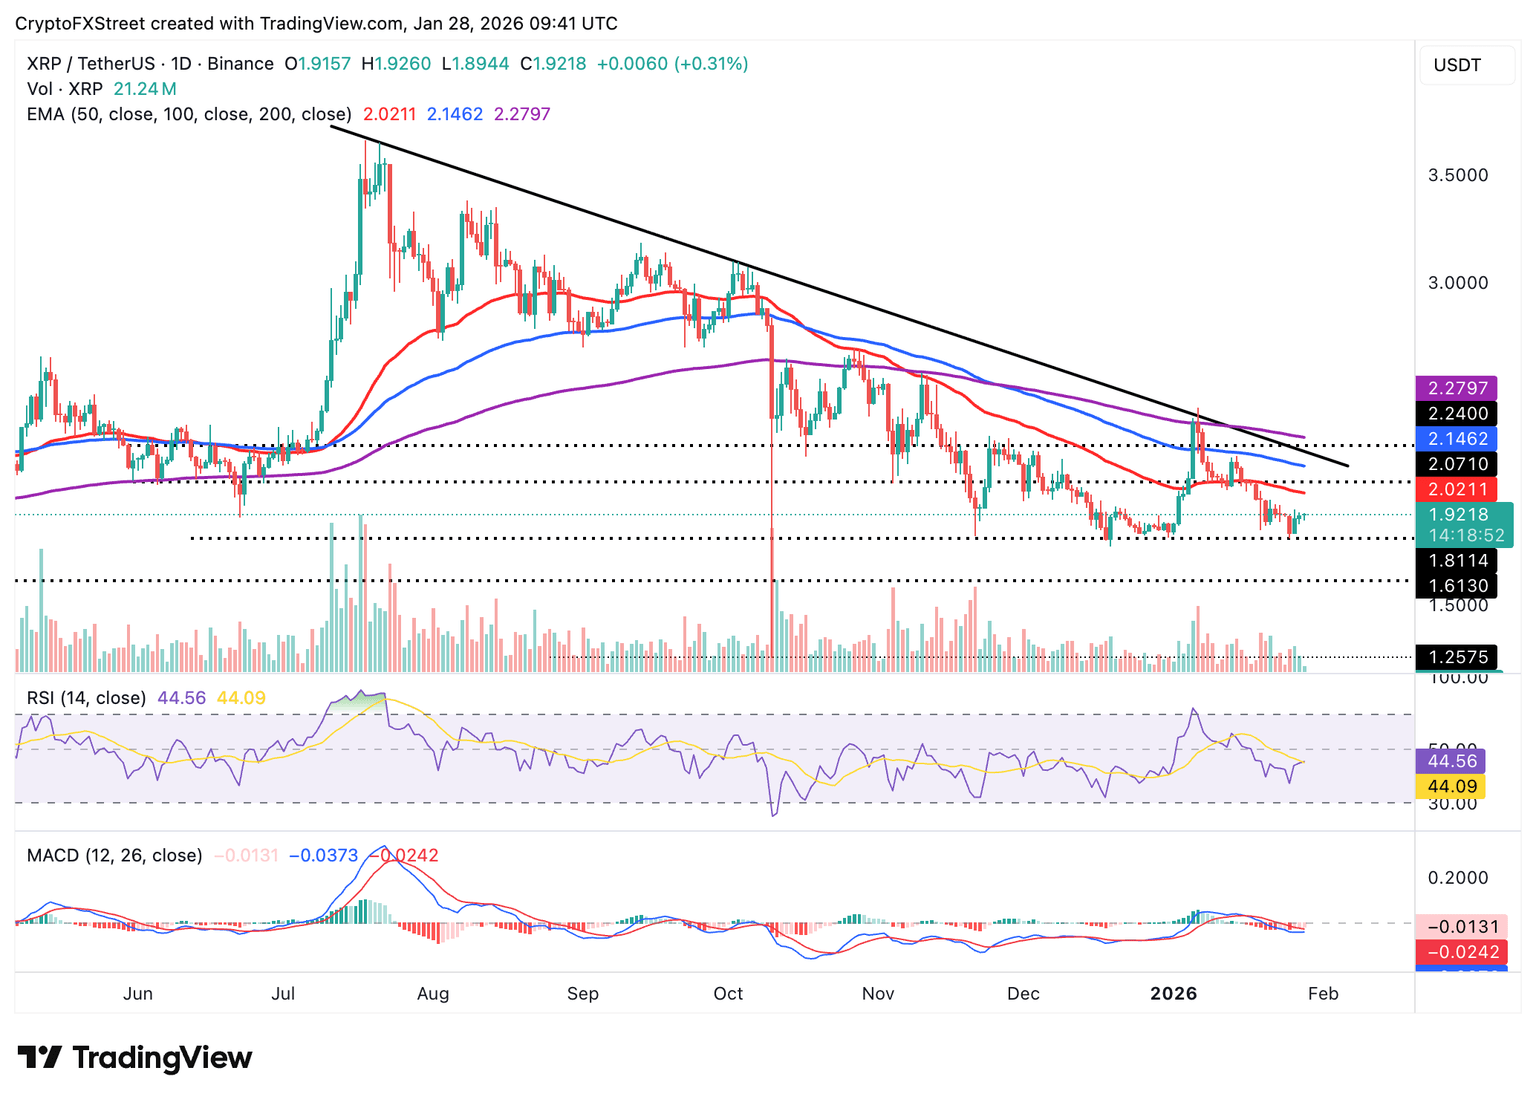
Bitcoin, Ethereum and Ripple are struggling to sustain their recovery on Friday, reflecting a sticky bearish sentiment. Since the October 10 flash crash, which liquidated over $19 billion in crypto assets in a single day, retail interest in crypto assets has been significantly suppressed.
China NBS Non-Manufacturing PMI down to 49.5 in November from previous 50.1
Bitcoin, Ethereum and Ripple are struggling to sustain their recovery on Friday, reflecting a sticky bearish sentiment. Since the October 10 flash crash, which liquidated over $19 billion in crypto assets in a single day, retail interest in crypto assets has been significantly suppressed.
UK set to launch crypto tax evasion measures in 2026

UK crypto exchanges will be required to report detailed transaction data on resident users to HM Revenue & Customs (HMRC) starting January 1, 2026, strengthening tax compliance among crypto investors in the region.
UK prepares fresh tax compliance rules for crypto exchanges
The UK is preparing to tighten oversight of digital asset activity, with new rules requiring crypto exchanges to provide HMRC with user data beginning in 2026.
Platforms must start collecting information on user transactions starting from January 1, 2026, under the new Crypto-Asset Reporting Framework (CARF).
The requirement forms part of a broad update to how the government monitors crypto-related income. Exchanges operating in the region will need to store full transaction histories for every UK-based customer, a change that could effectively remove the anonymity gap many crypto traders rely on.
CARF was introduced to close gaps left by the existing Common Reporting Standard (CRS), which does not cover crypto transactions and risks creating blind spots for tax authorities.
The expanded requirement provides HMRC with a consistent dataset for compliance checks, enabling the agency to detect tax evasion more effectively and ensure taxpayers meet their obligations.
Under the new structure, crypto exchanges will be designated as Reporting Cryptoasset Service Providers (RCASPs). The requirement is not directed towards individual users and is expected to have only a minimal effect on the crypto industry. HMRC estimates that around 50 businesses may need to make minor adjustments to capture transaction data for UK-resident customers, including software updates and additional record-keeping.
Once received, the data will be used to determine tax liability without relying on personal filings. Platforms that fail to meet the disclosure requirements will face penalties.
With the countdown to 2026 already underway, British crypto investors now face a far more transparent tax environment and significantly less room for error when reporting their digital asset activity.
The reporting system adds to the recent increase in crypto regulations over the past year. Several regulatory agencies, including those in the US and the EU, are increasingly seeking ways to ensure proper guidelines for managing crypto-related activities in their respective regions.
Amundi tokenizes €5 billion money market fund on Ethereum

Amundi has rolled out a tokenized share class for its AMUNDI FUNDS CASH EUR fund, developed with CACEIS and issued on the Ethereum blockchain.
Amundi brings money market fund on-chain in partnership with CACEIS
Amundi, Europe’s leading asset manager, announced the launch of a tokenized share class of the AMUNDI FUNDS CASH EUR money market fund on Thursday, a milestone made possible through its partnership with CACEIS, a key European player in asset servicing.
The inaugural transaction took place on November 4, marking the start of hybrid distribution for the fund, which will remain available through traditional channels alongside its new tokenized share class, AMUNDI FUNDS CASH EUR – J28 EUR DLT (C).
The initiative leverages the Ethereum blockchain to record fund units transparently and ensure secure, traceable transaction flows. By introducing a tokenized share class, Amundi is positioning itself within the growing segment of blockchain-enabled fund infrastructure in Europe, a market increasingly shaped by regulatory clarity and institutional experimentation.
“The tokenization of assets is a transformation set to accelerate in the coming years around the world. This first initiative on a money market fund demonstrates our expertise and the robustness of our methodology in covering concrete use cases,” said Jean-Jacques Barbéris, Head of Institutional and Corporate Clients, and ESG at Amundi.
The move signals a rise in tokenization in Europe, with Amundi’s new fund mirroring that of BlackRock’s BUIDL fund, which launched in March 2024.
Amundi’s choice of Ethereum adds to the picture. Ethereum is the largest blockchain for tokenized assets, with a market capitalization of $11.5 billion, according to RWA.xyz. This far outpaces BNB Chain and Solana networks, which follow behind with tokenized values of $1.6 billion and $827 million, respectively.
Standard Chartered previously predicted that Ethereum would lead the tokenization boom, emphasizing the network’s proven stability. The bank noted that Ethereum has operated for more than a decade without a single mainnet outage, arguing that advantages like higher speed or lower fees on alternative blockchains are ultimately “irrelevant” compared with Ethereum’s reliability, security, and established ecosystem.
The bank’s outlook reinforces the broader context behind Amundi’s move. Standard Chartered estimates that tokenized money-market funds and listed equities could each account for roughly $750 billion of an expected $2 trillion tokenized-assets market in the coming years. The remaining growth, according to the firm, will stem from tokenized funds, private equity, commodities, corporate debt, and real estate.
Amundi’s introduction of a blockchain-native share class adds another major institution to the roster of traditional finance players turning to Ethereum as the foundational layer for real-world asset tokenization.
Euro stays firm above 1.1600 as dovish December bets rise to 87%
EUR/USD steadies during Friday’s North American session set to finish the week and November’s in positive territory with gains o 0.81% and 0.59%, respectively as traders seem certain that the Federal Reserve will cut rates in December. The pair trades at 1.1601 after bouncing off daily lows of 1.1555.
Euro ends week and month higher as dovish Fed signals outweigh mixed US data
The US Dollar treads water amid growing speculation for a rate cut. Data from the CME FedWatch Tool shows that the odds for a 25-basis points reduction to the fed funds rate at 87% for the December meeting. The repricing was triggered by dovish comments of New York Fed John Williams and Fed Governor Christopher Waller, who favored reducing borrowing costs at the December meeting.
Data was mixed during the week. Inflation in the producer side stabilized, while jobs data revealed by the US Department of Labor, showed that the number of Americans filling for unemployment benefits, trimmed compared to the previous print.
Across the pond, Retail Sales in Germany missed estimates of October, while the Harmonized Index of Consumer Prices (HICP) for November exceeded forecasts, approaching the 3% threshold. In France, the Gross Domestic Product (GDP) for Q3 was aligned with estimates and the preliminary reading, while Spanish HICP broke the 3% threshold.
Given the backdrop, the EUR/USD path of least resistance is tilted to the upside, as the European Central Bank (ECB) hinted that its easing cycle was over, while the Fed is expected to cut in December.
Next week’s US economic calendar will be packed, featuring the November ISM Manufacturing and Services PMIs, Industrial Production, the ADP Employment Change report, and Initial Jobless Claims for the week ending November 29.
Euro Price This Month
The table below shows the percentage change of Euro (EUR) against listed major currencies this month. Euro was the strongest against the Japanese Yen.
| USD | EUR | GBP | JPY | CAD | AUD | NZD | CHF | |
|---|---|---|---|---|---|---|---|---|
| USD | -0.31% | -0.69% | 1.38% | -0.09% | 0.10% | 0.07% | 0.17% | |
| EUR | 0.31% | -0.39% | 1.63% | 0.22% | 0.39% | 0.38% | 0.48% | |
| GBP | 0.69% | 0.39% | 2.03% | 0.61% | 0.76% | 0.77% | 0.87% | |
| JPY | -1.38% | -1.63% | -2.03% | -1.44% | -1.24% | -1.26% | -1.19% | |
| CAD | 0.09% | -0.22% | -0.61% | 1.44% | 0.12% | 0.16% | 0.26% | |
| AUD | -0.10% | -0.39% | -0.76% | 1.24% | -0.12% | -0.00% | 0.11% | |
| NZD | -0.07% | -0.38% | -0.77% | 1.26% | -0.16% | 0.00% | 0.09% | |
| CHF | -0.17% | -0.48% | -0.87% | 1.19% | -0.26% | -0.11% | -0.09% |
The heat map shows percentage changes of major currencies against each other. The base currency is picked from the left column, while the quote currency is picked from the top row. For example, if you pick the Euro from the left column and move along the horizontal line to the US Dollar, the percentage change displayed in the box will represent EUR (base)/USD (quote).
Daily market movers: Euro poised to extend gains amid Dollar weakness
- The shared currency is propelled by a weak US Dollar as depicted by the US Dollar Index (DXY). DXY, which tracks the buck’s value against a basket of six peers, is down 0.08% at 99.44.
- German’s HICP annual rate rose by 2.6% above forecasts of 2.4%, up from 2.3% in September. Other data in France, GDP for Q3 2025 rose by 0.1% QoQ beating forecasts and up from 0% in Q2.
- Finally, Spain’s HICP expanded by 3.1% YoY in November, down from 3.2% a month ago, but exceeded forecasts of 2.9%.
Technical Outlook: EUR/USD subdued around 1.1600 waiting for catalyst
EUR/USD continues to trade sideways, with buyers unable to decisively break above the 1.1600 threshold to extend the advance toward the confluence of the 50- and 100-day Simple Moving Averages (SMAs) at 1.1620/1.1643. Momentum remains mildly positive, as reflected by the Relative Strength Index (RSI), although the indicator has flattened—suggesting that consolidation is likely to persist in the near term.
A clear breakout above the 50-/100-day SMA cluster would expose 1.1650, and once cleared, open the way for a test of the 1.1700 handle.
On the flip side, the Euro tumbling below 1.1550 increases the risk of a slide toward 1.1500. Further weakness would expose the November 5 swing low at 1.1468, followed by the 200-day SMA near 1.1431.

Euro FAQs
The Euro is the currency for the 20 European Union countries that belong to the Eurozone. It is the second most heavily traded currency in the world behind the US Dollar. In 2022, it accounted for 31% of all foreign exchange transactions, with an average daily turnover of over $2.2 trillion a day.
EUR/USD is the most heavily traded currency pair in the world, accounting for an estimated 30% off all transactions, followed by EUR/JPY (4%), EUR/GBP (3%) and EUR/AUD (2%).
The European Central Bank (ECB) in Frankfurt, Germany, is the reserve bank for the Eurozone. The ECB sets interest rates and manages monetary policy.
The ECB’s primary mandate is to maintain price stability, which means either controlling inflation or stimulating growth. Its primary tool is the raising or lowering of interest rates. Relatively high interest rates – or the expectation of higher rates – will usually benefit the Euro and vice versa.
The ECB Governing Council makes monetary policy decisions at meetings held eight times a year. Decisions are made by heads of the Eurozone national banks and six permanent members, including the President of the ECB, Christine Lagarde.
Eurozone inflation data, measured by the Harmonized Index of Consumer Prices (HICP), is an important econometric for the Euro. If inflation rises more than expected, especially if above the ECB’s 2% target, it obliges the ECB to raise interest rates to bring it back under control.
Relatively high interest rates compared to its counterparts will usually benefit the Euro, as it makes the region more attractive as a place for global investors to park their money.
Data releases gauge the health of the economy and can impact on the Euro. Indicators such as GDP, Manufacturing and Services PMIs, employment, and consumer sentiment surveys can all influence the direction of the single currency.
A strong economy is good for the Euro. Not only does it attract more foreign investment but it may encourage the ECB to put up interest rates, which will directly strengthen the Euro. Otherwise, if economic data is weak, the Euro is likely to fall.
Economic data for the four largest economies in the euro area (Germany, France, Italy and Spain) are especially significant, as they account for 75% of the Eurozone’s economy.
Another significant data release for the Euro is the Trade Balance. This indicator measures the difference between what a country earns from its exports and what it spends on imports over a given period.
If a country produces highly sought after exports then its currency will gain in value purely from the extra demand created from foreign buyers seeking to purchase these goods. Therefore, a positive net Trade Balance strengthens a currency and vice versa for a negative balance.
Ethereum Price Forecast: ETH shows recovery signs following rising exchange withdrawals
Ethereum price today: $3,050
- Ethereum could post its first weekly gain in five weeks, as buying pressure has begun to outweigh selling.
- Ethereum open interest remained stable, with short liquidations slightly dominating long liquidations.
- ETH is testing the $3,100 resistance after reclaiming the $2,850 key level.
Ethereum (ETH) is on track to mark its first weekly gain since October after showing signs of recovery this week.
The weekly average of ETH exchange netflow plunged to its lowest level in over a month. The trend accelerated on Friday, with outflows on the day outweighing inflows by nearly 180K ETH.
%20-%20All%20Exchanges%20(12)-1764363091239-1764363091245.png&w=1536&q=95)
Exchange net outflows indicate investors are increasingly withdrawing assets from exchanges to private wallets for potential long-term holding.
Institutional investors also joined in the buying activity as ETH exchange-traded funds (ETFs) have seen four consecutive days of net inflows totalling $292 million, per SoSoValue data. The products are on track to record their first weekly inflow in November after ending an eight-day outflow streak last Friday.
On-chain activity is also returning, as Ethereum active addresses have begun trending upward. Notably, the metric spiked above 601,000 on Thursday, its highest level in 2025. The rise shows that investors may be returning to using DeFi protocols and other on-chain platforms.
-1764363128463-1764363128465.png&w=1536&q=95)
Derivatives and on-chain data signal a bearish exhaustion
On the derivatives side, Ethereum’s futures open interest remained fairly stable, rising slightly to 12.1 million ETH on Friday, per Coinglass data. Liquidations slowed down considerably in the week, with liquidated short positions outweighing longs — a stark contrast from previous weeks. This suggests potential exhaustion among bearish traders.
From an on-chain perspective, the risk-off trend paused after ETH fell to the realized price or average cost basis of accumulation addresses — wallets with no record of selling activity — around $2,750-$2,850.
-1764363149808-1764363149809.png&w=1536&q=95)
The same price range marks the average cost basis of whales within the 10K-100K ETH cohort.
Ethereum Price Forecast: ETH tackles $3,100 resistance
On the weekly chart, Ethereum could post its first weekly gains in five weeks after bouncing off the 200-week Exponential Moving Average (EMA) and reclaiming the $2,850 support.
The top altcoin is now facing resistance at $3,100, near the 100-week EMA. A firm rise above $3,100 could see ETH test the $3,470 level, but it has to clear the 50-week EMA on the way up.

The Relative Strength Index (RSI) has paused its downtrend while the Stochastic Oscillator (Stoch) is on the verge of crossing from oversold territory, signaling a decline in dominant bearish momentum.
Mexico Fiscal Balance, pesos: -16.75B (October) vs -198.11B
Bitcoin, Ethereum and Ripple are struggling to sustain their recovery on Friday, reflecting a sticky bearish sentiment. Since the October 10 flash crash, which liquidated over $19 billion in crypto assets in a single day, retail interest in crypto assets has been significantly suppressed.
Gold firm above $4,200 on broad dovish repricing for December
Gold (XAU/USD) rises over 1% on Friday amid a scarce economic docket, but traders are pricing further easing by the Federal Reserve (Fed) at the next meeting, pushing the non-yielding metal past the $4,200 mark for the first time in the last ten days.
Bullion surges over 1% in thin holiday trade as easing expectations climb toward 87% despite mixed US data
Expectations that the Federal Reserve would continue its easing cycle increased as the CME FedWatch Tool shows odds for a 0.25% reduction at the December 9-10 meeting at 87%,. Meanwhile, Fed officials remained muted since Wednesday, heading for Thanksgiving, as the blackout period begins on Saturday.
Policymakers at the Federal Open Market Committee (FOMC) remain split about the next move. Nonetheless, the latest comments from New York Fed John Williams and Fed Governor Christopher Waller poured cold water on the hawks and strengthened the doves’ position ahead of the meeting.
US data has been mixed, with inflation on the producer side seeming to be stalling after the PPI rose to 3.1% YoY in July, before printing back-to-back readings of 2.7%. Even though this opens the door for further easing, the latest Initial Jobless Claims print shows the jobs market remains solid, despite giving signs of weakness.
Given the backdrop, Gold prices could continue to edge up. However, developments pointing towards peace talks between Russia and Ukraine, led by the White House, could cap bullion’s advance amid an obvious sentiment shift.
Next week, the US economic docket will feature the November ISM Manufacturing and Services PMIs, Industrial Production, the ADP Employment Change and Initial Jobless Claims for the week ending November 29.
Daily market moves: Gold advances, but threatened by Russia-Ukraine war de-escalation
- The US Dollar Index (DXY), which tracks the buck’s performance versus six currencies, is down 0.04% at 99.49. At the same time, US Treasury yields recovered, with the 10-year US Treasury note yield up three basis points to 4.023%. US real yields, which correlate inversely to Gold prices, are also up two and a half basis points to 1.785%.
- Ukrainian President Zelensky said that Ukraine and US delegations will meet this week to work out a formula for peace and security, as discussed in Geneva. Meanwhile, Russia wants to move towards peace in Ukraine, despite its belief that Ukrainian President Zelensky is not legitimate.
- Russian President Vladimir Putin said Thursday that President Donald Trump’s proposal “could serve as a basis” for future negotiations but emphasized that no final version exists. Putin reiterated that hostilities will cease only if Ukrainian forces withdraw.
- Physical Gold exports from Hong Kong to China dipped, an indication that the Bullion might remain subdued in the near term.
Technical analysis: Buyers push Gold price above $4,200, eyes on record high
Gold price cleared $4,200, poised to test the November 13 high of $4,245 ahead of the $4,250 figure. Buyers are gathering momentum, as depicted by the Relative Strength Index (RSI), suggesting further upside.
Given the backdrop, if XAU/USD climbs past $4,300, the next resistance would be the record high of $4,381. On the flip side, if Gold tumbles below $4,200, the next support would be the November 25 low of $4,109, followed by the 20-day Simple Moving Average (SMA) at $4,078.

Gold FAQs
Gold has played a key role in human’s history as it has been widely used as a store of value and medium of exchange. Currently, apart from its shine and usage for jewelry, the precious metal is widely seen as a safe-haven asset, meaning that it is considered a good investment during turbulent times. Gold is also widely seen as a hedge against inflation and against depreciating currencies as it doesn’t rely on any specific issuer or government.
Central banks are the biggest Gold holders. In their aim to support their currencies in turbulent times, central banks tend to diversify their reserves and buy Gold to improve the perceived strength of the economy and the currency. High Gold reserves can be a source of trust for a country’s solvency. Central banks added 1,136 tonnes of Gold worth around $70 billion to their reserves in 2022, according to data from the World Gold Council. This is the highest yearly purchase since records began. Central banks from emerging economies such as China, India and Turkey are quickly increasing their Gold reserves.
Gold has an inverse correlation with the US Dollar and US Treasuries, which are both major reserve and safe-haven assets. When the Dollar depreciates, Gold tends to rise, enabling investors and central banks to diversify their assets in turbulent times. Gold is also inversely correlated with risk assets. A rally in the stock market tends to weaken Gold price, while sell-offs in riskier markets tend to favor the precious metal.
The price can move due to a wide range of factors. Geopolitical instability or fears of a deep recession can quickly make Gold price escalate due to its safe-haven status. As a yield-less asset, Gold tends to rise with lower interest rates, while higher cost of money usually weighs down on the yellow metal. Still, most moves depend on how the US Dollar (USD) behaves as the asset is priced in dollars (XAU/USD). A strong Dollar tends to keep the price of Gold controlled, whereas a weaker Dollar is likely to push Gold prices up.
Silver Price Forecast: XAG/USD surges to record high above $56 amid bullish momentum
Silver (XAG/USD) climbs to a fresh all-time high on Friday, buoyed by dovish Federal Reserve (Fed) expectations alongside strong industrial and investment demand. At the time of writing, XAG/USD is trading around $56.40, with prices up over 12% this week and on track to log a seventh straight monthly gain.
A tightening supply backdrop is adding further support to the rally, with reports indicating that inventories at Shanghai Futures Exchange warehouses have dropped to their lowest level since 2015. Market data also show that physical Silver turnover on the Shanghai Gold Exchange has slipped to a nine-year low.
According to the Silver Institute, 2025 is on track to mark the fifth consecutive year of a structural supply deficit, with global output from mining and recycling still struggling to keep pace with rising demand from solar, electronics and investment channels.

From a technical standpoint, bulls remain firmly in control, driving XAG/USD deeper into uncharted territory after a clean breakout from the falling-wedge formation. The rally comes after a period of subdued momentum, marking a clear shift back in favour of upward continuation.
XAG/USD continues to trade comfortably above all major moving averages, reinforcing the strength of the prevailing uptrend. The 21-day Simple Moving Average (SMA) near $50.72 is rising steadily and remains the first layer of dynamic support, while the 50-day and 100-day SMAs sit much lower.
On the downside, any pullback is likely to attract fresh dip-buying interest, with initial support at the $55.00-$54.00 zone. A break below this area would shift attention toward the $50.70-$50.00 region, reinforced by the rising 21-day SMA.
Momentum indicators support the bullish narrative. The Moving Average Convergence Divergence (MACD) extends above the Signal line, with both in positive territory and a widening histogram, suggesting strengthening bullish momentum. The Relative Strength Index (RSI) has climbed to 71, entering overbought territory, although there are no clear signs of exhaustion.
Silver FAQs
Silver is a precious metal highly traded among investors. It has been historically used as a store of value and a medium of exchange. Although less popular than Gold, traders may turn to Silver to diversify their investment portfolio, for its intrinsic value or as a potential hedge during high-inflation periods. Investors can buy physical Silver, in coins or in bars, or trade it through vehicles such as Exchange Traded Funds, which track its price on international markets.
Silver prices can move due to a wide range of factors. Geopolitical instability or fears of a deep recession can make Silver price escalate due to its safe-haven status, although to a lesser extent than Gold’s. As a yieldless asset, Silver tends to rise with lower interest rates. Its moves also depend on how the US Dollar (USD) behaves as the asset is priced in dollars (XAG/USD). A strong Dollar tends to keep the price of Silver at bay, whereas a weaker Dollar is likely to propel prices up. Other factors such as investment demand, mining supply – Silver is much more abundant than Gold – and recycling rates can also affect prices.
Silver is widely used in industry, particularly in sectors such as electronics or solar energy, as it has one of the highest electric conductivity of all metals – more than Copper and Gold. A surge in demand can increase prices, while a decline tends to lower them. Dynamics in the US, Chinese and Indian economies can also contribute to price swings: for the US and particularly China, their big industrial sectors use Silver in various processes; in India, consumers’ demand for the precious metal for jewellery also plays a key role in setting prices.
Silver prices tend to follow Gold’s moves. When Gold prices rise, Silver typically follows suit, as their status as safe-haven assets is similar. The Gold/Silver ratio, which shows the number of ounces of Silver needed to equal the value of one ounce of Gold, may help to determine the relative valuation between both metals. Some investors may consider a high ratio as an indicator that Silver is undervalued, or Gold is overvalued. On the contrary, a low ratio might suggest that Gold is undervalued relative to Silver.
US Dollar Weekly Forecast: Strong resistance emerges around 100.40
The week that was
This week, the US Dollar has faced significant challenges. It spent every session on the defensive, pulling the Dollar Index (DXY) back from last week’s gains and putting the focus firmly on the downside for now.
The pressure has been broad-based, with US Treasury yields slipping across the curve, and holiday-thinned trading around Thanksgiving giving little support for the Greenback. The market’s ongoing shift toward pricing in more Federal Reserve (Fed) rate cuts has been the dominant driver, leaving the DXY struggling to push beyond what now looks like a short-term ceiling around 100.40.
Adding to the currency’s challenges, Fed officials have maintained a divided stance on the monetary policy outlook, particularly regarding the pace and extent of rate cuts, which has left investors cautious and the Greenback vulnerable.
The Fed’s cautious view seems to be fizzling out
The Fed’s late-October meeting delivered exactly what markets had expected, a quarter-point rate cut, passed by a solid 10–2 vote. That move took the benchmark rate down to 3.75–4.00%, broadly in line with forecasts, but still enough to stir some internal debate.
What surprised many wasn’t the cut itself, but the Fed’s quiet decision to resume small-scale Treasury purchases. Officials said it was a technical move to ease emerging strains in money markets. The deeper message, however, was unmistakable: Liquidity had tightened more than they were comfortable with.
At his press conference, Chair Jerome Powell emphasised the uncertainty. He acknowledged the division within the committee and cautioned investors against taking the December cut for granted. The tone was cautious, a clear sign that policymakers are still wrestling with mixed signals: Inflation remains sticky while the labour market is cooling, but it is not collapsing.
Markets took Powell at his word, mostly, but not entirely. That said, there is still nearly an 80% chance of another cut at the December 10 meeting, and roughly 90 basis points for easing are pencilled in by the end of 2026.
December rate cut: A close call
Federal Reserve officials continued to lay out their views this week ahead of the blackout period, which kicks off on Saturday. The verdict for the next decision appears far from clear.
That said, Fed Governor Christopher Waller said on Monday that the latest figures pointed to a still-fragile US labour market, weak enough, in his view, to justify another 25-basis-point rate cut when policymakers meet on December 9–10. He also noted that what happens next would depend heavily on a “flood” of upcoming data as agencies clear backlogs left by the government shutdown.
Meanwhile, Federal Reserve Governor Stephen Miran suggested that the softening in employment was a direct result of the Fed’s current short-term rate setting. Miran was said to have renewed his push for more forceful rate cuts, arguing that inflation pressures should continue to fade over time.
What’s in store for the US Dollar
With recent data disruptions still causing uncertainty, markets are left guessing not only what the numbers will show but also when they’ll actually arrive. Even so, attention remains firmly on two key releases: The Fed’s preferred inflation gauge, the PCE index, and the upcoming ISM surveys on business activity.
From here, though, the narrative will quiet down. Fed officials have now entered their pre-meeting ‘radio silence’, leaving markets without fresh policy signals until the next interest rate decision on December 10.
Technical landscape
Since pushing above the 100.00 mark earlier this month, the US Dollar Index (DXY) has been in a corrective phase.
For the outlook to turn convincingly bullish again, the index still needs to clear the key 200-day SMA at 99.70 in a convincing fashion. Thereafter, it will have to overcome its recent high at 100.39 (November 21), ahead of the weekly peak at 100.54 (May 29) and the next major level at 101.97 (May 12).
On the downside, there is immediate contention on the November floor at 98.99 (November 13), prior to the provisional 55- and 100-day SMAs at 98.84 and 98.54, respectively. The loss of this region could spark a deeper pullback to the weekly trough at 98.03 (October 17) before the 2025 bottom at 96.21 (September 17). Extra losses from here should retarget the February 2022 valley at 95.13 (February 4) and the 2022 base at 94.62 (January 14).
Momentum signals have cooled slightly: The Relative Strength Index (RSI) remains just below the 50 yardstick, while the Average Directional Index (ADX) around 14 suggests the current trend is modest in strength, but not gone.
-1764354127090-1764354127091.png&w=1536&q=95)
Bottom line
The US Dollar’s short-term outlook has taken a knock in recent days, with momentum clearly no longer on its side. Still, it’s not all downside risk. A few Fed officials are maintaining a hawkish stance, which should help stabilise the Greenback temporarily.
What’s complicating things most is the hangover from the record-breaking government shutdown. On paper, the US economy appears reasonably balanced, but the absence of fresh data has left investors uncertain. Once those delayed reports finally land, they could carry even greater weight than usual, potentially reshaping expectations for the Fed’s next steps.
For now, policymakers appear to be watching the labour market most closely. But inflation hasn’t left the stage; it’s still hotter than the Fed is comfortable with. If those price pressures remain stubborn, officials may have to swing back toward inflation control sooner than markets anticipate, and that would almost certainly mean a more cautious Fed, regardless of the political noise.
US Dollar FAQs
The US Dollar (USD) is the official currency of the United States of America, and the ‘de facto’ currency of a significant number of other countries where it is found in circulation alongside local notes. It is the most heavily traded currency in the world, accounting for over 88% of all global foreign exchange turnover, or an average of $6.6 trillion in transactions per day, according to data from 2022.
Following the second world war, the USD took over from the British Pound as the world’s reserve currency. For most of its history, the US Dollar was backed by Gold, until the Bretton Woods Agreement in 1971 when the Gold Standard went away.
The most important single factor impacting on the value of the US Dollar is monetary policy, which is shaped by the Federal Reserve (Fed). The Fed has two mandates: to achieve price stability (control inflation) and foster full employment. Its primary tool to achieve these two goals is by adjusting interest rates.
When prices are rising too quickly and inflation is above the Fed’s 2% target, the Fed will raise rates, which helps the USD value. When inflation falls below 2% or the Unemployment Rate is too high, the Fed may lower interest rates, which weighs on the Greenback.
In extreme situations, the Federal Reserve can also print more Dollars and enact quantitative easing (QE). QE is the process by which the Fed substantially increases the flow of credit in a stuck financial system.
It is a non-standard policy measure used when credit has dried up because banks will not lend to each other (out of the fear of counterparty default). It is a last resort when simply lowering interest rates is unlikely to achieve the necessary result. It was the Fed’s weapon of choice to combat the credit crunch that occurred during the Great Financial Crisis in 2008. It involves the Fed printing more Dollars and using them to buy US government bonds predominantly from financial institutions. QE usually leads to a weaker US Dollar.
Quantitative tightening (QT) is the reverse process whereby the Federal Reserve stops buying bonds from financial institutions and does not reinvest the principal from the bonds it holds maturing in new purchases. It is usually positive for the US Dollar.