EUR/USD is giving back part of its earlier gains, easing toward the 1.1520 area on Thursday. Despite the pullback, the pair remains on a firm footing, supported by the softer US Dollar, even as recent hawkish remarks from Fed officials have offered the Greenback some relief.
USD/CNH: Likely to trade in a range of 7.1220/7.1350 – UOB Group

US Dollar (USD) is likely to trade in a range of 7.1220/7.1350. In the longer run, there is scope for USD to test 7.1450.
Scope for USD to test 7.1450
24-HOUR VIEW: “We noted yesterday that ‘there has been a slight increase in upward momentum’, and we were of the view that USD ‘could edge higher to 7.1390’. USD subsequently rose to a high of 7.1380 before easing to close largely unchanged at 7.1306 (-0.07%). The current price movements are likely part of a range-trading phase. Today, we expect USD to trade in a range of 7.1220/7.1350.”
1-3 WEEKS VIEW: “We have held a mildly positive USD view since early this week. Yesterday (05 Nov, spot at 7.1340), we highlighted that ‘there is scope for USD to test 7.1450’. We added, ‘to sustain the mild upward momentum, USD must hold above 7.1170 (‘strong support’ level)’. We continue to hold the same view.”
Australian Dollar holds gains as US Dollar declines on fading Fed rate cut bets
Australian Dollar (AUD) advances against the US Dollar (USD) on Thursday, after registering more than 0.25% gains in the previous session. The AUD/USD pair remains steady following the release of Australia’s Trade Balance data.
Australia’s Trade Surplus widened to 3,938 million month-over-month (MoM) in September, exceeding the 3,850 million expected and 1,111 million (revised from 1,825 million) in the previous reading. Exports rose by 7.9% MoM in September, swinging from a previous decline of 8.7% (revised from -7.8%). Meanwhile, Imports rose by 1.1% MoM, compared to a previous rise of 3.3% (revised from 3.2%).
The AUD received support against the US Dollar (USD) after China’s Finance Ministry announced on Wednesday that it will lift some tariffs on US agricultural products starting November 10. The ministry also said that the 24% tariffs on certain US goods will be suspended for one year, while the 10% tariffs will remain in place.
However, the Chinese government has also ordered state-funded data centres to cancel plans to purchase foreign chips as tensions seem to continue on this front between the US and China. Any change in the Chinese economy could impact the AUD as China is a major trading partner for Australia.
US Dollar declines due to weakening Fed rate cut likelihood
- The US Dollar Index (DXY), which measures the value of the US Dollar against six major currencies, is extending its losses and trading around 100.00 at the time of writing. The Greenback declined despite stronger-than-expected US economic data released on Wednesday.
- ADP Employment Change in the US climbed by 42,000 in October, compared to the 29,000 decrease (revised from -32,000) seen in September. This figure came in better than the estimations of 25,000. US ISM Services PMI climbed to 52.4 in October, from 50.0 prior and exceeding analysts’ forecasts of 50.8.
- Fed funds futures traders are now pricing in a 62% chance of a cut in December, down from 68% a day ago, according to the CME FedWatch Tool.
- Fed Chair Jerome Powell signaled a more cautious approach, waiting for more data, which is complicated by the US government shutdown. Powell said that another rate cut in December is far from certain. However, Fed Governor Stephen Miran suggested that another rate cut could be appropriate in December.
- The US government impasse has now entered its sixth week and is poised to become the longest federal funding lapse in US history after the Senate once again failed to pass a short-term funding bill. The most recent attempt to resolve the standoff, Republican-backed temporary legislation, was rejected by the Senate for the 14th time on Tuesday.
- The White House announced on Tuesday that China will suspend extra export controls on rare earths and end probes into US semiconductor firms, in exchange for the US pausing some tariffs and canceling a planned 100% levy on Chinese exports.
- US President Donald Trump announced a cut to fentanyl-related tariffs on imports from China, lowering the rate from 20% to 10%, and the continued freeze of some of his reciprocal levies on Chinese goods. The moves will go into effect on November 10, per Bloomberg.
- China’s RatingDog Services Purchasing Managers’ Index (PMI) fell to 52.6 in October from 52.9 in September. The data matched the market forecast of 52.6 in the reported period. Manufacturing PMI declined to 50.6 in October from 51.2 in September. The market forecast was for a 50.9 print. It is important to note that any shift in China’s economic conditions could also affect the Australian dollar (AUD), given the close trade ties between China and Australia.
- The S&P Global Australia Services PMI climbed to 52.5 in October from 52.4 in September, signaling continued growth in services activity and extending the expansion streak to 21 months. Meanwhile, Composite PMI came in at 52.1, down from 52.4 prior.
- The Reserve Bank of Australia (RBA) decided to maintain the Official Cash Rate (OCR) at 3.6% in the November policy meeting on Tuesday. RBA Governor Michele Bullock said in her post-meeting press conference that policymakers had not discussed rate cuts and emphasized that annual core inflation remaining above 3% is undesirable. Bullock noted that the effects of previous rate cuts are still filtering through the economy. She added that policymakers discussed maintaining a cautious approach regarding the policy outlook.
- Melbourne Institute reported on Monday that the TD-MI Inflation Gauge rose 0.3% month-on-month (MoM) in October, easing slightly from a 0.4% gain in September but marking the second consecutive monthly increase. Meanwhile, the annual Inflation Gauge rose 3.1%, edging higher from the previous 3.0%.
Australian Dollar hovers around 0.6500 amid a consolidation phase
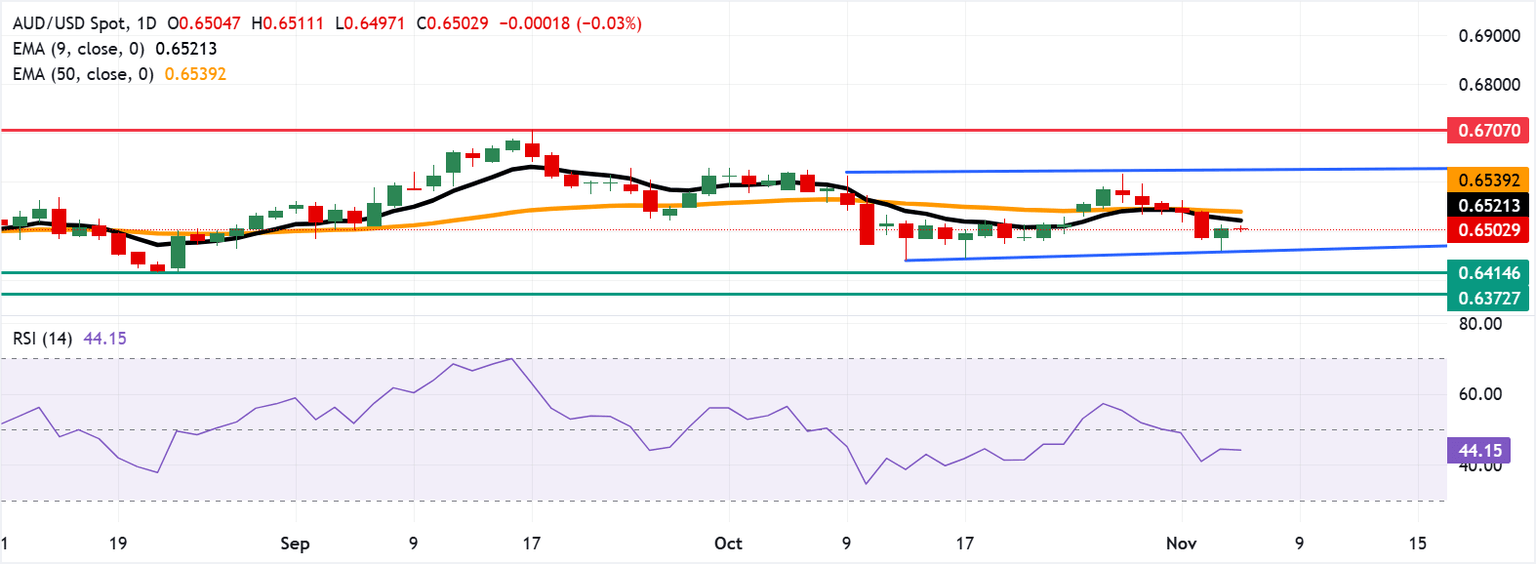
The AUD/USD pair is trading around 0.6500 on Thursday. Technical analysis of the daily chart shows the pair consolidating within a rectangle pattern, trading sideways. It remains below the nine-day Exponential Moving Average (EMA), indicating a weaker short-term momentum.
A successful break below the psychological level of 0.6500 would prompt the AUD/USD pair to test the lower boundary of the rectangle around 0.6460, followed by the five-month low of 0.6414, which was recorded on August 21. Further support lies at the six-month low at 0.6372.
On the upside, the initial barrier lies at the nine-day Exponential Moving Average (EMA) of 0.6520, followed by the 50-day EMA at 0.6539. A break above these levels would improve the short- and medium-term price momentum and support the AUD/USD pair to explore the region around the rectangle’s upper boundary around 0.6630. Further advances would signal a bullish bias and support the pair to approach the 13-month high of 0.6707, recorded on September 17.
Australian Dollar Price Today
The table below shows the percentage change of Australian Dollar (AUD) against listed major currencies today. Australian Dollar was the strongest against the New Zealand Dollar.
| USD | EUR | GBP | JPY | CAD | AUD | NZD | CHF | |
|---|---|---|---|---|---|---|---|---|
| USD | -0.19% | -0.10% | -0.12% | -0.06% | -0.09% | 0.02% | -0.12% | |
| EUR | 0.19% | 0.09% | 0.07% | 0.12% | 0.10% | 0.21% | 0.07% | |
| GBP | 0.10% | -0.09% | -0.04% | 0.04% | 0.03% | 0.12% | -0.02% | |
| JPY | 0.12% | -0.07% | 0.04% | 0.06% | 0.05% | 0.13% | 0.02% | |
| CAD | 0.06% | -0.12% | -0.04% | -0.06% | -0.02% | 0.06% | -0.05% | |
| AUD | 0.09% | -0.10% | -0.03% | -0.05% | 0.02% | 0.11% | -0.02% | |
| NZD | -0.02% | -0.21% | -0.12% | -0.13% | -0.06% | -0.11% | -0.14% | |
| CHF | 0.12% | -0.07% | 0.02% | -0.02% | 0.05% | 0.02% | 0.14% |
The heat map shows percentage changes of major currencies against each other. The base currency is picked from the left column, while the quote currency is picked from the top row. For example, if you pick the Australian Dollar from the left column and move along the horizontal line to the US Dollar, the percentage change displayed in the box will represent AUD (base)/USD (quote).
Australian Dollar FAQs
One of the most significant factors for the Australian Dollar (AUD) is the level of interest rates set by the Reserve Bank of Australia (RBA). Because Australia is a resource-rich country another key driver is the price of its biggest export, Iron Ore. The health of the Chinese economy, its largest trading partner, is a factor, as well as inflation in Australia, its growth rate and Trade Balance. Market sentiment – whether investors are taking on more risky assets (risk-on) or seeking safe-havens (risk-off) – is also a factor, with risk-on positive for AUD.
The Reserve Bank of Australia (RBA) influences the Australian Dollar (AUD) by setting the level of interest rates that Australian banks can lend to each other. This influences the level of interest rates in the economy as a whole. The main goal of the RBA is to maintain a stable inflation rate of 2-3% by adjusting interest rates up or down. Relatively high interest rates compared to other major central banks support the AUD, and the opposite for relatively low. The RBA can also use quantitative easing and tightening to influence credit conditions, with the former AUD-negative and the latter AUD-positive.
China is Australia’s largest trading partner so the health of the Chinese economy is a major influence on the value of the Australian Dollar (AUD). When the Chinese economy is doing well it purchases more raw materials, goods and services from Australia, lifting demand for the AUD, and pushing up its value. The opposite is the case when the Chinese economy is not growing as fast as expected. Positive or negative surprises in Chinese growth data, therefore, often have a direct impact on the Australian Dollar and its pairs.
Iron Ore is Australia’s largest export, accounting for $118 billion a year according to data from 2021, with China as its primary destination. The price of Iron Ore, therefore, can be a driver of the Australian Dollar. Generally, if the price of Iron Ore rises, AUD also goes up, as aggregate demand for the currency increases. The opposite is the case if the price of Iron Ore falls. Higher Iron Ore prices also tend to result in a greater likelihood of a positive Trade Balance for Australia, which is also positive of the AUD.
The Trade Balance, which is the difference between what a country earns from its exports versus what it pays for its imports, is another factor that can influence the value of the Australian Dollar. If Australia produces highly sought after exports, then its currency will gain in value purely from the surplus demand created from foreign buyers seeking to purchase its exports versus what it spends to purchase imports. Therefore, a positive net Trade Balance strengthens the AUD, with the opposite effect if the Trade Balance is negative.
Australian Dollar remains steady following Trade Balance data
Australian Dollar (AUD) moves little against the US Dollar (USD) on Thursday, after registering more than 0.25% gains in the previous session. The AUD/USD pair remains steady following the release of Australia’s Trade Balance data.
Australia’s Trade Surplus widened to 3,938 million month-over-month (MoM) in September, exceeding the 3,850 million expected and 1,111 million (revised from 1,825 million) in the previous reading. Exports rose by 7.9% MoM in September, swinging from a previous decline of 8.7% (revised from -7.8%). Meanwhile, Imports rose by 1.1% MoM, compared to a previous rise of 3.3% (revised from 3.2%).
The AUD received support against the US Dollar (USD) after China’s Finance Ministry announced on Wednesday that it will lift some tariffs on US agricultural products starting November 10. The ministry also said that the 24% tariffs on certain US goods will be suspended for one year, while the 10% tariffs will remain in place.
However, the Chinese government has also ordered state-funded data centres to cancel plans to purchase foreign chips as tensions seem to continue on this front between the US and China. Any change in the Chinese economy could impact the AUD as China is a major trading partner for Australia.
US Dollar declines despite stronger economic data
- The US Dollar Index (DXY), which measures the value of the US Dollar against six major currencies, is extending its losses and trading around 100.00 at the time of writing. The Greenback declines despite a stronger-than-expected US economic data released on Wednesday.
- ADP Employment Change in the US climbed by 42,000 in October, compared to the 29,000 decrease (revised from -32,000) seen in September. This figure came in better than the estimations of 25,000.
- US ISM Services PMI climbed to 52.4 in October, from 50.0 prior and exceeding analysts’ forecasts of 50.8.
- The US government impasse has now entered its sixth week and is poised to become the longest federal funding lapse in US history after the Senate once again failed to pass a short-term funding bill. The most recent attempt to resolve the standoff, Republican-backed temporary legislation, was rejected by the Senate for the 14th time on Tuesday.
- The US Dollar may receive support from the cautious sentiment surrounding the US Federal Reserve (Fed) policy stance for December. Fed funds futures traders are now pricing in a 69% chance of a cut in December, down from 90% a week ago, according to the CME FedWatch Tool.
- Fed Chair Jerome Powell said last week during the post-meeting press conference that another rate cut in December is far from certain. Powell also cautioned that policymakers may need to take a wait-and-see approach until official data reporting resumes.
- The White House announced on Tuesday that China will suspend extra export controls on rare earths and end probes into US semiconductor firms, in exchange for the US pausing some tariffs and canceling a planned 100% levy on Chinese exports.
- US President Donald Trump announced a cut to fentanyl-related tariffs on imports from China, lowering the rate from 20% to 10%, and the continued freeze of some of his reciprocal levies on Chinese goods. The moves will go into effect on November 10, per Bloomberg.
- China’s RatingDog Services Purchasing Managers’ Index (PMI) fell to 52.6 in October from 52.9 in September. The data matched the market forecast of 52.6 in the reported period. Manufacturing PMI declined to 50.6 in October from 51.2 in September. The market forecast was for a 50.9 print. It is important to note that any shift in China’s economic conditions could also affect the Australian dollar (AUD), given the close trade ties between China and Australia.
- The S&P Global Australia Services PMI climbed to 52.5 in October from 52.4 in September, signaling continued growth in services activity and extending the expansion streak to 21 months. Meanwhile, Composite PMI came in at 52.1, down from 52.4 prior.
- The Reserve Bank of Australia (RBA) decided to maintain the Official Cash Rate (OCR) at 3.6% in the November policy meeting on Tuesday. RBA Governor Michele Bullock said in her post-meeting press conference that policymakers had not discussed rate cuts and emphasized that annual core inflation remaining above 3% is undesirable. Bullock noted that the effects of previous rate cuts are still filtering through the economy. She added that policymakers discussed maintaining a cautious approach regarding the policy outlook.
- Melbourne Institute reported on Monday that the TD-MI Inflation Gauge rose 0.3% month-on-month (MoM) in October, easing slightly from a 0.4% gain in September but marking the second consecutive monthly increase. Meanwhile, the annual Inflation Gauge rose 3.1%, edging higher from the previous 3.0%.
Australian Dollar hovers around 0.6500 amid a consolidation phase
The AUD/USD pair is trading around 0.6500 on Thursday. Technical analysis of the daily chart shows the pair consolidating within a rectangle pattern, trading sideways. It remains below the nine-day Exponential Moving Average (EMA), indicating a weaker short-term momentum.
A successful break below the psychological level of 0.6500 would prompt the AUD/USD pair to test the lower boundary of the rectangle around 0.6460, followed by the five-month low of 0.6414, which was recorded on August 21. Further support lies at the six-month low at 0.6372.
On the upside, the initial barrier lies at the nine-day Exponential Moving Average (EMA) of 0.6520, followed by the 50-day EMA at 0.6539. A break above these levels would improve the short- and medium-term price momentum and support the AUD/USD pair to explore the region around the rectangle’s upper boundary around 0.6630. Further advances would signal a bullish bias and support the pair to approach the 13-month high of 0.6707, recorded on September 17.
Australian Dollar Price Today
The table below shows the percentage change of Australian Dollar (AUD) against listed major currencies today. Australian Dollar was the strongest against the New Zealand Dollar.
| USD | EUR | GBP | JPY | CAD | AUD | NZD | CHF | |
|---|---|---|---|---|---|---|---|---|
| USD | -0.17% | -0.09% | -0.11% | -0.03% | 0.01% | 0.03% | -0.16% | |
| EUR | 0.17% | 0.08% | 0.04% | 0.14% | 0.18% | 0.19% | 0.00% | |
| GBP | 0.09% | -0.08% | -0.04% | 0.06% | 0.10% | 0.12% | -0.07% | |
| JPY | 0.11% | -0.04% | 0.04% | 0.09% | 0.14% | 0.13% | -0.03% | |
| CAD | 0.03% | -0.14% | -0.06% | -0.09% | 0.05% | 0.04% | -0.13% | |
| AUD | -0.01% | -0.18% | -0.10% | -0.14% | -0.05% | 0.02% | -0.17% | |
| NZD | -0.03% | -0.19% | -0.12% | -0.13% | -0.04% | -0.02% | -0.19% | |
| CHF | 0.16% | -0.01% | 0.07% | 0.03% | 0.13% | 0.17% | 0.19% |
The heat map shows percentage changes of major currencies against each other. The base currency is picked from the left column, while the quote currency is picked from the top row. For example, if you pick the Australian Dollar from the left column and move along the horizontal line to the US Dollar, the percentage change displayed in the box will represent AUD (base)/USD (quote).
Australian Dollar FAQs
One of the most significant factors for the Australian Dollar (AUD) is the level of interest rates set by the Reserve Bank of Australia (RBA). Because Australia is a resource-rich country another key driver is the price of its biggest export, Iron Ore. The health of the Chinese economy, its largest trading partner, is a factor, as well as inflation in Australia, its growth rate and Trade Balance. Market sentiment – whether investors are taking on more risky assets (risk-on) or seeking safe-havens (risk-off) – is also a factor, with risk-on positive for AUD.
The Reserve Bank of Australia (RBA) influences the Australian Dollar (AUD) by setting the level of interest rates that Australian banks can lend to each other. This influences the level of interest rates in the economy as a whole. The main goal of the RBA is to maintain a stable inflation rate of 2-3% by adjusting interest rates up or down. Relatively high interest rates compared to other major central banks support the AUD, and the opposite for relatively low. The RBA can also use quantitative easing and tightening to influence credit conditions, with the former AUD-negative and the latter AUD-positive.
China is Australia’s largest trading partner so the health of the Chinese economy is a major influence on the value of the Australian Dollar (AUD). When the Chinese economy is doing well it purchases more raw materials, goods and services from Australia, lifting demand for the AUD, and pushing up its value. The opposite is the case when the Chinese economy is not growing as fast as expected. Positive or negative surprises in Chinese growth data, therefore, often have a direct impact on the Australian Dollar and its pairs.
Iron Ore is Australia’s largest export, accounting for $118 billion a year according to data from 2021, with China as its primary destination. The price of Iron Ore, therefore, can be a driver of the Australian Dollar. Generally, if the price of Iron Ore rises, AUD also goes up, as aggregate demand for the currency increases. The opposite is the case if the price of Iron Ore falls. Higher Iron Ore prices also tend to result in a greater likelihood of a positive Trade Balance for Australia, which is also positive of the AUD.
The Trade Balance, which is the difference between what a country earns from its exports versus what it pays for its imports, is another factor that can influence the value of the Australian Dollar. If Australia produces highly sought after exports, then its currency will gain in value purely from the surplus demand created from foreign buyers seeking to purchase its exports versus what it spends to purchase imports. Therefore, a positive net Trade Balance strengthens the AUD, with the opposite effect if the Trade Balance is negative.
Ethereum could steady its recovery as SOPR metric resets
Ethereum (ETH) is trading upward, building on the short-term support at $3,350 at the time of writing on Wednesday, following two days of steady declines in the broader cryptocurrency market.
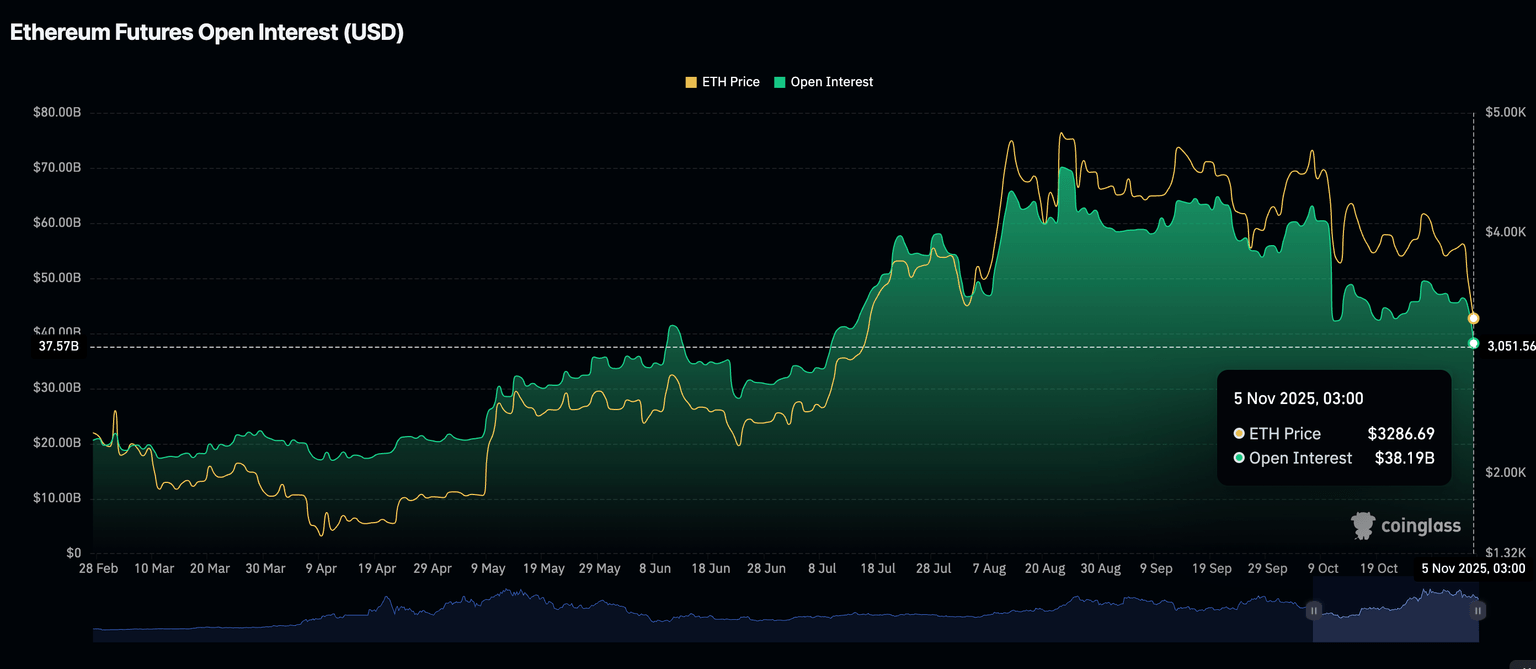
Despite the knee-jerk recovery from ETH’s weekly low of $3,057, retail demand remains significantly suppressed. CoinGlass data shows the futures Open Interest (OI) averaging $38 billion, down 19% from approximately $47 billion on Saturday and 47% from its historical peak of $70 billion reached in August.
The steady decline mirrors the risk-off sentiment surrounding Ethereum, prompting traders to retreat into the sidelines until stability returns.
Ethereum bulls eye recovery amid bearish exhaustion
Ethereum has consistently faced a cascade of losses since its record high of $4,956 in late August. Profit-taking, macroeconomic uncertainty and a lack of price catalysts are among the factors that continue to suppress recovery, leaving ETH vulnerable to headwinds.
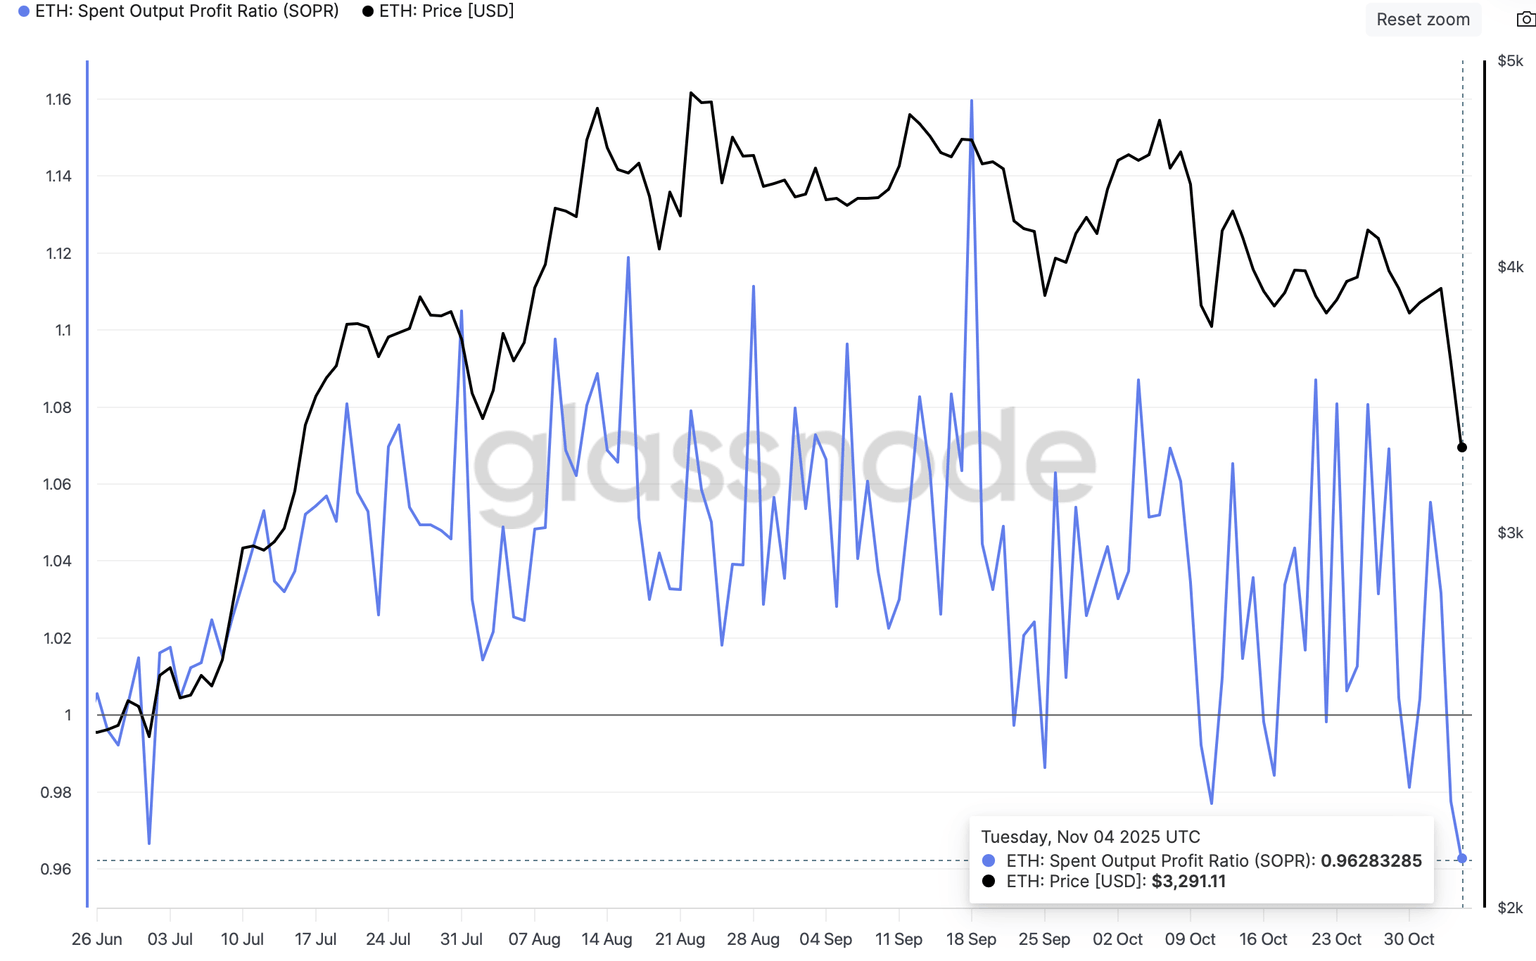
According to Glassnode’s data, the Spent Output Profit Ratio (SOPR) metric – which measures the ratio of the realized value in US Dollar (USD) at the time of spending to the cost basis in USD at the time of purchase for all ETH outputs – has declined to 0.97 as of Tuesday from 1.08 in early October, coinciding with the prolonged price correction. This suggests investors are selling amid panic and extreme fear, realizing losses.
However, a SOPR resetting below 1.00 implies potential exhaustion of weak hands, which could present fresh buying opportunities as selling pressure eases. Ideally, investors buy when the SOPR is below 1.00 and sell when it rises above that threshold, due to the risk of overheating.
Glassnode also highlights a significant drop in Ethereum’s supply in profit from approximately 78 million ETH to 53 million ETH recorded on October 6. This represents a 32% decrease in supply in profit, subsequently reducing potential selling pressure and predisposing ETH to a recovery in the short to medium term.

Technical outlook: Ethereum bulls seek to regain control
Ethereum is trading above $3,300 at the time of writing on Wednesday, bolstered by macro news after China suspended reciprocal tariffs on some United States (US) agricultural goods.
The Relative Strength Index (RSI), which is currently at 32, up from slightly oversold levels, indicates that bearish momentum is decreasing. Higher RSI readings would tighten the bullish grip, increasing the odds of Ethereum reclaiming the 200-day Exponential Moving Average (EMA) at $3,601.
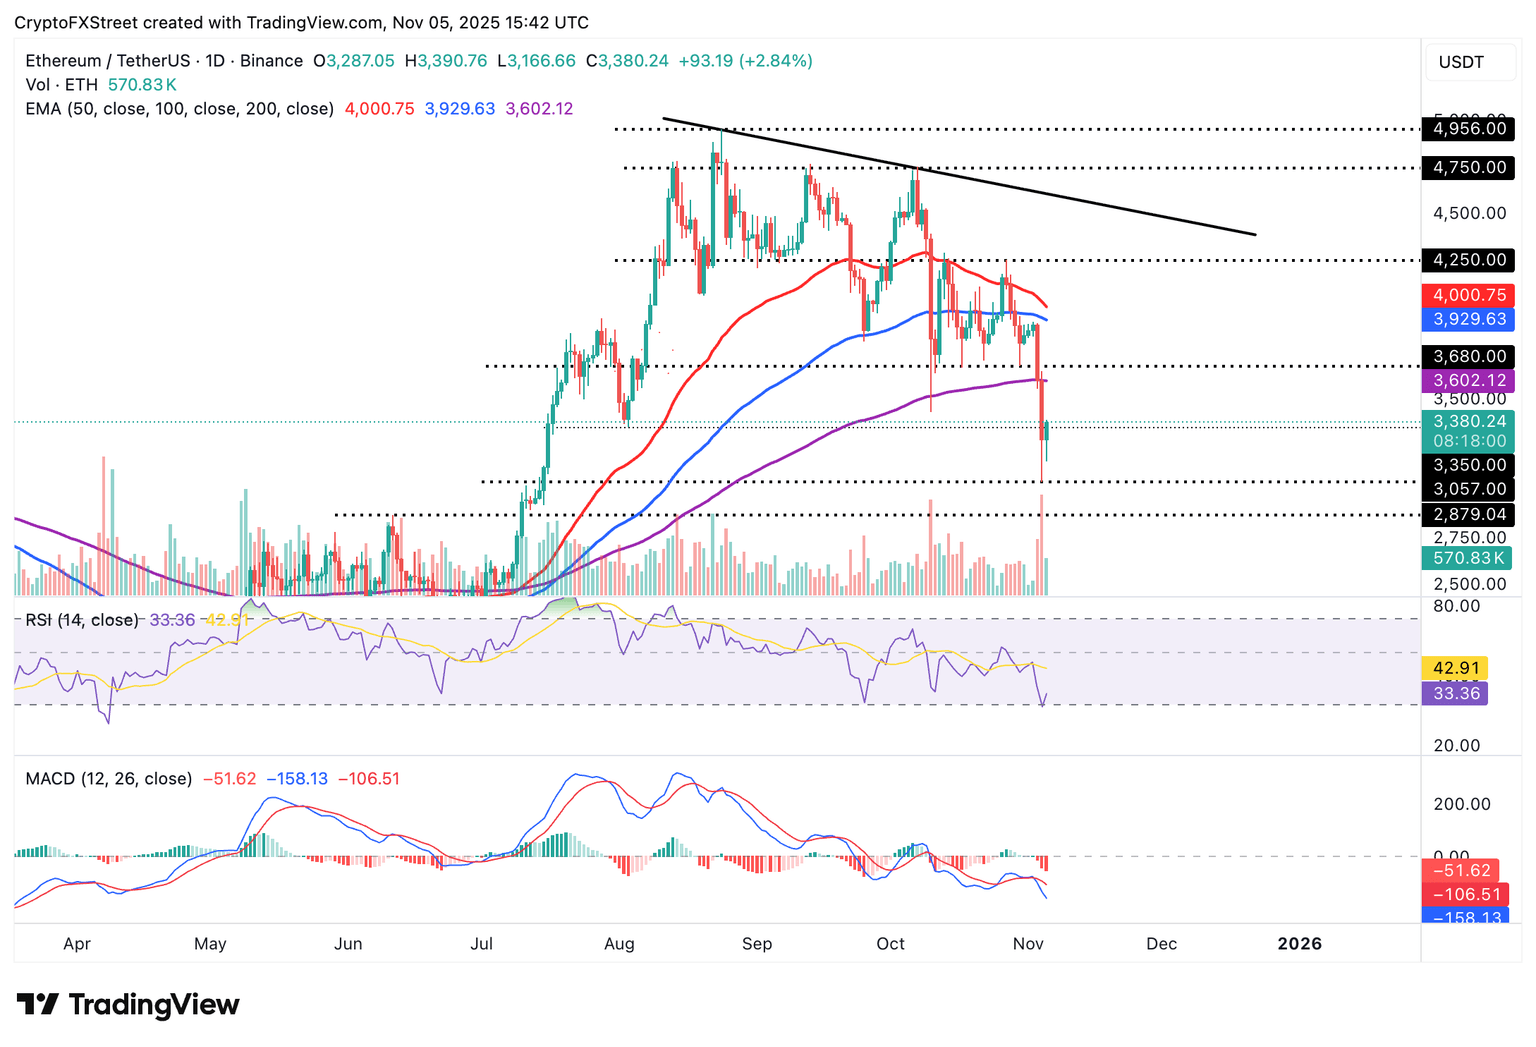
Still, traders should be cautiously optimistic as the Moving Average Convergence Divergence (MACD) indicator has upheld a sell signal since Monday. Investors may keep leaning bearishly and deleveraging as long as the blue MACD line holds above the red signal line. Key areas of interest for traders if selling pressure increases are $3,057, tested as support on Tuesday and $2,880, tested as resistance in June.
Ethereum FAQs
Ethereum is a decentralized open-source blockchain with smart contracts functionality. Its native currency Ether (ETH), is the second-largest cryptocurrency and number one altcoin by market capitalization. The Ethereum network is tailored for building crypto solutions like decentralized finance (DeFi), GameFi, non-fungible tokens (NFTs), decentralized autonomous organizations (DAOs), etc.
Ethereum is a public decentralized blockchain technology, where developers can build and deploy applications that function without the need for a central authority. To make this easier, the network leverages the Solidity programming language and Ethereum virtual machine which helps developers create and launch applications with smart contract functionality.
Smart contracts are publicly verifiable codes that automates agreements between two or more parties. Basically, these codes self-execute encoded actions when predetermined conditions are met.
Staking is a process of earning yield on your idle crypto assets by locking them in a crypto protocol for a specified duration as a means of contributing to its security. Ethereum transitioned from a Proof-of-Work (PoW) to a Proof-of-Stake (PoS) consensus mechanism on September 15, 2022, in an event christened “The Merge.” The Merge was a key part of Ethereum’s roadmap to achieve high-level scalability, decentralization and security while remaining sustainable. Unlike PoW, which requires the use of expensive hardware, PoS reduces the barrier of entry for validators by leveraging the use of crypto tokens as the core foundation of its consensus process.
Gas is the unit for measuring transaction fees that users pay for conducting transactions on Ethereum. During periods of network congestion, gas can be extremely high, causing validators to prioritize transactions based on their fees.
Gold Price Forecast: XAU/USD extends its consolidative phase below $4,000
XAU/USD Current price: $3,98
- Encouraging United States private sector data underpinned the US Dollar.
- US Democrats notched victories in multiple states as the shutdown continues.
- XAU/USD consolidates within familiar levels with the risk skew to the downside.
Gold traded within a well-defined range throughout the first half of Wednesday, now hovering around $3,980 per troy ounce in the American session. The lack of a clear catalyst kept investors in cautious mode, although the US Dollar (USD) retained its positive tone across the FX board.
Finally, the United States (US) released the ADP Employment Change survey, which showed that the private sector added 42,000 new job positions in October, better than the upwardly revised -29,000 posted in September.
Additionally, the ISM Services Purchasing Managers’ Index (PMI) improved to 52.4 in October, much better than the previous 50 or the expected 50.8. Upon closer examination, the Prices Paid Index, which tracks inflation, increased to 70.0 from 69.4, while the Employment Index rose to 48.2 from 47.2. Finally, the New Orders Index rose to 56.2, from 50.4.
Aside from that, speculative interest kept a close eye on the US elections. Democrats notched victories in multiple states, not good news for President Donald Trump, who blamed GOP losses on the ongoing shutdown. Indeed, California, Virginia, and most likely New Jersey have new Democratic governors, while New York City voted for progressive Zohran Mamdani and his affordability platform.
Meanwhile, Wall Street reversed Tuesday’s losses, and the three major indexes trade in the green after the positive surprise provided by data, although gains are modest. Overall, market players seem cautiously optimistic and willing to continue betting on the Greenback.
XAU/USD short-term technical outlook
In the 4-hour chart, the XAU/USD pair is currently trading at around $3,980, up $19 for the day. From a technical point of view, a bearish 20 Simple Moving Average (SMA) at $3,986 contained advances, while converging with a marginally bullish 200 SMA, the latter at $3,996. Further up, the 100 SMA acts as resistance at $4,095.Technical indicators, in the meantime, reflect the lack of directional strength. The Momentum indicator recovered but remains below its midline, while the Relative Strength Index (RSI) indicator holds flat at 48.
In the daily chart, the XAU/USD is developing below the 20-day Simple Moving Average, which currently stands at $4,084. However, the pair is above the longer ones with the 100-day SMA at $3,602 and the 200-day SMA at $3,365 acting as mid-term dynamic supports. At the same time, the Momentum indicator plunged below its midline, and maintaining its downward strength, while the RSI indicator remains directionless at around its 50 level, skewing the risk to the downside without confirming an imminent slide.
(This content was partially created with the help of an AI tool)
USD/JPY consolidates around 153.60 amid divergence – BBH

USD/JPY remains around 153.60 as Japan’s on-hold policy stance keeps the pair elevated despite yield-based valuation concerns, BBH FX analysts report.
Japan official flags overstretched Yen vs. US yields
“USD/JPY is directionless around 153.60. Japan Vice Finance Minister for International Affairs, Atsushi Mimura, highlighted that USD/JPY is trading above the level implied by US-Japan bond yield differentials. We agree.”
“However, the Bank of Japan’s on-hold policy stance means this divergence is unlikely to close anytime soon. The swaps market continues to see 50% odds of a December 25bps rate hike to 0.75%, with a full 25bps move priced for January/March.”
NZD/USD steadies near 0.5650 as China lifts tariffs, NZ jobs data weak

NZD/USD remains flat after experiencing volatility, trading around 0.5650 during the early European hours on Wednesday. The pair recovers its daily losses after China’s Finance Ministry announced that it will lift some tariffs on US agricultural products starting November 10. The ministry also said that the 24% tariffs on certain US goods will be suspended for one year, while the 10% tariffs will remain in place.
China’s RatingDog Services Purchasing Managers’ Index (PMI) fell to 52.6 in October from 52.9 in September. The data matched the market forecast of 52.6 in the reported period. Any change in the Chinese economy could impact the NZD as China is a major trading partner for New Zealand.
The NZD/USD pair weakened as the New Zealand Dollar (NZD) struggled after weaker domestic jobs data was released on Wednesday, which reinforced expectations of a rate cut by the Reserve Bank of New Zealand (RBNZ) in November.
New Zealand’s Unemployment Rate climbed to a nearly nine-year high of 5.3% in the third quarter, up from 5.2% in the previous quarter, as Employment Change stalled. Markets are fully pricing in a 25-basis-point rate cut at the RBNZ’s upcoming policy meeting and placed even odds on another reduction next year.
The US Dollar (USD) remains subdued amid the ongoing US government shutdown. Traders adopt caution as the deadlock has now entered its sixth week and is poised to become the longest federal funding lapse in US history after the Senate once again failed to pass a short-term funding bill. The most recent attempt to resolve the standoff, Republican-backed temporary legislation, was rejected by the Senate for the 14th time on Tuesday.
New Zealand Dollar FAQs
The New Zealand Dollar (NZD), also known as the Kiwi, is a well-known traded currency among investors. Its value is broadly determined by the health of the New Zealand economy and the country’s central bank policy. Still, there are some unique particularities that also can make NZD move. The performance of the Chinese economy tends to move the Kiwi because China is New Zealand’s biggest trading partner. Bad news for the Chinese economy likely means less New Zealand exports to the country, hitting the economy and thus its currency. Another factor moving NZD is dairy prices as the dairy industry is New Zealand’s main export. High dairy prices boost export income, contributing positively to the economy and thus to the NZD.
The Reserve Bank of New Zealand (RBNZ) aims to achieve and maintain an inflation rate between 1% and 3% over the medium term, with a focus to keep it near the 2% mid-point. To this end, the bank sets an appropriate level of interest rates. When inflation is too high, the RBNZ will increase interest rates to cool the economy, but the move will also make bond yields higher, increasing investors’ appeal to invest in the country and thus boosting NZD. On the contrary, lower interest rates tend to weaken NZD. The so-called rate differential, or how rates in New Zealand are or are expected to be compared to the ones set by the US Federal Reserve, can also play a key role in moving the NZD/USD pair.
Macroeconomic data releases in New Zealand are key to assess the state of the economy and can impact the New Zealand Dollar’s (NZD) valuation. A strong economy, based on high economic growth, low unemployment and high confidence is good for NZD. High economic growth attracts foreign investment and may encourage the Reserve Bank of New Zealand to increase interest rates, if this economic strength comes together with elevated inflation. Conversely, if economic data is weak, NZD is likely to depreciate.
The New Zealand Dollar (NZD) tends to strengthen during risk-on periods, or when investors perceive that broader market risks are low and are optimistic about growth. This tends to lead to a more favorable outlook for commodities and so-called ‘commodity currencies’ such as the Kiwi. Conversely, NZD tends to weaken at times of market turbulence or economic uncertainty as investors tend to sell higher-risk assets and flee to the more-stable safe havens.
ZKsync, Internet Computer hold gains as Bitcoin slips below $100,000
ZKsync (ZK) and Internet Computer (ICP) hold steady amid the broader cryptocurrency market correction as Bitcoin (BTC) drops below $100,000 for the first time since June 23. The sudden decline wipes out $2 billion in total liquidations, with bulls taking the harder hit.
Bitcoin below $100,000 triggers $2 billion liquidation event
Bitcoin trades below $100,000 at press time on Wednesday, recording its third straight day of losses. A bearish crossover between the 50-day Exponential Moving Average (EMA) and the 100-day EMA confirms a short-term bearish dominance.
The immediate support for BTC lies at the $98,200 level, marked by the low on June 22. If BTC slips below this level, the bearish trend could test the $92,800 low from April 28.
Technically, the ongoing pullback has turned the momentum bearish as the Moving Average Convergence Divergence (MACD) extends the reversal from the signal line in the negative direction. At the same time, a successive rise in red histogram bars below the zero line indicates a rise in bearish momentum.
An increase in selling pressure has caused the Relative Strength Index (RSI) to drop to 29, sliding below the oversold zone. If RSI further extends into the oversold zone, BTC could lose further ground.
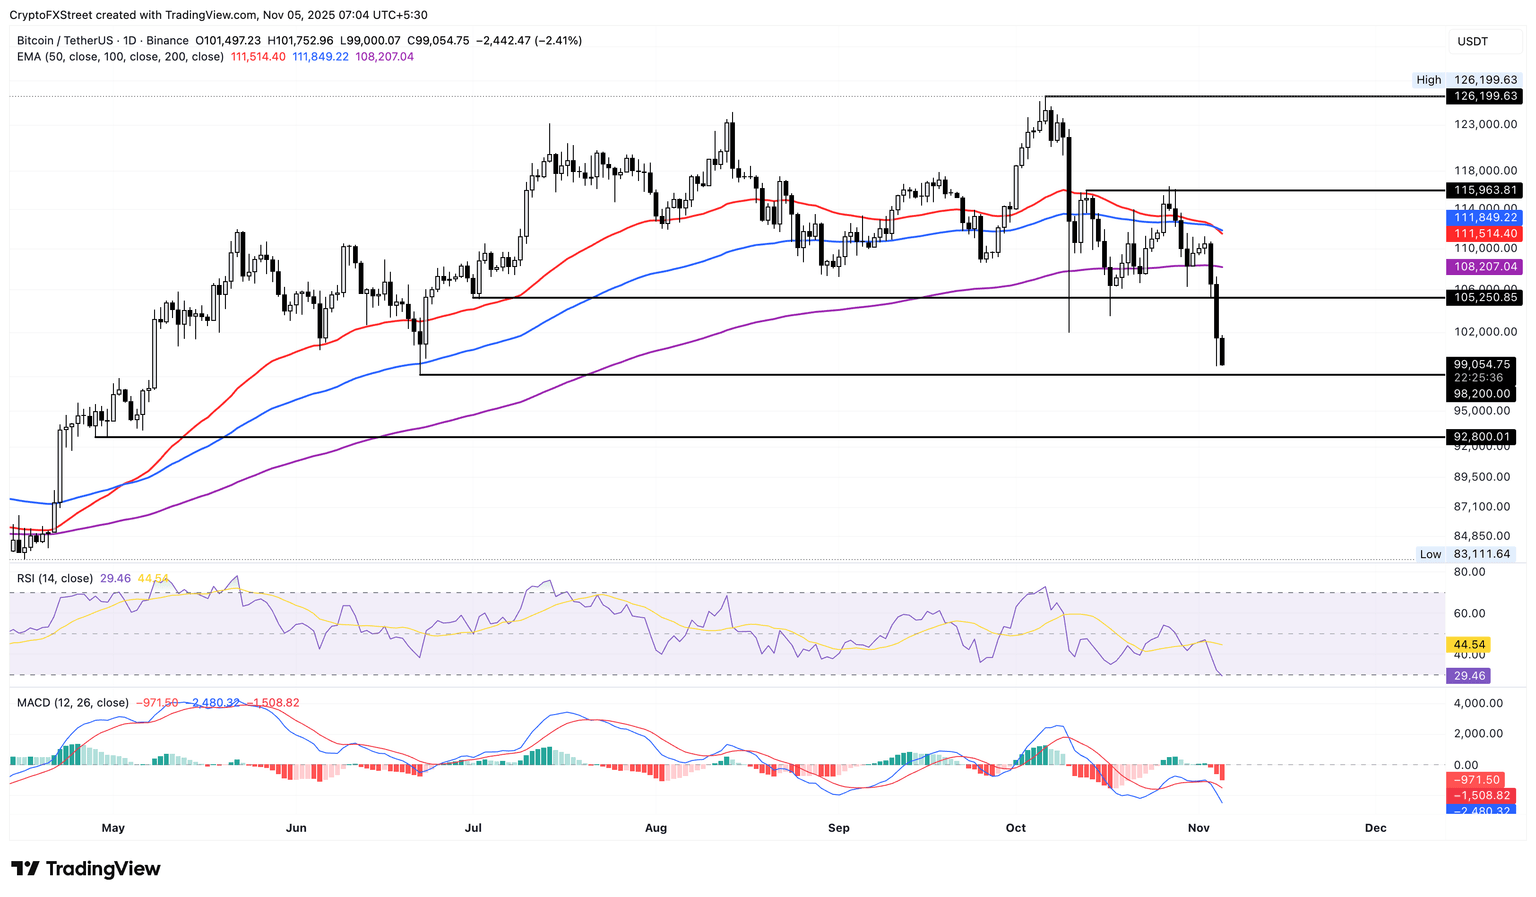
A potential rebound in BTC could test the $105,250 support-turned-resistance, marked by the July 1 low.
CoinGlass data indicates that over the last 24 hours, $2.07 billion has been wiped out of the cryptocurrency market, affecting 479,792 traders. Out of the total liquidation, $1.67 billion in long liquidation is substantially higher than $389.97 million in short liquidation. This indicates that largely bullish positions were forcefully liquidated, reflecting a bearish market sentiment.
Additionally, the largest single liquidation event in the ongoing market correction happened in the BTC/USDT pair on the HTX exchange, valued at $47.87 million.
ZKsync rally takes a breather
ZKsync, an Ethereum-based Layer 2 governance token, is shifting its focus to provide real-world utility. In an article on X from Tuesday, its founder, Alex Gluchowski, proposes that the governance-focused network could evolve into an incorruptible economy. The proposal shares the need for a token model that enables adaptation and growth in response to the ongoing private “Prividium” modular chains and the “Elastic Chain” for cross-chain interoperability.
At the time of writing, ZK trades above $0.0600 on Tuesday, holding above the 200-day EMA and the 80% gains from last week. If the governance token falls below the 200-day EMA, it could test the 100-day EMA near the $0.05000 psychological level.
The RSI at 66 hovers near the overbought boundary, indicating elevated levels of buying pressure. If RSI retraces towards the halfway line, suggesting a loss in bullish interest, ZK would be at risk of further correction. Corroborating the rise in bullish momentum, the MACD and signal line continue to uphold a rising trend.
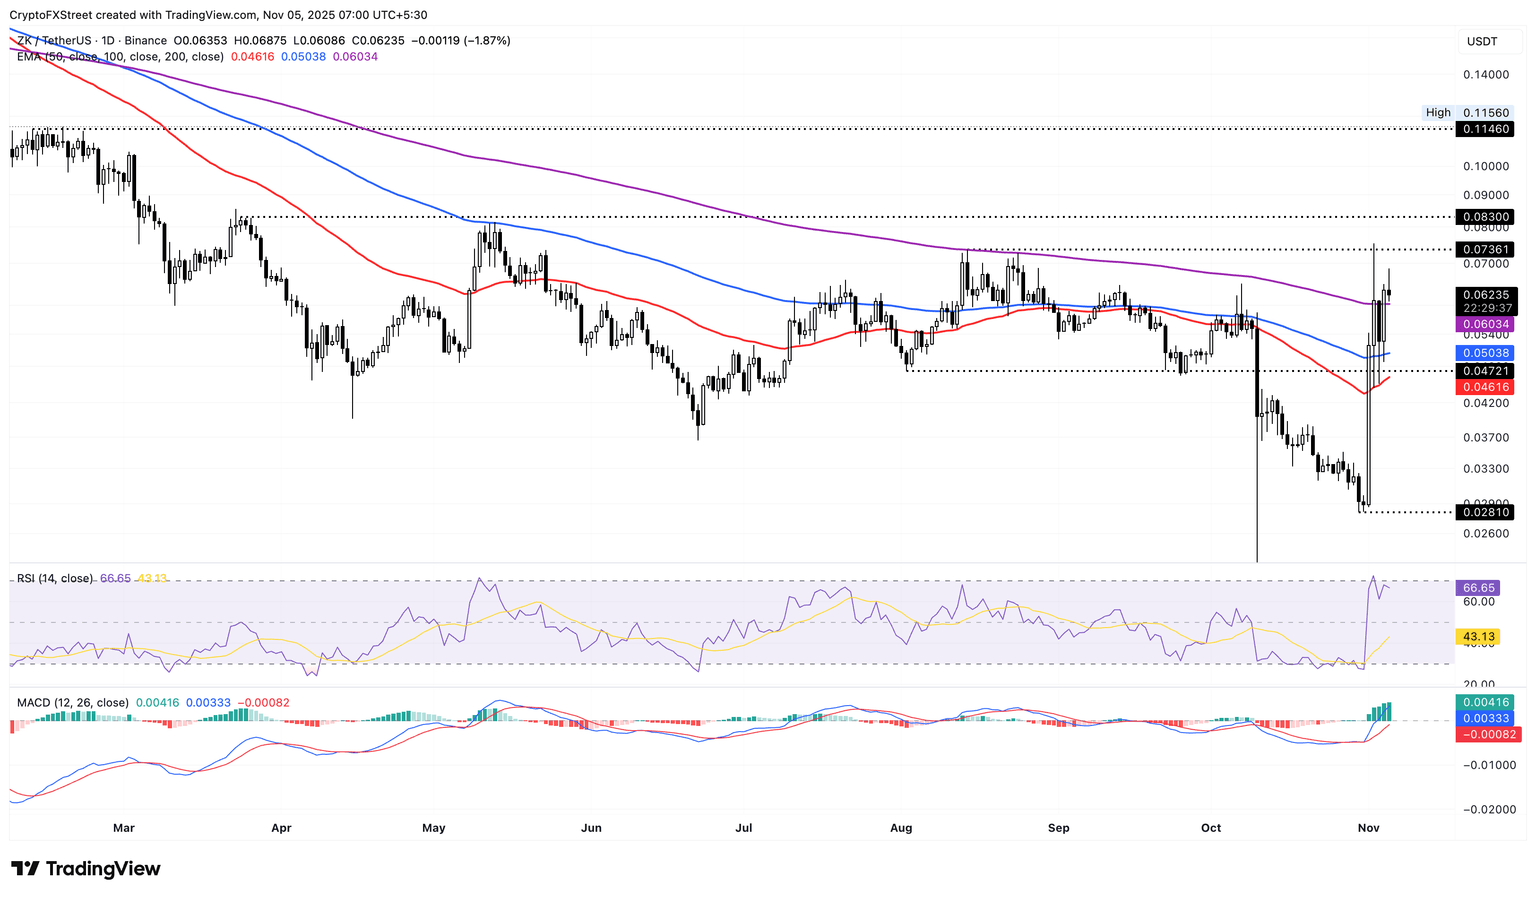
Looking up, if ZK breaks above $0.07631 high from August 14, it could extend the rally to the $0.08300 high from March 24.
Internet Computer floats above $5 as buying pressure holds
Internet Computer edges lower by nearly 4% at press time on Wednesday, testing the $5 mark and the 200-day EMA. If ICP marks a decisive close below this average line, it could extend the decline to the 100-day EMA at $4.311.
Still, similar to ZKSync, the momentum indicators on the daily chart suggest intense buying pressure. The RSI at 67 fluctuates below the overbought boundary, and the MACD and signal line hold a steady upward trend.
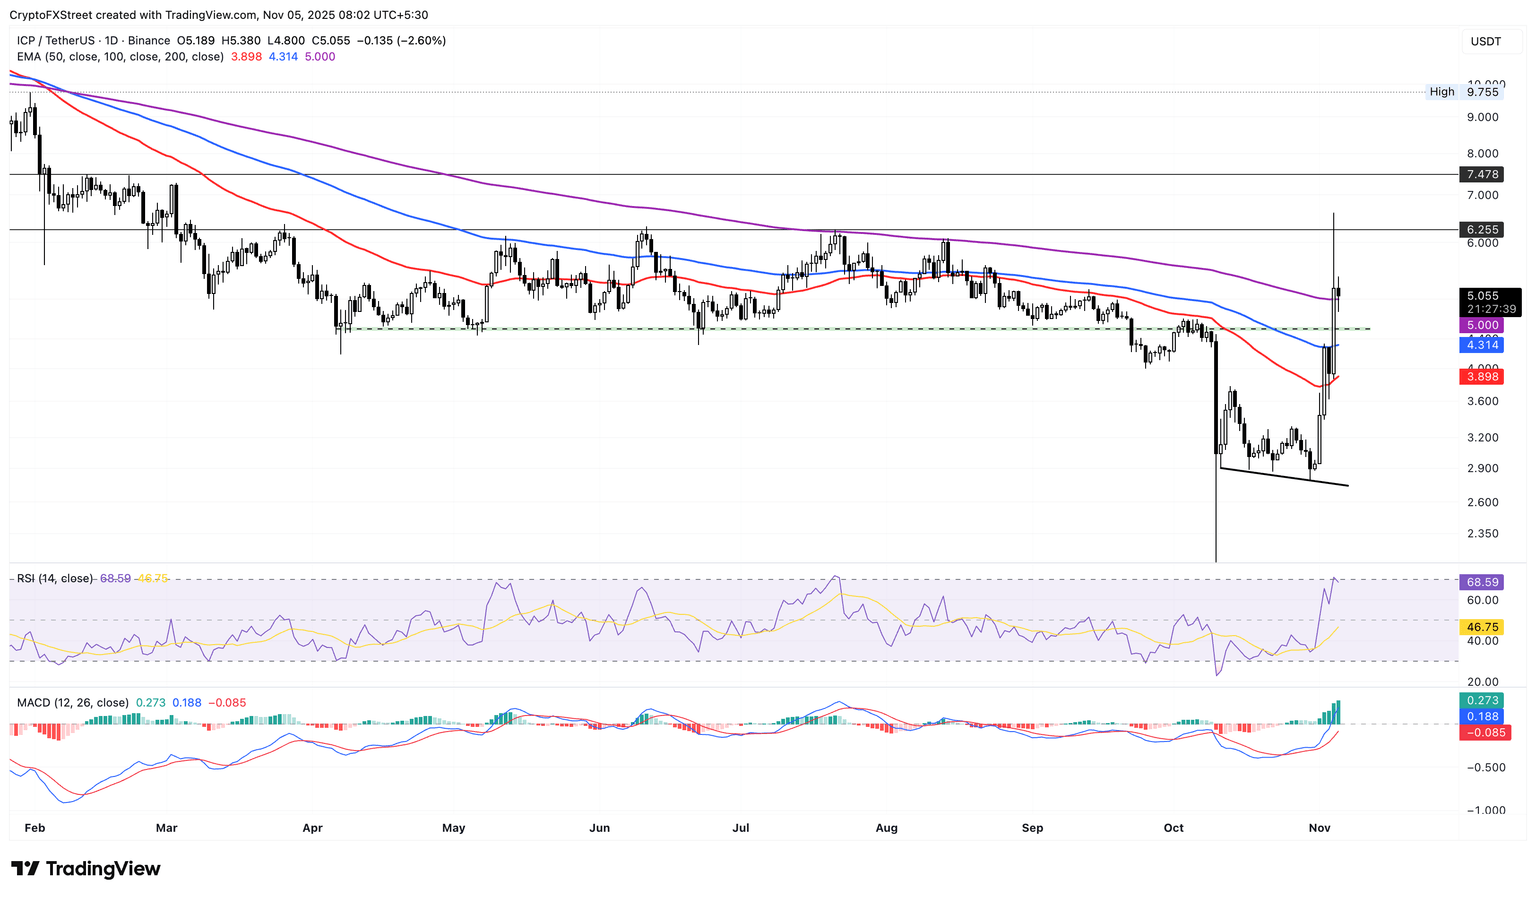
On the upside, if ICP secures a close above the July 21 high of $6.255, it could extend the rally to the $7.478 high from February 12.
New Zealand’s Unemployment Rate rises to 5.3% in Q3 vs. 5.3% expected

New Zealand’s Unemployment Rate rose to 5.3% in the third quarter (Q3) from 5.2% in the second quarter, according to the official data released by Statistics New Zealand on Wednesday. The figure came in line with the market consensus of 5.3%.
Furthermore, New Zealand’s Employment Change arrived at 0% in Q3 from a decrease of 0.1% in Q2, compared with the consensus forecast of a 0.1% increase. The participation rate in New Zealand declined to 70.3% in Q3, compared to 70.5% in the previous reading.
Market reaction to the New Zealand’s employment data
At the time of writing, the NZD/USD pair is trading 1.09% lower on the day to trade at 0.5648.
Employment FAQs
Labor market conditions are a key element to assess the health of an economy and thus a key driver for currency valuation. High employment, or low unemployment, has positive implications for consumer spending and thus economic growth, boosting the value of the local currency. Moreover, a very tight labor market – a situation in which there is a shortage of workers to fill open positions – can also have implications on inflation levels and thus monetary policy as low labor supply and high demand leads to higher wages.
The pace at which salaries are growing in an economy is key for policymakers. High wage growth means that households have more money to spend, usually leading to price increases in consumer goods. In contrast to more volatile sources of inflation such as energy prices, wage growth is seen as a key component of underlying and persisting inflation as salary increases are unlikely to be undone. Central banks around the world pay close attention to wage growth data when deciding on monetary policy.
The weight that each central bank assigns to labor market conditions depends on its objectives. Some central banks explicitly have mandates related to the labor market beyond controlling inflation levels. The US Federal Reserve (Fed), for example, has the dual mandate of promoting maximum employment and stable prices. Meanwhile, the European Central Bank’s (ECB) sole mandate is to keep inflation under control. Still, and despite whatever mandates they have, labor market conditions are an important factor for policymakers given its significance as a gauge of the health of the economy and their direct relationship to inflation.