Bitcoin, Ethereum, and Ripple are off to a bearish start in December, with over 4% losses by press time on Monday. Bitcoin, Ethereum, and Ripple face renewed selling, risking further losses to $80,000 BTC, $2,100 ETH, and $1.90 XRP, respectively.
Top 3 Price Prediction: Bitcoin, Ethereum, XRP face major losses as December begins
Bitcoin (BTC), Ethereum (ETH), and Ripple (XRP) are off to a bearish start in December, with over 4% losses by press time on Monday. Bitcoin, Ethereum, and Ripple face renewed selling, risking further losses to $80,000 BTC, $2,100 ETH, and $1.90 XRP, respectively.
The fresh sell-off wave aligns with Bank of Japan (BoJ) Governor Kazuo Ueda’s statement that possible interest rate hikes could be considered if the economy continues to evolve as predicted, which could increase borrowing costs and negatively affect carry trades.
Bitcoin under pressure risks a steeper correction ahead
Bitcoin trades below $87,000 by press time on Monday, preparing for a potential bearish marubozu candle on the daily chart. The intraday sell-off extends the pullback after the $92,800 level retest seen last week.
In line with renewed selling, the Relative Strength Index (RSI) is at 33 on the daily chart, pivoting downside towards the oversold after last week’s recovery and indicating a fresh wave of supply pressure. If RSI remains below 30, it could signal an extended downtrend in BTC prices.
Furthermore, the Moving Average Convergence Divergence (MACD) shifts from an uptrend to risking a potential cross below the red line, which would trigger a sell signal.
The immediate target for Bitcoin bears remains the $80,600 support level from November 21. If the cryptocurrency market fails to find a new bullish catalyst, BTC could revisit the April 7 low of $74,508.
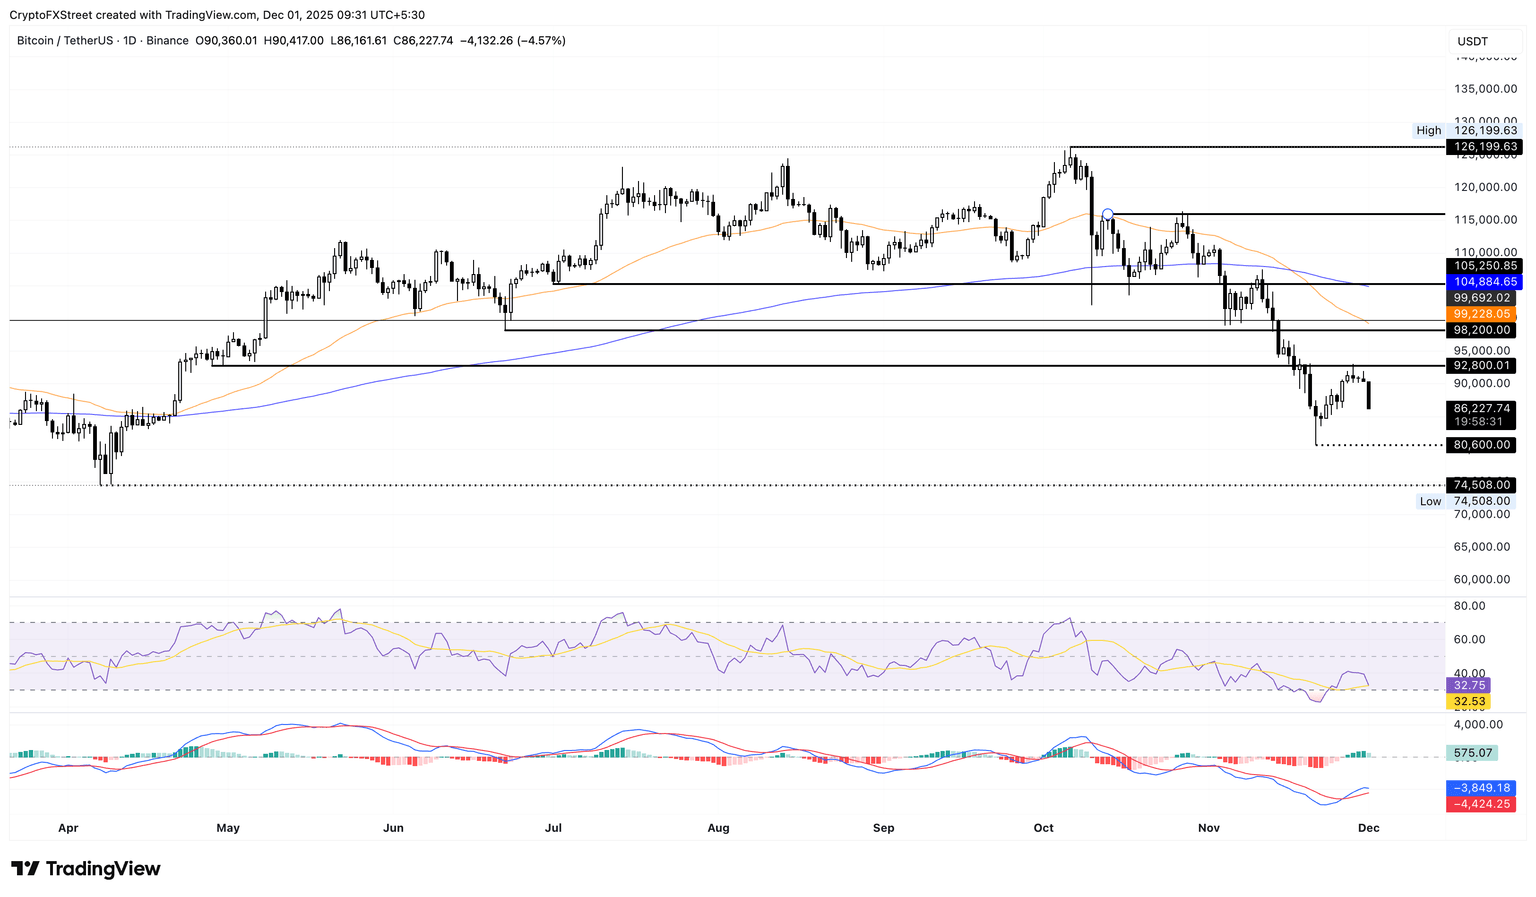
However, if a catalyst such as a potential US Federal Open Market Committee (FOMC) decision to cut interest rates, Bitcoin could rebound to $90,000 amid easier access to capital.
Ethereum bulls struggle to absorb incoming supply, risking further losses
Ethereum retraces 5% on the downside by press time on Monday from a resistance trendline on the daily chart. The bearish start to the week risks breaking below the supply zone near $2,800.
If ETH marks a successful daily close below the November 21 low of $2,623, it would confirm the range breakdown and potentially extend the decline to the June 22 low of $2,111.
Similar to BTC, the RSI at 34 and MACD risk a cross below the signal line indicate Ethereum is on the edge.
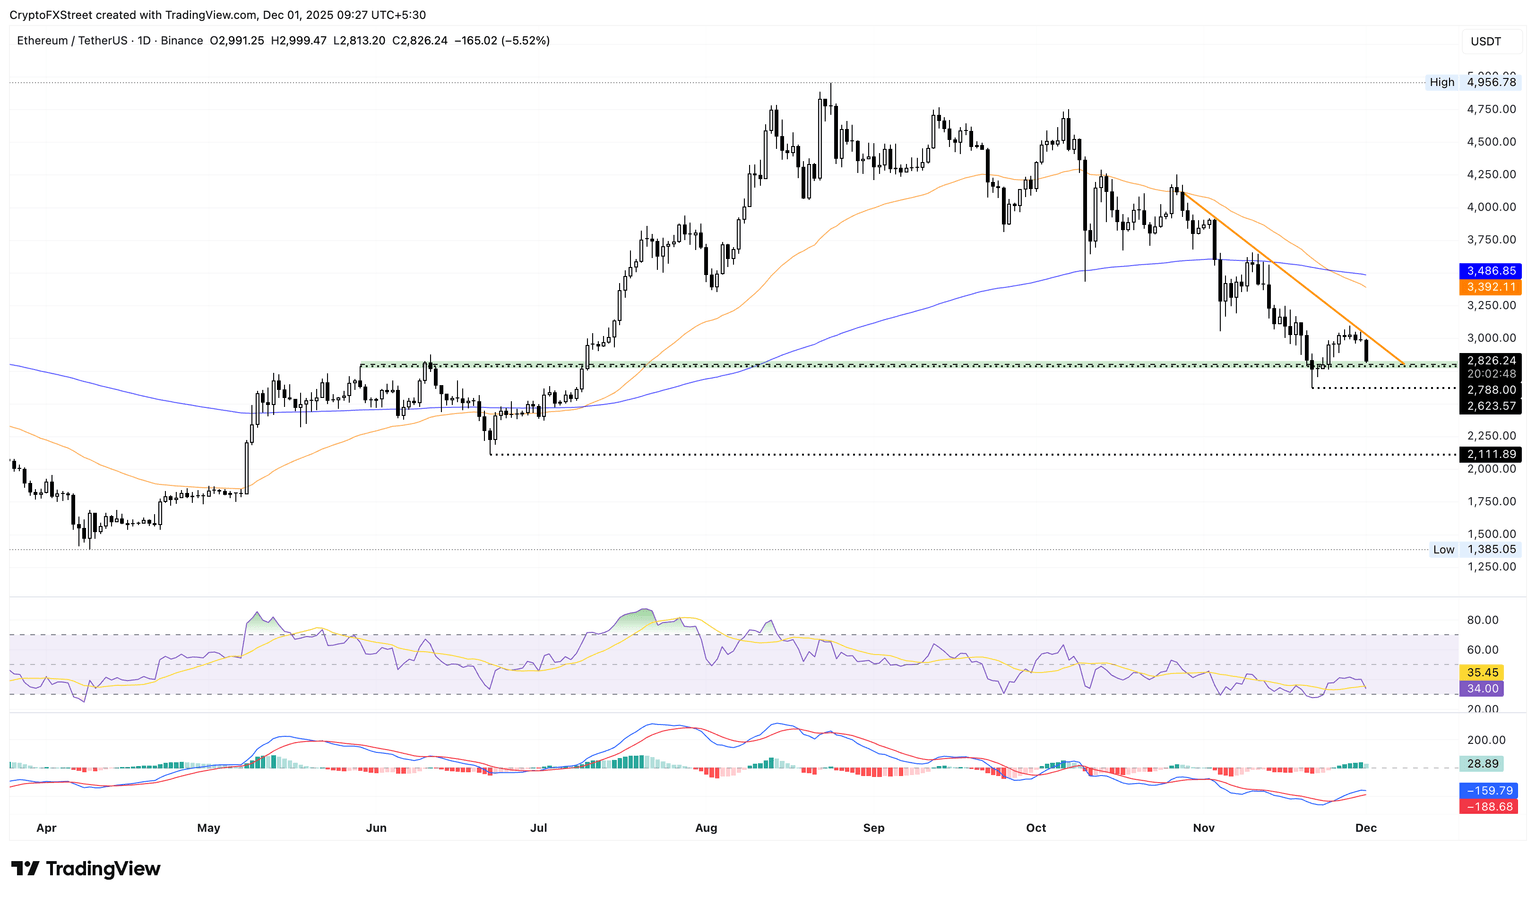
Looking up, a bounce back in Ethereum could challenge the overhead trendline near $3,000.
XRP experiences renewed bearish momentum
XRP price is down over 4% by press time on Monday, extending the 2% loss from Sunday. The cross-border remittance token is trading close to the $2.00 psychological level, with bears targeting the $1.90 support level, marked on June 22.
Momentum indicators on the daily chart signal similar bearishness for XRP, with the RSI at 40, suggesting increased selling pressure. Meanwhile, the MACD is closing towards the signal line for a potential crossover, which could confirm a bearish shift in the XRP price trend.
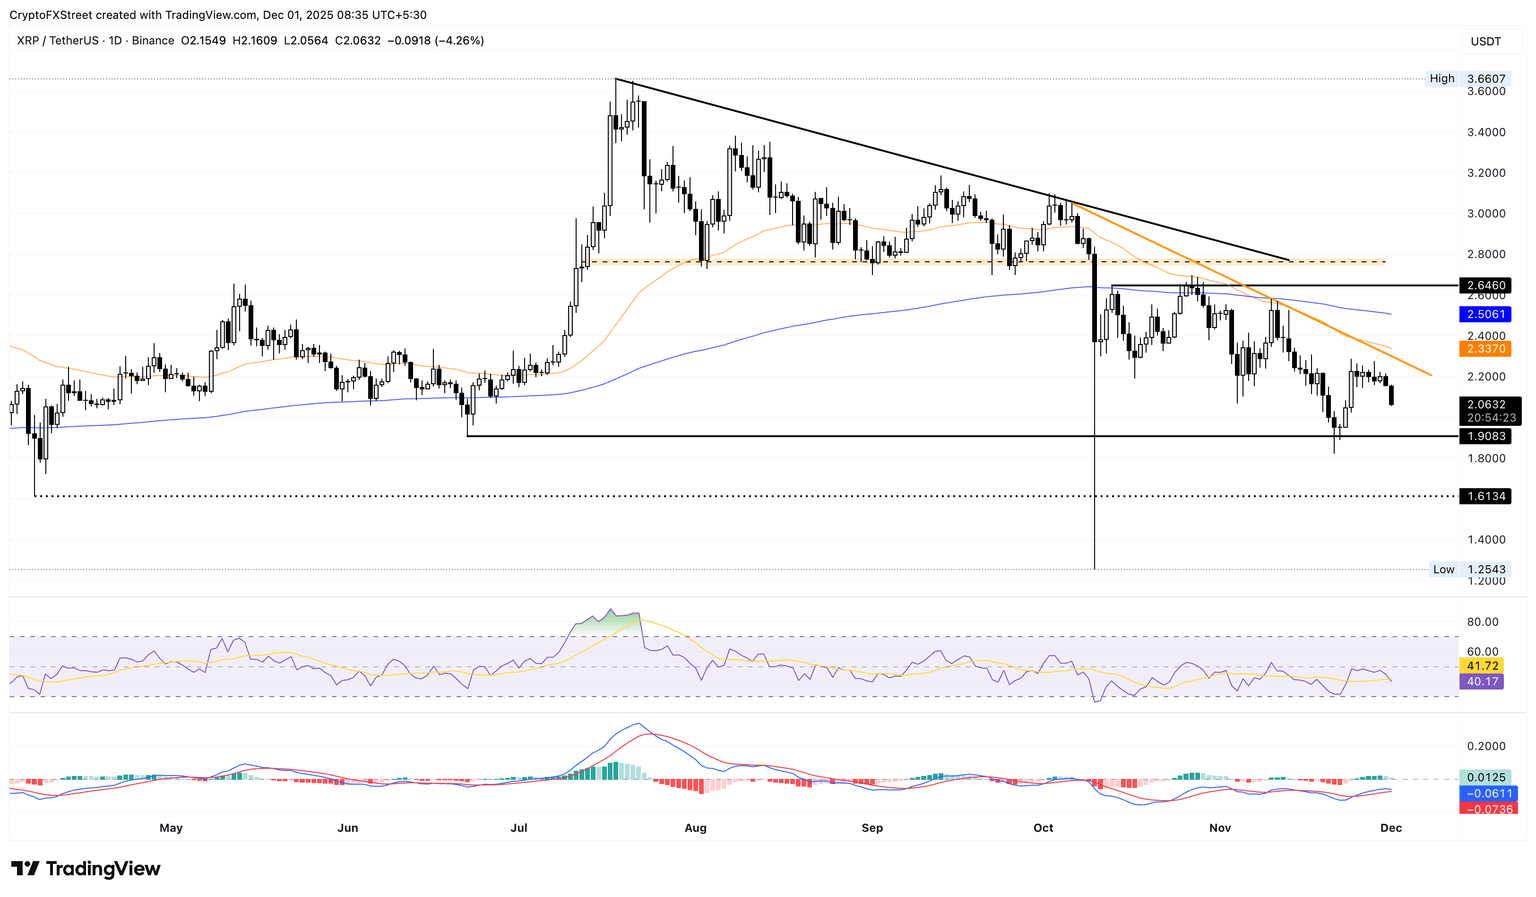
Optimistically, if XRP bulls hold dominance at the $2.00 level, a rebound towards the resistance trendline formed by connecting the October 6 and November 10 highs near the $2.20 level could be possible.
Bitcoin, altcoins, stablecoins FAQs
Bitcoin is the largest cryptocurrency by market capitalization, a virtual currency designed to serve as money. This form of payment cannot be controlled by any one person, group, or entity, which eliminates the need for third-party participation during financial transactions.
Altcoins are any cryptocurrency apart from Bitcoin, but some also regard Ethereum as a non-altcoin because it is from these two cryptocurrencies that forking happens. If this is true, then Litecoin is the first altcoin, forked from the Bitcoin protocol and, therefore, an “improved” version of it.
Stablecoins are cryptocurrencies designed to have a stable price, with their value backed by a reserve of the asset it represents. To achieve this, the value of any one stablecoin is pegged to a commodity or financial instrument, such as the US Dollar (USD), with its supply regulated by an algorithm or demand. The main goal of stablecoins is to provide an on/off-ramp for investors willing to trade and invest in cryptocurrencies. Stablecoins also allow investors to store value since cryptocurrencies, in general, are subject to volatility.
Bitcoin dominance is the ratio of Bitcoin’s market capitalization to the total market capitalization of all cryptocurrencies combined. It provides a clear picture of Bitcoin’s interest among investors. A high BTC dominance typically happens before and during a bull run, in which investors resort to investing in relatively stable and high market capitalization cryptocurrency like Bitcoin. A drop in BTC dominance usually means that investors are moving their capital and/or profits to altcoins in a quest for higher returns, which usually triggers an explosion of altcoin rallies.
Japan Jibun Bank Manufacturing PMI came in at 48.7, below expectations (48.8) in November
Gold kicks off the new week on a softer note, eroding part of Friday’s strong move up back toward the November swing high, though the downtick lacks bearish conviction. Dovish Fed expectations keep the USD depressed near its lowest level in nearly two weeks and continue to underpin the non-yielding bullion. Bulls, however, pause for a breather and await this week’s key US macro releases scheduled at the start of a new month.
China NBS Manufacturing PMI in line with expectations (49.2) in November
Bitcoin, Ethereum and Ripple are struggling to sustain their recovery on Friday, reflecting a sticky bearish sentiment. Since the October 10 flash crash, which liquidated over $19 billion in crypto assets in a single day, retail interest in crypto assets has been significantly suppressed.
China NBS Non-Manufacturing PMI down to 49.5 in November from previous 50.1
Bitcoin, Ethereum and Ripple are struggling to sustain their recovery on Friday, reflecting a sticky bearish sentiment. Since the October 10 flash crash, which liquidated over $19 billion in crypto assets in a single day, retail interest in crypto assets has been significantly suppressed.
UK set to launch crypto tax evasion measures in 2026

UK crypto exchanges will be required to report detailed transaction data on resident users to HM Revenue & Customs (HMRC) starting January 1, 2026, strengthening tax compliance among crypto investors in the region.
UK prepares fresh tax compliance rules for crypto exchanges
The UK is preparing to tighten oversight of digital asset activity, with new rules requiring crypto exchanges to provide HMRC with user data beginning in 2026.
Platforms must start collecting information on user transactions starting from January 1, 2026, under the new Crypto-Asset Reporting Framework (CARF).
The requirement forms part of a broad update to how the government monitors crypto-related income. Exchanges operating in the region will need to store full transaction histories for every UK-based customer, a change that could effectively remove the anonymity gap many crypto traders rely on.
CARF was introduced to close gaps left by the existing Common Reporting Standard (CRS), which does not cover crypto transactions and risks creating blind spots for tax authorities.
The expanded requirement provides HMRC with a consistent dataset for compliance checks, enabling the agency to detect tax evasion more effectively and ensure taxpayers meet their obligations.
Under the new structure, crypto exchanges will be designated as Reporting Cryptoasset Service Providers (RCASPs). The requirement is not directed towards individual users and is expected to have only a minimal effect on the crypto industry. HMRC estimates that around 50 businesses may need to make minor adjustments to capture transaction data for UK-resident customers, including software updates and additional record-keeping.
Once received, the data will be used to determine tax liability without relying on personal filings. Platforms that fail to meet the disclosure requirements will face penalties.
With the countdown to 2026 already underway, British crypto investors now face a far more transparent tax environment and significantly less room for error when reporting their digital asset activity.
The reporting system adds to the recent increase in crypto regulations over the past year. Several regulatory agencies, including those in the US and the EU, are increasingly seeking ways to ensure proper guidelines for managing crypto-related activities in their respective regions.
Amundi tokenizes €5 billion money market fund on Ethereum

Amundi has rolled out a tokenized share class for its AMUNDI FUNDS CASH EUR fund, developed with CACEIS and issued on the Ethereum blockchain.
Amundi brings money market fund on-chain in partnership with CACEIS
Amundi, Europe’s leading asset manager, announced the launch of a tokenized share class of the AMUNDI FUNDS CASH EUR money market fund on Thursday, a milestone made possible through its partnership with CACEIS, a key European player in asset servicing.
The inaugural transaction took place on November 4, marking the start of hybrid distribution for the fund, which will remain available through traditional channels alongside its new tokenized share class, AMUNDI FUNDS CASH EUR – J28 EUR DLT (C).
The initiative leverages the Ethereum blockchain to record fund units transparently and ensure secure, traceable transaction flows. By introducing a tokenized share class, Amundi is positioning itself within the growing segment of blockchain-enabled fund infrastructure in Europe, a market increasingly shaped by regulatory clarity and institutional experimentation.
“The tokenization of assets is a transformation set to accelerate in the coming years around the world. This first initiative on a money market fund demonstrates our expertise and the robustness of our methodology in covering concrete use cases,” said Jean-Jacques Barbéris, Head of Institutional and Corporate Clients, and ESG at Amundi.
The move signals a rise in tokenization in Europe, with Amundi’s new fund mirroring that of BlackRock’s BUIDL fund, which launched in March 2024.
Amundi’s choice of Ethereum adds to the picture. Ethereum is the largest blockchain for tokenized assets, with a market capitalization of $11.5 billion, according to RWA.xyz. This far outpaces BNB Chain and Solana networks, which follow behind with tokenized values of $1.6 billion and $827 million, respectively.
Standard Chartered previously predicted that Ethereum would lead the tokenization boom, emphasizing the network’s proven stability. The bank noted that Ethereum has operated for more than a decade without a single mainnet outage, arguing that advantages like higher speed or lower fees on alternative blockchains are ultimately “irrelevant” compared with Ethereum’s reliability, security, and established ecosystem.
The bank’s outlook reinforces the broader context behind Amundi’s move. Standard Chartered estimates that tokenized money-market funds and listed equities could each account for roughly $750 billion of an expected $2 trillion tokenized-assets market in the coming years. The remaining growth, according to the firm, will stem from tokenized funds, private equity, commodities, corporate debt, and real estate.
Amundi’s introduction of a blockchain-native share class adds another major institution to the roster of traditional finance players turning to Ethereum as the foundational layer for real-world asset tokenization.
Euro stays firm above 1.1600 as dovish December bets rise to 87%
EUR/USD steadies during Friday’s North American session set to finish the week and November’s in positive territory with gains o 0.81% and 0.59%, respectively as traders seem certain that the Federal Reserve will cut rates in December. The pair trades at 1.1601 after bouncing off daily lows of 1.1555.
Euro ends week and month higher as dovish Fed signals outweigh mixed US data
The US Dollar treads water amid growing speculation for a rate cut. Data from the CME FedWatch Tool shows that the odds for a 25-basis points reduction to the fed funds rate at 87% for the December meeting. The repricing was triggered by dovish comments of New York Fed John Williams and Fed Governor Christopher Waller, who favored reducing borrowing costs at the December meeting.
Data was mixed during the week. Inflation in the producer side stabilized, while jobs data revealed by the US Department of Labor, showed that the number of Americans filling for unemployment benefits, trimmed compared to the previous print.
Across the pond, Retail Sales in Germany missed estimates of October, while the Harmonized Index of Consumer Prices (HICP) for November exceeded forecasts, approaching the 3% threshold. In France, the Gross Domestic Product (GDP) for Q3 was aligned with estimates and the preliminary reading, while Spanish HICP broke the 3% threshold.
Given the backdrop, the EUR/USD path of least resistance is tilted to the upside, as the European Central Bank (ECB) hinted that its easing cycle was over, while the Fed is expected to cut in December.
Next week’s US economic calendar will be packed, featuring the November ISM Manufacturing and Services PMIs, Industrial Production, the ADP Employment Change report, and Initial Jobless Claims for the week ending November 29.
Euro Price This Month
The table below shows the percentage change of Euro (EUR) against listed major currencies this month. Euro was the strongest against the Japanese Yen.
| USD | EUR | GBP | JPY | CAD | AUD | NZD | CHF | |
|---|---|---|---|---|---|---|---|---|
| USD | -0.31% | -0.69% | 1.38% | -0.09% | 0.10% | 0.07% | 0.17% | |
| EUR | 0.31% | -0.39% | 1.63% | 0.22% | 0.39% | 0.38% | 0.48% | |
| GBP | 0.69% | 0.39% | 2.03% | 0.61% | 0.76% | 0.77% | 0.87% | |
| JPY | -1.38% | -1.63% | -2.03% | -1.44% | -1.24% | -1.26% | -1.19% | |
| CAD | 0.09% | -0.22% | -0.61% | 1.44% | 0.12% | 0.16% | 0.26% | |
| AUD | -0.10% | -0.39% | -0.76% | 1.24% | -0.12% | -0.00% | 0.11% | |
| NZD | -0.07% | -0.38% | -0.77% | 1.26% | -0.16% | 0.00% | 0.09% | |
| CHF | -0.17% | -0.48% | -0.87% | 1.19% | -0.26% | -0.11% | -0.09% |
The heat map shows percentage changes of major currencies against each other. The base currency is picked from the left column, while the quote currency is picked from the top row. For example, if you pick the Euro from the left column and move along the horizontal line to the US Dollar, the percentage change displayed in the box will represent EUR (base)/USD (quote).
Daily market movers: Euro poised to extend gains amid Dollar weakness
- The shared currency is propelled by a weak US Dollar as depicted by the US Dollar Index (DXY). DXY, which tracks the buck’s value against a basket of six peers, is down 0.08% at 99.44.
- German’s HICP annual rate rose by 2.6% above forecasts of 2.4%, up from 2.3% in September. Other data in France, GDP for Q3 2025 rose by 0.1% QoQ beating forecasts and up from 0% in Q2.
- Finally, Spain’s HICP expanded by 3.1% YoY in November, down from 3.2% a month ago, but exceeded forecasts of 2.9%.
Technical Outlook: EUR/USD subdued around 1.1600 waiting for catalyst
EUR/USD continues to trade sideways, with buyers unable to decisively break above the 1.1600 threshold to extend the advance toward the confluence of the 50- and 100-day Simple Moving Averages (SMAs) at 1.1620/1.1643. Momentum remains mildly positive, as reflected by the Relative Strength Index (RSI), although the indicator has flattened—suggesting that consolidation is likely to persist in the near term.
A clear breakout above the 50-/100-day SMA cluster would expose 1.1650, and once cleared, open the way for a test of the 1.1700 handle.
On the flip side, the Euro tumbling below 1.1550 increases the risk of a slide toward 1.1500. Further weakness would expose the November 5 swing low at 1.1468, followed by the 200-day SMA near 1.1431.

Euro FAQs
The Euro is the currency for the 20 European Union countries that belong to the Eurozone. It is the second most heavily traded currency in the world behind the US Dollar. In 2022, it accounted for 31% of all foreign exchange transactions, with an average daily turnover of over $2.2 trillion a day.
EUR/USD is the most heavily traded currency pair in the world, accounting for an estimated 30% off all transactions, followed by EUR/JPY (4%), EUR/GBP (3%) and EUR/AUD (2%).
The European Central Bank (ECB) in Frankfurt, Germany, is the reserve bank for the Eurozone. The ECB sets interest rates and manages monetary policy.
The ECB’s primary mandate is to maintain price stability, which means either controlling inflation or stimulating growth. Its primary tool is the raising or lowering of interest rates. Relatively high interest rates – or the expectation of higher rates – will usually benefit the Euro and vice versa.
The ECB Governing Council makes monetary policy decisions at meetings held eight times a year. Decisions are made by heads of the Eurozone national banks and six permanent members, including the President of the ECB, Christine Lagarde.
Eurozone inflation data, measured by the Harmonized Index of Consumer Prices (HICP), is an important econometric for the Euro. If inflation rises more than expected, especially if above the ECB’s 2% target, it obliges the ECB to raise interest rates to bring it back under control.
Relatively high interest rates compared to its counterparts will usually benefit the Euro, as it makes the region more attractive as a place for global investors to park their money.
Data releases gauge the health of the economy and can impact on the Euro. Indicators such as GDP, Manufacturing and Services PMIs, employment, and consumer sentiment surveys can all influence the direction of the single currency.
A strong economy is good for the Euro. Not only does it attract more foreign investment but it may encourage the ECB to put up interest rates, which will directly strengthen the Euro. Otherwise, if economic data is weak, the Euro is likely to fall.
Economic data for the four largest economies in the euro area (Germany, France, Italy and Spain) are especially significant, as they account for 75% of the Eurozone’s economy.
Another significant data release for the Euro is the Trade Balance. This indicator measures the difference between what a country earns from its exports and what it spends on imports over a given period.
If a country produces highly sought after exports then its currency will gain in value purely from the extra demand created from foreign buyers seeking to purchase these goods. Therefore, a positive net Trade Balance strengthens a currency and vice versa for a negative balance.
Ethereum Price Forecast: ETH shows recovery signs following rising exchange withdrawals
Ethereum price today: $3,050
- Ethereum could post its first weekly gain in five weeks, as buying pressure has begun to outweigh selling.
- Ethereum open interest remained stable, with short liquidations slightly dominating long liquidations.
- ETH is testing the $3,100 resistance after reclaiming the $2,850 key level.
Ethereum (ETH) is on track to mark its first weekly gain since October after showing signs of recovery this week.
The weekly average of ETH exchange netflow plunged to its lowest level in over a month. The trend accelerated on Friday, with outflows on the day outweighing inflows by nearly 180K ETH.

Exchange net outflows indicate investors are increasingly withdrawing assets from exchanges to private wallets for potential long-term holding.
Institutional investors also joined in the buying activity as ETH exchange-traded funds (ETFs) have seen four consecutive days of net inflows totalling $292 million, per SoSoValue data. The products are on track to record their first weekly inflow in November after ending an eight-day outflow streak last Friday.
On-chain activity is also returning, as Ethereum active addresses have begun trending upward. Notably, the metric spiked above 601,000 on Thursday, its highest level in 2025. The rise shows that investors may be returning to using DeFi protocols and other on-chain platforms.

Derivatives and on-chain data signal a bearish exhaustion
On the derivatives side, Ethereum’s futures open interest remained fairly stable, rising slightly to 12.1 million ETH on Friday, per Coinglass data. Liquidations slowed down considerably in the week, with liquidated short positions outweighing longs — a stark contrast from previous weeks. This suggests potential exhaustion among bearish traders.
From an on-chain perspective, the risk-off trend paused after ETH fell to the realized price or average cost basis of accumulation addresses — wallets with no record of selling activity — around $2,750-$2,850.

The same price range marks the average cost basis of whales within the 10K-100K ETH cohort.
Ethereum Price Forecast: ETH tackles $3,100 resistance
On the weekly chart, Ethereum could post its first weekly gains in five weeks after bouncing off the 200-week Exponential Moving Average (EMA) and reclaiming the $2,850 support.
The top altcoin is now facing resistance at $3,100, near the 100-week EMA. A firm rise above $3,100 could see ETH test the $3,470 level, but it has to clear the 50-week EMA on the way up.

The Relative Strength Index (RSI) has paused its downtrend while the Stochastic Oscillator (Stoch) is on the verge of crossing from oversold territory, signaling a decline in dominant bearish momentum.
Mexico Fiscal Balance, pesos: -16.75B (October) vs -198.11B
Bitcoin, Ethereum and Ripple are struggling to sustain their recovery on Friday, reflecting a sticky bearish sentiment. Since the October 10 flash crash, which liquidated over $19 billion in crypto assets in a single day, retail interest in crypto assets has been significantly suppressed.