After several days in the red, EUR/USD keeps slipping, touching new three-month throughs after breaching below the 1.1500 support on turnaround Tuesday. The pair remains under pressure on the back of the strong sentiment surrounding the US Dollar. With no major data releases on the docket, the focus now turns to what central bank officials have to say.
USD/JPY slides on verbal intervention, risk-off mood – ING

USD/JPY drops sharply as renewed verbal intervention from Japan’s finance minister and weaker global equities spark safe-haven demand and short-covering in Japanese Yen (JPY), ING’s FX analyst Francesco Pesole notes.
Equity selloff and short covering boost JPY
“This morning, we are seeing a sizeable drop in USD/JPY. That is likely being driven by more verbal FX intervention from the Japanese finance minister and a drop in global equity futures. It is a signal that the yen remains a go-to currency for safe-haven demand (which has been lackluster of late), but also that the extensive short positioning on JPY can fuel rapid rallies.”
EUR/JPY depreciates toward 177.00 due to possible BoJ rate hikes

EUR/JPY continues its losses, trading around 177.20 during the Asian hours on Tuesday. The currency cross struggles as the Japanese Yen (JPY) receives support from last week’s hawkish comments from the Bank of Japan (BoJ) Governor Kazuo Ueda, signaling the possibility of a rate hike in December or January next year.
However, the uncertainty prevails about the timing of the next BoJ rate hike amid speculations that Japan’s new Prime Minister Sanae Takaichi will pursue aggressive fiscal spending plans and resist policy tightening. Meanwhile, newly appointed Finance Minister Satsuki Katayama clarified that she no longer stands by her March assessment that the JPY’s fair value lies around 120–130 per dollar, emphasizing her current responsibility for overseeing currency policy.
However, the Euro (EUR) may receive support against its peers, limiting the downside of the EUR/JPY cross, from market expectations of no further interest rate moves by the European Central Bank (ECB) this year. The ECB kept interest rates unchanged for the third consecutive meeting in October, held last week, as expected, noting that the inflation outlook remains broadly stable, the economy continues to grow, and uncertainty persists.
Earlier data indicated that Eurozone inflation eased to slightly above the ECB’s 2% target, while third-quarter GDP growth surpassed expectations. Additionally, October business surveys indicated an improvement in overall sentiment.
ECB policymaker Francois Villeroy de Galhau noted that the central bank is in a good position after the October policy decision. However, Villeroy added that this position is not a fixed one. Governor of the Central Bank of Latvia, Martins Kazaks, said that risks to inflation and growth in the Eurozone are more balanced. Kazaks added that the central bank would act when necessary but should avoid reacting hastily.
Interest rates FAQs
Japan Jibun Bank Manufacturing PMI came in at 48.2, below expectations (48.3) in October
The Reserve Bank of Australia is widely expected to maintain the Official Cash Rate at 3.6% after its November monetary policy meeting on Tuesday. The decision will be announced at 03:30 GMT. The Monetary Policy Statement will be accompanied by the quarterly economic forecasts, followed by RBA Governor Michele Bullock’s press conference.
Argentina Tax Revenue (MoM) declined to 16B in September from previous 15445B
Information on these pages contains forward-looking statements that involve risks and uncertainties. Markets and instruments profiled on this page are for informational purposes only and should not in any way come across as a recommendation to buy or sell in these assets. You should do your own thorough research before making any investment decisions. FXStreet does not in any way guarantee that this information is free from mistakes, errors, or material misstatements. It also does not guarantee that this information is of a timely nature. Investing in Open Markets involves a great deal of risk, including the loss of all or a portion of your investment, as well as emotional distress. All risks, losses and costs associated with investing, including total loss of principal, are your responsibility. The views and opinions expressed in this article are those of the authors and do not necessarily reflect the official policy or position of FXStreet nor its advertisers. The author will not be held responsible for information that is found at the end of links posted on this page.
If not otherwise explicitly mentioned in the body of the article, at the time of writing, the author has no position in any stock mentioned in this article and no business relationship with any company mentioned. The author has not received compensation for writing this article, other than from FXStreet.
FXStreet and the author do not provide personalized recommendations. The author makes no representations as to the accuracy, completeness, or suitability of this information. FXStreet and the author will not be liable for any errors, omissions or any losses, injuries or damages arising from this information and its display or use. Errors and omissions excepted.
The author and FXStreet are not registered investment advisors and nothing in this article is intended to be investment advice.
Ripple Price Forecast: XRP risks another 10% plunge as retail demand wobbles
Ripple (XRP) recovery remains elusive, trading above $2.40 at the time of writing on Monday. The broader cryptocurrency market is heavily weighed down by risk-off sentiment, triggering a persistent sell-off.
Meanwhile, demand for XRP has remained significantly suppressed since the October 10 sell-off, which saw over $19 billion in crypto assets liquidated on a single day, as evidenced by the weak XRP derivatives market.
XRP extends intraday decline amid low retail interest
XRP highlights a weakening technical structure, worsened by waning retail demand. According to CoinGlass data, the XRP Open Interest (OI), representing the notional value of outstanding futures contracts, averages $4.33 billion at the time of writing, down from $9.09 billion, which marked its peak level in October.
If investors increasingly reduce their risk exposure, the prevailing decline could accelerate toward $2.18, a support area tested on October 17.
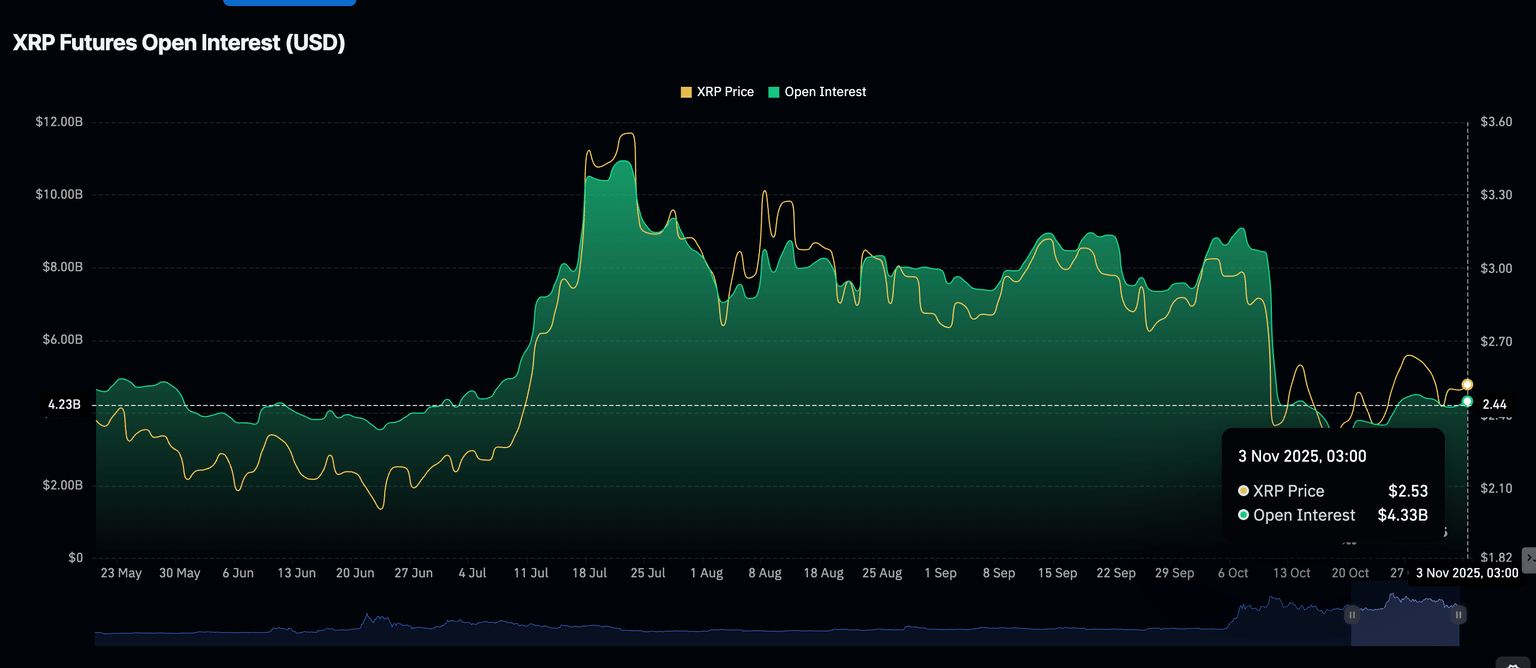
XRP Futures Open Interest | Source: CoinGlass
The XRP OI-weighted funding rate holds at 0.0010%, down from 0.0085% on Sunday. This drop suggests traders may be intentionally closing their long positions and piling into short positions, thereby depriving XRP of the tailwind needed to sustain its recovery.
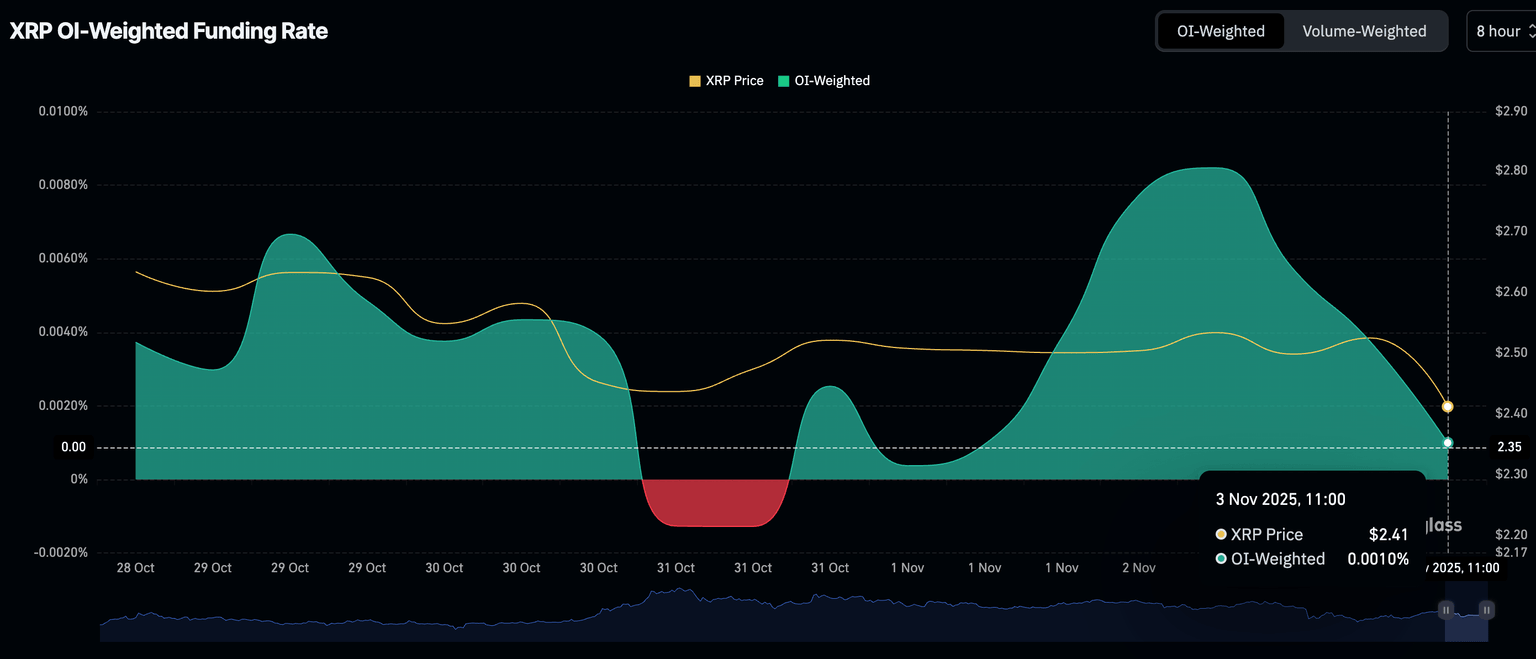
XRP OI-weighted funding rate | Source: CoinGlass
Technical outlook: Assessing XRP price above key support
XRP is largely in bearish hands, testing a short-term support at $2.40 at the time of writing on Monday. The Relative Strength Index (RSI) at 41 and falling toward oversold territory on the daily chart indicates that bearish momentum is increasing.
The Moving Average Convergence Divergence (MACD) indicator on the same daily chart will likely trigger a sell signal in upcoming sessions. Such a signal occurs when the blue MACD line crosses and settles below the red signal line, calling upon investors to reduce their risk exposure.
XRP’s position below key moving averages, including the 200-day Exponential Moving Average (EMA) at $2.60, the 50-day EMA at $2.64 and the 100-day EMA at $2.72, reinforces the bearish outlook.
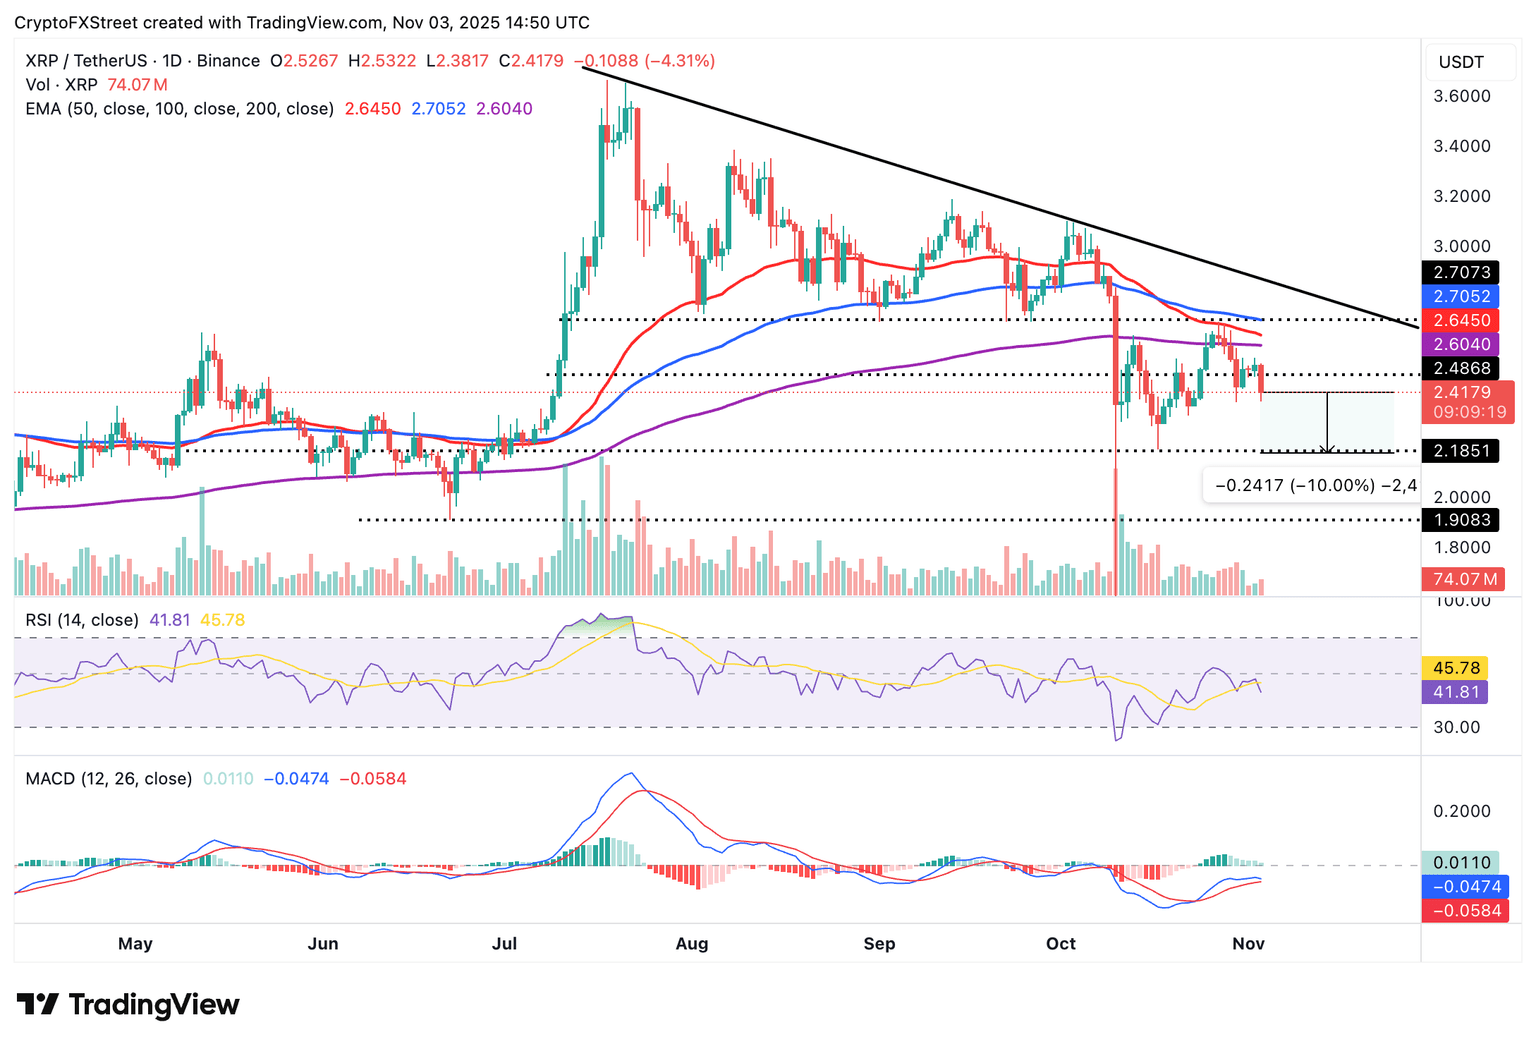
XRP/USDT daily chart
XRP is also staring at a 10% decline if its immediate support at $2.40 breaks. A daily close below this level may mean a prolonged bearish streak this week. Key areas of interest for traders are the support at $2.18, last tested on October 17, and $1.90, previously tested in June.
Still, traders cannot rule out a knee-jerk trend reversal if support at $2.40 holds, which could encourage investors to buy the dip. Key milestones that could mark the transition from bearish to bullish sentiment include a break above the 200-day EMA at $2.60, the 50-day EMA at $2.64, the 100-day EMA at $2.72 and the descending trendline, which has been in place since XRP achieved its new all-time high of $3.66 in July.
Ripple FAQs
Pound Sterling wobbles against US Dollar ahead of US ISM Manufacturing PMI
The Pound Sterling (GBP) trades cautiously against its peers at the start of the week. The British currency is expected to remain volatile amid uncertainty surrounding the Bank of England’s (BoE) interest rate policy, which will be announced on Thursday.
Traders see a one in three chance that the BoE will cut interest rates by 25 basis points (bps) to 3.75%, according to a Reuters report. BoE dovish expectations have accelerated lately due to slower-than-projected United Kingdom (UK) Consumer Price Index (CPI) growth seen in September and signs of moderating labor demand reflected by the employment data for the three months ending August.
In the September policy meeting, the BoE also stated that inflationary pressures would peak around 4% this month.
Meanwhile, think tanks of the market have become divided over the BoE’s monetary policy decision on Thursday. Analysts at Goldman Sachs now expect the BoE to cut interest rates by 25 bps to 3.75% on Thursday, while ING anticipates the UK central bank to hold rates steady with a 5-4 vote split.
Pound Sterling Price Today
The table below shows the percentage change of British Pound (GBP) against listed major currencies today. British Pound was the weakest against the Australian Dollar.
| USD | EUR | GBP | JPY | CAD | AUD | NZD | CHF | |
|---|---|---|---|---|---|---|---|---|
| USD | 0.19% | 0.23% | 0.11% | 0.21% | -0.03% | 0.02% | 0.31% | |
| EUR | -0.19% | 0.05% | -0.11% | 0.03% | -0.22% | -0.15% | 0.15% | |
| GBP | -0.23% | -0.05% | -0.12% | -0.02% | -0.25% | -0.19% | 0.11% | |
| JPY | -0.11% | 0.11% | 0.12% | 0.10% | -0.12% | 0.06% | 0.24% | |
| CAD | -0.21% | -0.03% | 0.02% | -0.10% | -0.26% | -0.17% | 0.13% | |
| AUD | 0.03% | 0.22% | 0.25% | 0.12% | 0.26% | 0.07% | 0.39% | |
| NZD | -0.02% | 0.15% | 0.19% | -0.06% | 0.17% | -0.07% | 0.30% | |
| CHF | -0.31% | -0.15% | -0.11% | -0.24% | -0.13% | -0.39% | -0.30% |
The heat map shows percentage changes of major currencies against each other. The base currency is picked from the left column, while the quote currency is picked from the top row. For example, if you pick the British Pound from the left column and move along the horizontal line to the US Dollar, the percentage change displayed in the box will represent GBP (base)/USD (quote).
Daily digest market movers: Receding Fed dovish bets strengthen US Dollar
- The Pound Sterling consolidates around 1.3140 against the US Dollar (USD) during the European trading session on Monday. The GBP/USD pair turns sideways after finding a temporary floor near an over six-month low around 1.3100 posted on Friday. The pair is expected to remain under pressure as the US Dollar trades firmly due to receding Federal Reserve (Fed) dovish expectations for the December policy meeting.
- At the time of writing, the US Dollar Index (DXY), which tracks the Greenback’s value against six major currencies, trades firmly near the three-month high of 99.85 posted on Friday.
- According to the CME FedWatch tool, the probability of the Fed cutting interest rates by 25 basis points (bps) to the 3.50%-3.75% range in the December meeting has eased to 69.3% from 94.4% a week ago.
- Fed dovish expectations have cooled down significantly following comments from Fed Chair Jerome Powell in the press conference on Wednesday, signaling that the central bank has no significant plans to cut interest rates in December.
- Powell stated that the December cut is “far from a foregone conclusion”, clarifying that there were “strongly different views” in the meeting, and the takeaway is that “we haven’t made a decision about December”, Bloomberg reported.
- Meanwhile, comments from a few Fed officials on Friday showed that they are concerned over upside inflation risks, with price pressures remaining well-above the central bank’s 2% target.
- “Need to maintain some restriction to bring down inflation,” Cleveland Fed Bank President Beth Hammack said at a conference hosted by the Fed Bank of Dallas on Friday.
- In Monday’s session, investors will focus on the US ISM Manufacturing Purchasing Managers’ Index (PMI) data for October, which will be released at 15:00 GMT. The Manufacturing PMI is expected to come in at 49.2, marginally higher than 49.1 in September. However, a figure below 50.0 is considered a contraction in the business activity.
Technical Analysis: Pound Sterling sees more downside towards 1.3000

The Pound Sterling finds temporary support against the US Dollar near an over six-month low at around 1.3100 posted on Friday. The outlook of the Cable remains bearish as it trades below the 200-day Exponential Moving Average (EMA), which is around 1.3290.
The 14-day Relative Strength Index (RSI) slumps to near 30.00, indicating that the overall momentum is bearish.
Looking down, the psychological level of 1.3000 will act as a key support zone. On the upside, the October 28 high around 1.3370 will act as a key barrier.
USD/INR exhibits strength as US Dollar continues to outperform
The Indian Rupee (INR) opens on a flat note against the US Dollar (USD) near its over two-week high around 88.95 at the start of the new month on Monday. The USD/INR pair aims to extend its six-day winning streak as the Indian Rupee (INR) continues to underperform due to Foreign Institutional Investors (FIIs) selling in the Indian stock market, and the US Dollar (USD) extends its rally amid escalating doubts over further interest rate cuts by the Federal Reserve (Fed) for the December policy meeting.
With the foreign outflow of Rs. 2,346.89 crores worth of shares from the Indian equity market in October, FIIs have turned out to be net sellers for the fourth month in a row. However, the pace of FIIs selling appears to have slowed down significantly. The amount of stake pared by overseas investors in the Indian equity market in October is significantly lower than the average selling of Rs. 43,290.32 crores seen in the July-September period.
FIIs have been keeping a distance from the Indian stock market amid the delay in a breakthrough in trade talks between the United States (US) and India. Negotiators from both nations have been signaling that they are close to striking a trade agreement, but have not yet reached a consensus.
Meanwhile, a report from Reuters has shown that the odds of the Reserve Bank of India (RBI) intervening in the currency market are high as the USD/INR is approaching its all-time high of 89.12 posted in late September.
The table below shows the percentage change of Indian Rupee (INR) against listed major currencies today. Indian Rupee was the weakest against the Australian Dollar.
| USD | EUR | GBP | JPY | CAD | AUD | INR | CHF | |
|---|---|---|---|---|---|---|---|---|
| USD | 0.02% | 0.07% | 0.14% | 0.02% | -0.18% | 0.02% | -0.05% | |
| EUR | -0.02% | 0.07% | 0.09% | -0.00% | -0.20% | 0.01% | -0.05% | |
| GBP | -0.07% | -0.07% | 0.06% | -0.07% | -0.24% | -0.05% | -0.11% | |
| JPY | -0.14% | -0.09% | -0.06% | -0.12% | -0.29% | -0.09% | -0.15% | |
| CAD | -0.02% | 0.00% | 0.07% | 0.12% | -0.22% | 0.03% | -0.04% | |
| AUD | 0.18% | 0.20% | 0.24% | 0.29% | 0.22% | 0.20% | 0.17% | |
| INR | -0.02% | -0.01% | 0.05% | 0.09% | -0.03% | -0.20% | -0.06% | |
| CHF | 0.05% | 0.05% | 0.11% | 0.15% | 0.04% | -0.17% | 0.06% |
The heat map shows percentage changes of major currencies against each other. The base currency is picked from the left column, while the quote currency is picked from the top row. For example, if you pick the Indian Rupee from the left column and move along the horizontal line to the US Dollar, the percentage change displayed in the box will represent INR (base)/USD (quote).
Daily digest market movers: Fed officials express concerns over upside inflation risks
- The US Dollar has been outperforming since the monetary policy announcement by the Federal Reserve (Fed) on Wednesday. During the press time, the US Dollar Index (DXY), which tracks the Greenback’s value against six major currencies, trades firmly near a fresh three-month high around 99.85.
- In Wednesday’s monetary policy announcement, the Fed reduced interest rates for the second straight meeting by 25 basis points (bps) to 3.75%-4.00%, but Chair Jerome Powell argued against cutting interest rates again in the December meeting.
- Fed’s Powell stated that the December cut is “far from assured”. Powell clarified that there were “strongly different views” in the meeting, and the takeaway is that “we haven’t made a decision about December”, Bloomberg reported.
- Since then, traders have trimmed bets supporting more interest rate cuts by the Fed for the December policy meeting. According to the CME FedWatch tool, the probability of the Fed to cut interest rates by 25 basis points (bps) to 3.50%-3.75% in the December meeting has eased to 69.3% from 91.7% seen a week ago.
- Meanwhile, a few Federal Open Market Committee (FOMC) members have also argued against reducing interest rates further, citing that inflationary pressures are well above the central bank’s 2% target.
- “Given the move that we just made, I think we’re right around my estimate of neutral: I think we’re barely restrictive if at all,” Cleveland Fed President Beth Hammack said on Friday. He added, “I do think we need to maintain some amount of restriction to help bring inflation back down to target,” Reuters reported.
- On the contrary, Fed Governor Christopher Waller has stressed on reducing interest rates further, in an interview on Fox Business Network, citing labor market risks. “The biggest concern we have right now is the labor market, while expressing confidence that price pressures are going to come back down.”
Technical Analysis: USD/INR aims to revisit all-time high above 89.00

USD/INR trades firmly near over two-week high around 88.95 at the start of the week. The near-term trend of the pair remains bullish as it trades above the 20-day Exponential Moving Average (EMA), which trades around 88.54.
The 14-day Relative Strength Index (RSI) breaks above 60.00. A fresh bullish momentum would emerge if the RSI sustains above that level.
Looking down, the August 21 low of 87.07 will act as key support for the pair. On the upside, the all-time high of 89.12 will be a key barrier.
Economic Indicator
Fed Interest Rate Decision
The Federal Reserve (Fed) deliberates on monetary policy and makes a decision on interest rates at eight pre-scheduled meetings per year. It has two mandates: to keep inflation at 2%, and to maintain full employment. Its main tool for achieving this is by setting interest rates – both at which it lends to banks and banks lend to each other. If it decides to hike rates, the US Dollar (USD) tends to strengthen as it attracts more foreign capital inflows. If it cuts rates, it tends to weaken the USD as capital drains out to countries offering higher returns. If rates are left unchanged, attention turns to the tone of the Federal Open Market Committee (FOMC) statement, and whether it is hawkish (expectant of higher future interest rates), or dovish (expectant of lower future rates).
Last release: Wed Oct 29, 2025 18:00
Frequency: Irregular
Actual: 4%
Consensus: 4%
Previous: 4.25%
Source: Federal Reserve
US President Donald Trump says will block Nvidia’s Blackwell AI chip sales to China

US President Donald Trump said that the United States (US) will prevent China from obtaining Nvidia’s most advanced semiconductor technology, CBS News reported on Monday.
Trump underscored national security risks as Washington’s continued focus on restricting the flow of cutting-edge artificial intelligence hardware to its strategic rival.
Elsewhere, Trump said on Sunday he will not attend the Supreme Court’s upcoming oral arguments concerning the legality of his global tariffs. Justices have a Wednesday hearing scheduled for arguments on the tariffs case. Trump further stated that despite his desire to be there, he does not want to create a distraction during the hearing.
Market reaction
At the time of writing, the US Dollar Index (DXY) is trading 0.09% higher on the day to trade at 99.80.
US Dollar FAQs
The US Dollar (USD) is the official currency of the United States of America, and the ‘de facto’ currency of a significant number of other countries where it is found in circulation alongside local notes. It is the most heavily traded currency in the world, accounting for over 88% of all global foreign exchange turnover, or an average of $6.6 trillion in transactions per day, according to data from 2022.
Following the second world war, the USD took over from the British Pound as the world’s reserve currency. For most of its history, the US Dollar was backed by Gold, until the Bretton Woods Agreement in 1971 when the Gold Standard went away.
The most important single factor impacting on the value of the US Dollar is monetary policy, which is shaped by the Federal Reserve (Fed). The Fed has two mandates: to achieve price stability (control inflation) and foster full employment. Its primary tool to achieve these two goals is by adjusting interest rates.
When prices are rising too quickly and inflation is above the Fed’s 2% target, the Fed will raise rates, which helps the USD value. When inflation falls below 2% or the Unemployment Rate is too high, the Fed may lower interest rates, which weighs on the Greenback.
In extreme situations, the Federal Reserve can also print more Dollars and enact quantitative easing (QE). QE is the process by which the Fed substantially increases the flow of credit in a stuck financial system.
It is a non-standard policy measure used when credit has dried up because banks will not lend to each other (out of the fear of counterparty default). It is a last resort when simply lowering interest rates is unlikely to achieve the necessary result. It was the Fed’s weapon of choice to combat the credit crunch that occurred during the Great Financial Crisis in 2008. It involves the Fed printing more Dollars and using them to buy US government bonds predominantly from financial institutions. QE usually leads to a weaker US Dollar.
Quantitative tightening (QT) is the reverse process whereby the Federal Reserve stops buying bonds from financial institutions and does not reinvest the principal from the bonds it holds maturing in new purchases. It is usually positive for the US Dollar.
Tokenization market to reach $2 trillion by 2028, Ethereum to dominate: Standard Chartered

Standard Chartered Bank projects that the market value of tokenized real-world assets, excluding stablecoins, could surge from around $35 billion today to nearly $2 trillion by 2028.
Standard Chartered predicts tokenization market will boom to $2 trillion by 2028
Standard Chartered’s head of digital assets research, Geoffrey Kendrick, expects the real-world asset (RWA) market, excluding stablecoins, to soar to $2 trillion by 2028, according to a note on Thursday.
The projected surge would be up from about $35 billion currently, putting it on par with the firm’s forecast for the stablecoin market.
The bank noted that decentralized finance (DeFi) is rapidly evolving into a viable alternative to traditional financial systems that rely on centralized intermediaries, such as banks.
“Stablecoins have laid the groundwork (via increased awareness, liquidity and lending/borrowing on-chain) for other asset classes, from tokenised MMFs [money market funds] to tokenised equities, to move onchain at scale,” Kendrick noted.
Kendrick believes most of this growth will take place on Ethereum, emphasizing the network’s proven stability. He highlighted that Ethereum has operated for over a decade without a single mainnet outage, adding that factors such as speed or lower costs on competing blockchains are “irrelevant” compared to Ethereum’s reliability and track record.
Standard Chartered estimates that tokenized money-market funds and listed equities could each represent about $750 billion of the projected $2 trillion market, while funds, private equity, commodities, corporate debt, and real estate would make up the remaining share.
Kendrick noted that the surge in stablecoin adoption in 2025 has transformed DeFi from a niche sector into a mainstream financial ecosystem, empowering non-bank entities to manage payments and savings traditionally controlled by banks.
He highlighted lending and RWA tokenization as the two segments where DeFi protocols hold the greatest potential to challenge and reshape traditional finance.
The report added that growing stablecoin usage in developed markets has boosted on-chain liquidity, driving fresh innovation across DeFi services such as lending and borrowing.
“Stablecoins have created several necessary pre-conditions for a broader expansion of DeFi via the three pillars of increased public awareness, onchain liquidity, and onchain lending/borrowing activity in fiat-pegged product,” Kendrick said.
Despite its optimistic view, Standard Chartered warns of potential risks, particularly if the United States fails to establish clear regulatory guidelines before the 2026 midterm elections. However, it says such an event isn’t its base case.