Gold is flatlining in a tight range above $3,850 early Friday, following its two-way business on Wednesday, on track to register the seventh consecutive weekly rise. The Artificial Intelligence (AI) frenzy-driven record highs on global stocks and a bout of profit-taking seemed to restrict the yellow metal’s upside attempts in the US last session.
Silver Price Forecast: XAG/USD edges lower to near $46.50 on profit-taking

The Silver price (XAG/USD) declines to near $46.65 during the Asian trading hours on Friday. The white metal retreats from an all-time high on some profit-taking. The potential downside for silver might be limited amid safe-haven flows, bolstered by global uncertainty and growing bets that the Federal Reserve (Fed) will need to ease policy further in the coming months.
The shutdown in the United States (US) has frozen key economic indicators, including the September Nonfarm Payrolls (NFP) release, leaving traders without key data to assess the labor market. This, in turn, could exert some selling pressure on the US Dollar (USD) and lift the USD-denominated commodity price. Due to the US government shutdown, traders will digest private-sector job market projections instead of the highly anticipated NFP report.
Furthermore, geopolitical risks in Russia and the Middle East could boost the safe-haven asset like Silver during periods of international instability. Russian President Vladimir Putin warned that supplying US missiles to Ukraine would lead to a “whole new level of escalation,” including in relations between Moscow and Washington. The Wall Street Journal reported on Thursday that the US will provide Ukraine with intelligence on long-range energy infrastructure targets deep inside Russia.
Meanwhile, hawkish remarks from the Dallas Fed President Lorie Logan on Thursday could weigh on the Silver price. Lorie noted that the US central bank appropriately cut rates last month to guard against the risk of a sharp deterioration in the job market, but said that so far the cooling has been gradual and signaled she is not eager to cut rates further.
Silver FAQs
Silver is a precious metal highly traded among investors. It has been historically used as a store of value and a medium of exchange. Although less popular than Gold, traders may turn to Silver to diversify their investment portfolio, for its intrinsic value or as a potential hedge during high-inflation periods. Investors can buy physical Silver, in coins or in bars, or trade it through vehicles such as Exchange Traded Funds, which track its price on international markets.
Silver prices can move due to a wide range of factors. Geopolitical instability or fears of a deep recession can make Silver price escalate due to its safe-haven status, although to a lesser extent than Gold’s. As a yieldless asset, Silver tends to rise with lower interest rates. Its moves also depend on how the US Dollar (USD) behaves as the asset is priced in dollars (XAG/USD). A strong Dollar tends to keep the price of Silver at bay, whereas a weaker Dollar is likely to propel prices up. Other factors such as investment demand, mining supply – Silver is much more abundant than Gold – and recycling rates can also affect prices.
Silver is widely used in industry, particularly in sectors such as electronics or solar energy, as it has one of the highest electric conductivity of all metals – more than Copper and Gold. A surge in demand can increase prices, while a decline tends to lower them. Dynamics in the US, Chinese and Indian economies can also contribute to price swings: for the US and particularly China, their big industrial sectors use Silver in various processes; in India, consumers’ demand for the precious metal for jewellery also plays a key role in setting prices.
Silver prices tend to follow Gold’s moves. When Gold prices rise, Silver typically follows suit, as their status as safe-haven assets is similar. The Gold/Silver ratio, which shows the number of ounces of Silver needed to equal the value of one ounce of Gold, may help to determine the relative valuation between both metals. Some investors may consider a high ratio as an indicator that Silver is undervalued, or Gold is overvalued. On the contrary, a low ratio might suggest that Gold is undervalued relative to Silver.
Ethereum Price Forecast: ETH tackles $4,500 resistance following rising whale demand
Ethereum price today: $4,480
- Ethereum whales have bought over 840,000 ETH in the past two weeks.
- The balance on accumulation addresses grew by a record 5.6 million ETH in September, despite the price decline in the month.
- ETH has broken above the 50-day SMA and is now testing the $4,500 resistance.
Ethereum (ETH) continued its uptrend on Thursday, testing the $4,500 resistance following sustained buying activity across whale and accumulation addresses.
Ethereum whales scoop 840,000 ETH, accumulation addresses set new record
Ethereum whales have increased their buying pressure over the past two weeks, following ETH’s dip, and have continued even with the recent recovery.
Since September 18, investors with a balance of 10K-100K ETH have grown their collective holdings by 840K ETH, according to CryptoQuant data. Continued buying pressure from whales during price dips often indicates confidence in a price recovery, which has played out in the past week.
A similar action is evident across accumulation addresses — wallets with no selling activity — which added a record 5.6 million ETH to their balance in September. Accumulation addresses have now set a new monthly buying record for a third consecutive month.

ETH Balance on Accumulation Addresses. Source: CryptoQuant
Institutional demand has also returned for the top altcoin, with US spot ETH exchange-traded funds (ETFs) recording three consecutive days of net inflows, totaling $755.2 million on Wednesday, per SoSoValue data.
While underlying demand continues to expand, the recent price recovery has pushed a few whales to partially book profits, according to data compiled by smart money tracker Lookonchain.
On the derivatives side, open interest (OI) has remained largely subdued, despite the price recovery seen over the past week. However, signs of a returning risk-on sentiment emerged on Thursday, following a 280K ETH jump in the metric, per Coinglass data. The lag in OI growth suggests that ETH’s recent price recovery is largely driven by spot buying pressure rather than leverage.

ETH Open Interest. Source: Coinglass
Ethereum Price Forecast: ETH tests $4,500 resistance after clearing 50-day SMA
Ethereum experienced $129.9 million in futures liquidations over the past 24 hours, with short liquidations accounting for $106.2 million.
The top altcoin has crossed above the 50-day Simple Moving Average (SMA) and is now testing the $4,500 resistance, which has proven to be a key level over the past two months. Just above $4,500 lies a descending trendline hurdle that ETH must overcome before a potential move to $4,835.

ETH/USDT daily chart
The $4,100 support and 100-day SMA are key levels to watch if ETH sees a rejection at $4,500.
The Relative Strength Index (RSI) is above its neutral level while the Stochastic Oscillator (Stoch) is slightly in the overbought region, indicating dominant bullish momentum.
Gold Price Forecast: XAU/USD recovers after flirting with $3,820
XAU/USD Current price: $3,845.50
- Risk aversion kicked in during at the American opening, after the US misses data releases.
- Hawkish comments from Federal Reserve Lorie Logan temporarily supported the USD.
- XAU/USD could extend its bearish downward correction, but the long-term bullish trend remains intact.

Gold price stood as high as $3,896.60 a troy ounce on Thursday, clinching yet another record high. The bright metal, however, retreated sharply after Wall Street’s opening and flirted with the $3,820 level.
The US Dollar (USD) traded uneventfully throughout the first half of the day, with most major pairs, including XAU/USD, stuck to limited ranges. Things take a turn for the worse after American traders reach their desks. The United States (US) Government shutdown-related concerns finally seem to have kicked in: US indexes turned sharply lower while the USD recovered its safe-haven condition early in the American session. After the initial hours of trading, the market settled, and the XAU/USD pair managed to trim some losses, currently hovering around $3,845.
Hawkish comments from the US Federal Reserve (Fed) Bank of Dallas President Lorie Logan add to the Greenback’s momentum. Logan urged caution on interest rate cuts, citing inflation is running above target and trending higher. Furthermore, Logan noted that the labor market is “only gradually slowing,” and that it remains “fairly balanced,” despite recent discouraging data.
Other than that, the US suspended the release of Initial Jobless Claims and Factory Orders. The Nonfarm Payroll (NFP) report, scheduled for Friday, will not be published, although ISM will release the September Services Purchasing Managers’ Index (PMI). The services business index is expected to print at 51.7, easing from the 52 posted in August.
XAU/USD short-term technical outlook
From a technical point of view, the daily chart shows that the XAU/USD pair slide is a mere correction. The bright metal keeps trading far above all its moving averages, with a bullish 20 Simple Moving Average (SMA) currently at around $3,712. Technical indicators have turned lower but remain above their midlines. In fact, the Relative Strength Index (RSI) edged marginally, yet at 76, still within overbought levels.
The near-term picture shows the correction may continue. In the 4-hour chart, the XAU/USD pair is currently below a flat 20 SMA, which stands in the $3,850 price zone. The 100 and 200 SMAs keep heading north, far below the current level, limiting the bearish potential of the pair. Finally, technical indicators have lost their downward strength and settled above their midlines, also hinting at the absence of relevant selling interest.
Support levels: 3,837.60 3,819.20 3,807.05
Resistance levels: 3,861.60 3,878.45 3,896.00
How could federal government shutdown affect the US Dollar?

The United States’ (US) federal government officially shut down on Wednesday as lawmakers failed to pass funding by the deadline. Following a second round of voting, the Senate rejected House Republicans’ stopgap bill to restore funding.
Why does government shutdown matter?
During the shutdown period, many federal agencies are forced to cease nonessential operations. As a result, more than 700,000 federal workers are facing being furloughed, while essential workers are being asked to work without pay.
According to the Government Employee Fair Treatment Act of 2019, affected employees will receive back pay once the government funding is restored. In a statement published on Tuesday, the Congressional Budget Office (CBO) explained how much these compensations could cost:
“Using information from the agencies’ contingency plans and the Office of Personnel Management (OPM), CBO estimates that under a lapse in discretionary funding for fiscal year 2026 about 750,000 employees could be furloughed each day; the total daily cost of their compensation would be roughly $400 million.”
Another critical impact of the shutdown will be on macroeconomic data releases. The US Department of Labor will not publish the weekly Initial Jobless Claims data on Thursday and the Bureau of Labor Statistics will postpone the release of the official employment report, which features the key Nonfarm Payrolls, Unemployment Rate and wage inflation figures that the Federal Reserve (Fed) looks at when deciding on the next policy step. If the shutdown continues, more economic releases will be delayed, making it difficult for policymakers to assess the inflation outlook and the current state of the economy.
When was the last government shutdown?
The last federal government shutdown, which was also the longest on record, occurred in late 2018 and lasted for 35 days before ending on January 25, 2019.
How is the 2025 government shutdown different?
The 2025 government shutdown comes at a delicate time when investors are already trying to navigate through heightened uncertainty caused by the new US trade regime, the softening labor market conditions and the cloudy inflation outlook. Although data blackouts also happened in past shutdowns, the Fed’s policy was on a steady path and policymakers were not trying to balance inflation and labor market risks.
While past shutdowns raised concerns about the economic outlook, they had little impact on consumer activity. Currently, consumer sentiment is fragile, and a prolonged political dysfunction could further weigh on spending, especially if federal workers continue to lose income.
In the meantime, European rating agency Scope has already issued a warning, stating that the government shutdown could cause a downgrade in the US’s credit rating. “The administration’s increasingly unconventional policy approach has placed pressure on the long-standing checks and balances of the U.S. governance system and are seen as credit negative for the U.S. sovereign rating,” Scope analyst Eiko Sievert explained, as reported by Reuters.
What is next?
Investors will keep a close eye on political developments in the US to assess whether Congress is moving toward a funding deal or the impasse is likely to continue.
In case funding is restored in a relatively short period, in less than 2-3 weeks, the immediate market reaction is likely to help the US Dollar (USD) recover. Conversely, traditional safe-haven assets, such as Gold, the Swiss Franc (CHF) or the Japanese Yen (JPY), are likely to remain in demand if lawmakers fail to find a middle ground in a reasonable time.
In this scenario, comments from Fed officials on how they will approach policy-making if they don’t have access to key data will be crucial. The Fed could take a step back and delay policy decisions until it receives the information the central bank needs, or it could take action in anticipation of a potential negative impact of the shutdown on employment, consumer spending and economic growth.
Markets are fully pricing in a 25 basis-point rate cut in October and see about an 85% probability of one more rate reduction in December, according to the CME FedWatch Tool. The current market positioning suggests that the USD could stage a rebound if the Fed hints at delaying policy easing because of the lack of data.
US Dollar Price This week
The table below shows the percentage change of US Dollar (USD) against listed major currencies this week. US Dollar was the weakest against the Japanese Yen.
| USD | EUR | GBP | JPY | CAD | AUD | NZD | CHF | |
|---|---|---|---|---|---|---|---|---|
| USD | -0.36% | -0.61% | -1.65% | 0.09% | -0.84% | -0.63% | -0.17% | |
| EUR | 0.36% | -0.24% | -1.42% | 0.45% | -0.47% | -0.28% | 0.18% | |
| GBP | 0.61% | 0.24% | -1.09% | 0.70% | -0.29% | -0.03% | 0.43% | |
| JPY | 1.65% | 1.42% | 1.09% | 1.78% | 0.86% | 0.89% | 1.53% | |
| CAD | -0.09% | -0.45% | -0.70% | -1.78% | -0.88% | -0.73% | -0.27% | |
| AUD | 0.84% | 0.47% | 0.29% | -0.86% | 0.88% | 0.20% | 0.66% | |
| NZD | 0.63% | 0.28% | 0.03% | -0.89% | 0.73% | -0.20% | 0.61% | |
| CHF | 0.17% | -0.18% | -0.43% | -1.53% | 0.27% | -0.66% | -0.61% |
The heat map shows percentage changes of major currencies against each other. The base currency is picked from the left column, while the quote currency is picked from the top row. For example, if you pick the US Dollar from the left column and move along the horizontal line to the Japanese Yen, the percentage change displayed in the box will represent USD (base)/JPY (quote).
Pound Sterling rises further against Greenback on weakening US job market
The Pound Sterling (GBP) ticks up to near 1.3500 against the US Dollar (USD) during the European trading session on Thursday. The GBP/USD pair edges higher as the US Dollar (USD) remains on the backfoot, with the United States (US) job market slowing down and the government entering a shutdown.
At the time of writing, the US Dollar Index (DXY), which tracks the Greenback’s value against six major currencies, trades vulnerable near the weekly low around 97.50.
On Wednesday, the US ADP Employment Change report showed that the private sector labor force witnessed a reduction of 32K employees in September. Economists had anticipated that 50K fresh workers would be added in that period. Additionally, the report revealed that 3K employees were laid off in August compared to the fresh addition of 54K workers initially reported.
Signs of a cooling US job market have boosted expectations for more interest rate cuts by the Federal Reserve (Fed) in the remainder of the year. According to the CME FedWatch tool, traders have almost fully priced in that the Fed will cut interest rates by 25 basis points (bps) to the 3.75%-4.00% range in the policy meeting later this month.
Daily digest market movers: Pound Sterling ticks up against its peers
- The Pound Sterling trades slightly higher against its major peers, except the New Zealand Dollar (NZD), on Thursday. However, the outlook of the British currency has become uncertain as Bank of England (BoE) officials have started expressing concerns over cooling United Kingdom (UK) economic prospects.
- On Tuesday, BoE Deputy Governor Sarah Breeden warned that tight monetary policy conditions could push inflation below their 2% target, which has been a major reason forcing officials to maintain a “gradual and careful” monetary easing outlook. “Risks in holding policy too tight for too long, could pull inflation below target,” Breeden said.
- The comments from Breeden signaling a turnaround in inflationary pressures could boost expectations of more interest rate cuts by the BoE in the near term.
- At the August policy meeting, the BoE stated that price pressures would peak around 4% in September.
- In the US region, investors brace for further slowdown in the US job market as the White House has warned that they could announce mass lay-offs in the wake of the government shutdown. “Unfortunately, because the Democrats shut down the government, the president has directed his Cabinet and the Office of Management and Budget is working with agencies across the board to identify where cuts can be made, and we believe that layoffs are imminent,” White House press secretary Karoline Leavitt said, Reuters reported.
- In Thursday’s session, the US Department of Labour is unlikely to post the Initial Jobless Claims data for the week ending September 27, as the government remains shut down at the time of writing.
Technical Analysis: Pound Sterling extends winning streak

The Pound Sterling extends its winning streak against the US Dollar for the fifth trading day on Thursday. The GBP/USD pair strives to extend its upside above the 20-day Exponential Moving Average (EMA), which trades around 1.3485. The return of the Cable above the 20-day EMA will shift the near-term trend to positive.
However, the pair would remain sideways if the 14-day Relative Strength Index (RSI), currently at 50.61, stays in the 40.00-60.00 range.
Looking down, the August 1 low of 1.3140 will act as a key support zone. On the upside, the September 17 high of 1.3726 will act as a key barrier.
Pound Sterling FAQs
The Pound Sterling (GBP) is the oldest currency in the world (886 AD) and the official currency of the United Kingdom. It is the fourth most traded unit for foreign exchange (FX) in the world, accounting for 12% of all transactions, averaging $630 billion a day, according to 2022 data.
Its key trading pairs are GBP/USD, also known as ‘Cable’, which accounts for 11% of FX, GBP/JPY, or the ‘Dragon’ as it is known by traders (3%), and EUR/GBP (2%). The Pound Sterling is issued by the Bank of England (BoE).
The single most important factor influencing the value of the Pound Sterling is monetary policy decided by the Bank of England. The BoE bases its decisions on whether it has achieved its primary goal of “price stability” – a steady inflation rate of around 2%. Its primary tool for achieving this is the adjustment of interest rates.
When inflation is too high, the BoE will try to rein it in by raising interest rates, making it more expensive for people and businesses to access credit. This is generally positive for GBP, as higher interest rates make the UK a more attractive place for global investors to park their money.
When inflation falls too low it is a sign economic growth is slowing. In this scenario, the BoE will consider lowering interest rates to cheapen credit so businesses will borrow more to invest in growth-generating projects.
Data releases gauge the health of the economy and can impact the value of the Pound Sterling. Indicators such as GDP, Manufacturing and Services PMIs, and employment can all influence the direction of the GBP.
A strong economy is good for Sterling. Not only does it attract more foreign investment but it may encourage the BoE to put up interest rates, which will directly strengthen GBP. Otherwise, if economic data is weak, the Pound Sterling is likely to fall.
Another significant data release for the Pound Sterling is the Trade Balance. This indicator measures the difference between what a country earns from its exports and what it spends on imports over a given period.
If a country produces highly sought-after exports, its currency will benefit purely from the extra demand created from foreign buyers seeking to purchase these goods. Therefore, a positive net Trade Balance strengthens a currency and vice versa for a negative balance.
EUR/USD posts modest gains above 1.1700 as Supreme Court allows Fed’s Cook to stay in her post

- EUR/USD trades with mild gains around 1.1735 in Thursday’s Asian session.
- Traders pondered the length of the US government shutdown and its effect on economic data releases.
- Fed Governor Cook to stay in her job until January.
The EUR/USD pair gains ground near 1.1735 during the Asian trading hours on Thursday. The concern over the impact of the US government shutdown undermines the US Dollar (USD) against the Euro (EUR). The US weekly Initial Jobless Claims will not be published in light of the ongoing federal shutdown.
The US federal government shut down on Wednesday after a deadlocked Congress failed to reach a deal on funding. Government agencies warned this would halt the release of the closely watched September employment report, among other things. The US President Donald Trump administration on Wednesday froze $26 billion for Democratic-leaning states, following through on a threat to use the shutdown to target Democratic priorities.
Markets expect further policy easing at the Fed’s October meeting to be a lock, with Fed funds futures implying a 99.4% chance of a 25-basis-point (bps) cut, up from 96.2% a day earlier, according to the CME FedWatch tool.
The US Supreme Court said on Thursday that it would hear arguments in January over Trump’s attempt to remove Fed Governor Lisa Cook, leaving her in the post for now. Easing concerns about the Fed’s independence might help limit the USD’s losses in the near term.
The European Central Bank (ECB) President Christine Lagarde said there are no serious threats to the outlook for euro-area inflation but that officials must remain vigilant. Her remarks indicated that the ECB is in no rush to lower borrowing costs further. This, in turn, supports the shared currency against the USD.
Euro FAQs
The Euro is the currency for the 19 European Union countries that belong to the Eurozone. It is the second most heavily traded currency in the world behind the US Dollar. In 2022, it accounted for 31% of all foreign exchange transactions, with an average daily turnover of over $2.2 trillion a day.
EUR/USD is the most heavily traded currency pair in the world, accounting for an estimated 30% off all transactions, followed by EUR/JPY (4%), EUR/GBP (3%) and EUR/AUD (2%).
The European Central Bank (ECB) in Frankfurt, Germany, is the reserve bank for the Eurozone. The ECB sets interest rates and manages monetary policy.
The ECB’s primary mandate is to maintain price stability, which means either controlling inflation or stimulating growth. Its primary tool is the raising or lowering of interest rates. Relatively high interest rates – or the expectation of higher rates – will usually benefit the Euro and vice versa.
The ECB Governing Council makes monetary policy decisions at meetings held eight times a year. Decisions are made by heads of the Eurozone national banks and six permanent members, including the President of the ECB, Christine Lagarde.
Eurozone inflation data, measured by the Harmonized Index of Consumer Prices (HICP), is an important econometric for the Euro. If inflation rises more than expected, especially if above the ECB’s 2% target, it obliges the ECB to raise interest rates to bring it back under control.
Relatively high interest rates compared to its counterparts will usually benefit the Euro, as it makes the region more attractive as a place for global investors to park their money.
Data releases gauge the health of the economy and can impact on the Euro. Indicators such as GDP, Manufacturing and Services PMIs, employment, and consumer sentiment surveys can all influence the direction of the single currency.
A strong economy is good for the Euro. Not only does it attract more foreign investment but it may encourage the ECB to put up interest rates, which will directly strengthen the Euro. Otherwise, if economic data is weak, the Euro is likely to fall.
Economic data for the four largest economies in the euro area (Germany, France, Italy and Spain) are especially significant, as they account for 75% of the Eurozone’s economy.
Another significant data release for the Euro is the Trade Balance. This indicator measures the difference between what a country earns from its exports and what it spends on imports over a given period.
If a country produces highly sought after exports then its currency will gain in value purely from the extra demand created from foreign buyers seeking to purchase these goods. Therefore, a positive net Trade Balance strengthens a currency and vice versa for a negative balance.
AUD/USD treads water ahead of Australian Trade Balance data
- AUD/USD failed to move too far in either direction on Wednesday.
- Australian Trade Balance figures are due early Thursday.
- US government shutdown has crimped the flow of critical inflation and jobs data.
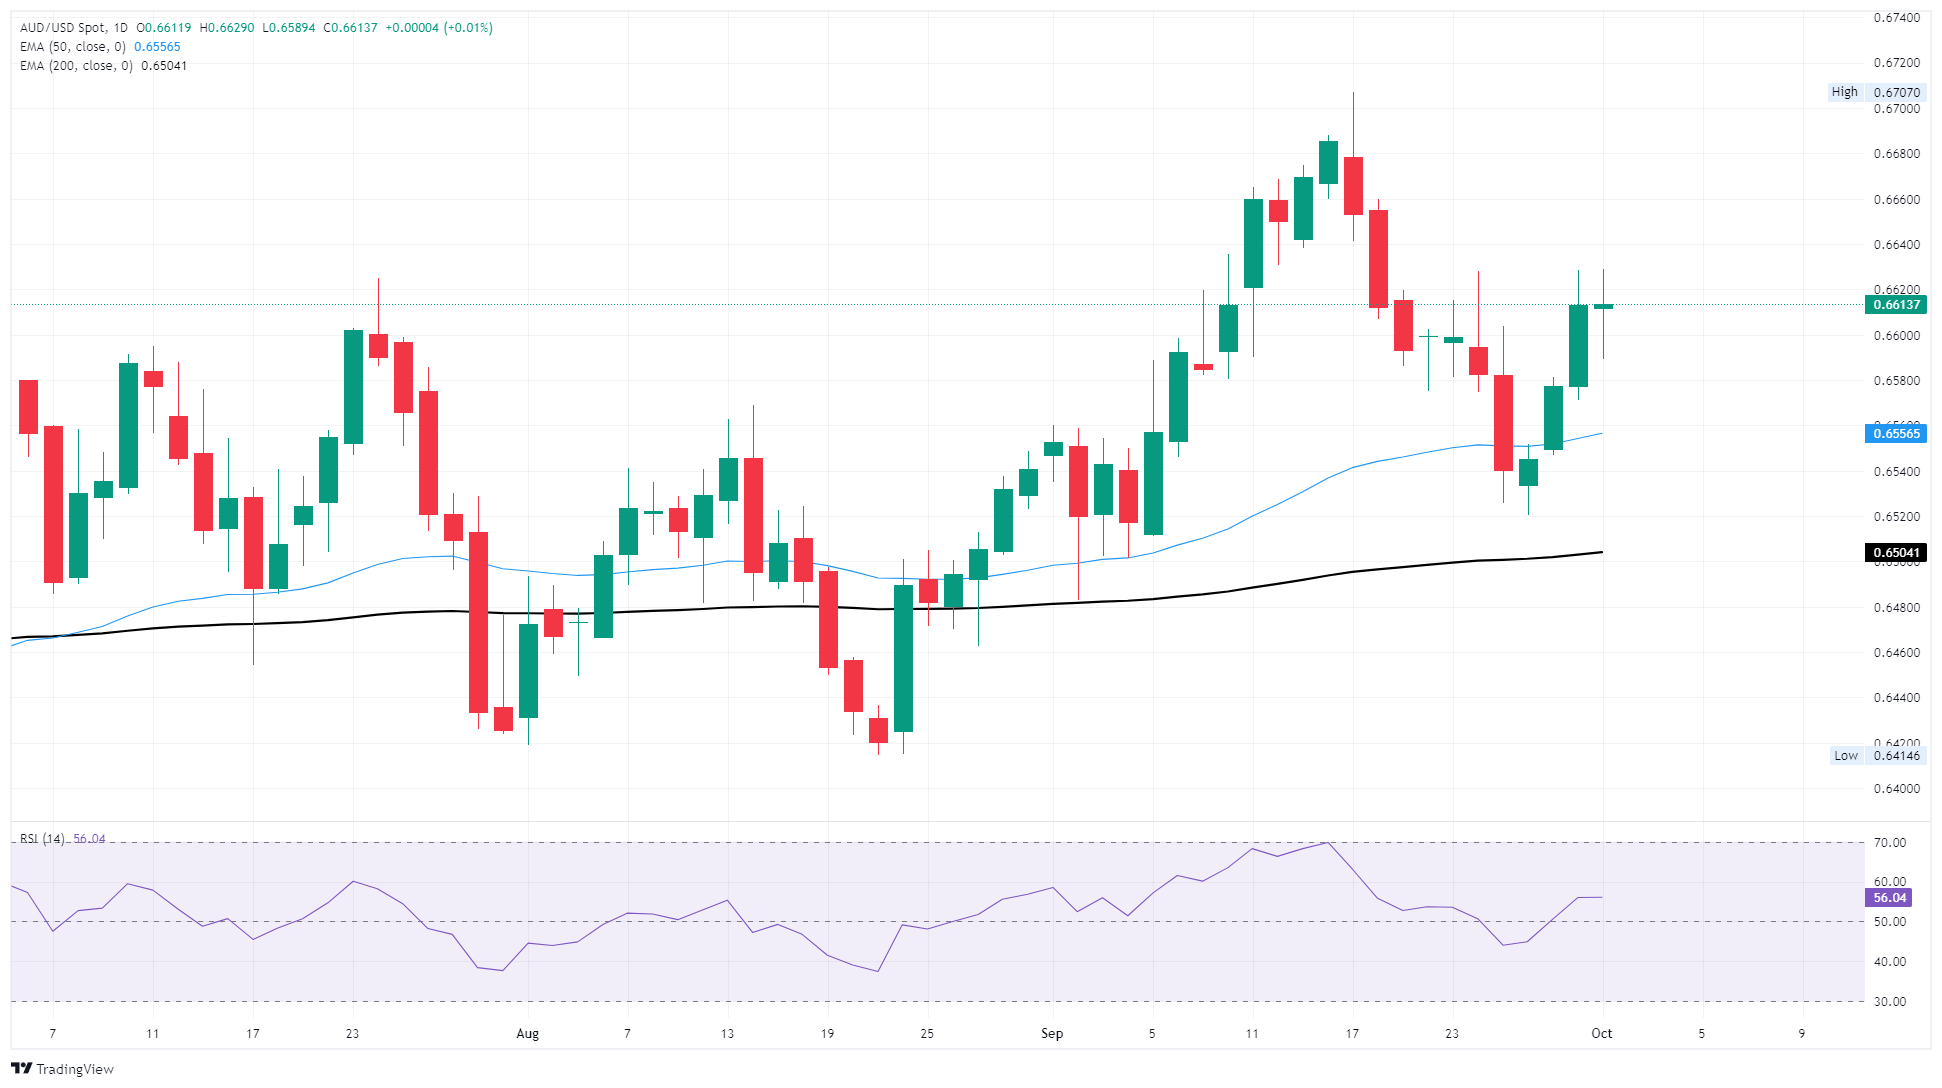
AUD/USD took a breather on Wednesday, churning in place near 0.6620 after a three-day gain streak that saw the US Dollar (USD) rebound from a three-week low of 0.6520 against the Australian Dollar (AUD). The US government has entered it’s fourth federal shutdown during Donald Trump’s two terms as president, and the Bureau of Labor Statistics (BLS) has warned that it will not be able to deliver the latest Nonfarm Payrolls (NFP) jobs data amid a federal shuttering.
Australia’s Trade Balance is expected to have dipped to 6.5 billion in August. Imports declined 1.3% in July, alongside a 3.3% uptick in Exports during the same period, bringing Australia’s July Trade Balance to 7.31 billion MoM. Australian Trade Balance data drops at 01:30 GMT. Australian S&P Purchasing Managers Index (PMI) data will also land on late on Thursday at 23:00 GMT. Australian Services PMIs are expected to hold steady at 52.0 for September.
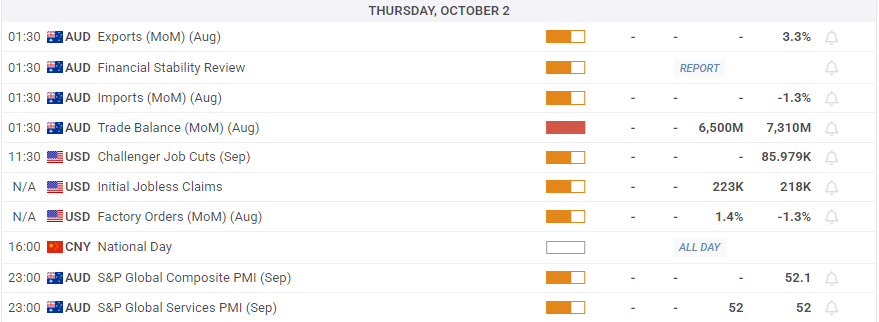
This week’s hotly anticipated US Nonfarm Payrolls (NFP) jobs report is at risk of being delayed or suspended. According to the US Bureau of Labor Statistics (BLS), a government shutdown will result in official dataset releases being suspended until federal operations resume.
ADP Employment Change figures came in much lower than the street expected, showing a contraction of -32K in September versus the expected 50K. August’s initial print of 54K was also revised sharply lower to -3K. ADP jobs figures suffer from constant revisions, but the figure has generally missed expectations for all but three of the monthly figures published since the start of 2025.
With the NFP print in jeopardy, investors are leaning further on private data such as ADP. According to the CME’s FedWatch Tool, rate trader bets of another quarter-point interest rate cut on October 29 surged to 99% post-ADP on Wednesday. Rate markets are also pricing in nearly 90% odds of a third-straight rate trim on December 10, and a further 93% that the Fed will deliver a fourth interest rate cut by next April at the absolute latest.
AUD/USD daily chart
Australian Dollar FAQs
One of the most significant factors for the Australian Dollar (AUD) is the level of interest rates set by the Reserve Bank of Australia (RBA). Because Australia is a resource-rich country another key driver is the price of its biggest export, Iron Ore. The health of the Chinese economy, its largest trading partner, is a factor, as well as inflation in Australia, its growth rate and Trade Balance. Market sentiment – whether investors are taking on more risky assets (risk-on) or seeking safe-havens (risk-off) – is also a factor, with risk-on positive for AUD.
The Reserve Bank of Australia (RBA) influences the Australian Dollar (AUD) by setting the level of interest rates that Australian banks can lend to each other. This influences the level of interest rates in the economy as a whole. The main goal of the RBA is to maintain a stable inflation rate of 2-3% by adjusting interest rates up or down. Relatively high interest rates compared to other major central banks support the AUD, and the opposite for relatively low. The RBA can also use quantitative easing and tightening to influence credit conditions, with the former AUD-negative and the latter AUD-positive.
China is Australia’s largest trading partner so the health of the Chinese economy is a major influence on the value of the Australian Dollar (AUD). When the Chinese economy is doing well it purchases more raw materials, goods and services from Australia, lifting demand for the AUD, and pushing up its value. The opposite is the case when the Chinese economy is not growing as fast as expected. Positive or negative surprises in Chinese growth data, therefore, often have a direct impact on the Australian Dollar and its pairs.
Iron Ore is Australia’s largest export, accounting for $118 billion a year according to data from 2021, with China as its primary destination. The price of Iron Ore, therefore, can be a driver of the Australian Dollar. Generally, if the price of Iron Ore rises, AUD also goes up, as aggregate demand for the currency increases. The opposite is the case if the price of Iron Ore falls. Higher Iron Ore prices also tend to result in a greater likelihood of a positive Trade Balance for Australia, which is also positive of the AUD.
The Trade Balance, which is the difference between what a country earns from its exports versus what it pays for its imports, is another factor that can influence the value of the Australian Dollar. If Australia produces highly sought after exports, then its currency will gain in value purely from the surplus demand created from foreign buyers seeking to purchase its exports versus what it spends to purchase imports. Therefore, a positive net Trade Balance strengthens the AUD, with the opposite effect if the Trade Balance is negative.
FX Today: The US government shutdown and its implications steal the headlines

Further weakness saw the US Dollar (USD) recede to new multi-day lows as investors evaluated the US federal government shutdown, which in turn reignited uncertainty in the global markets ahead of the key US data releases.
Here’s what to watch on Thursday, October 2:
The US Dollar Index (DXY) lost ground for the fourth straight day, revisiting the 97.50 zone amid steady uncertainty surrounding the US government shutdown. The usual weekly Initial Jobless Claims won’t be released in light of the ongoing federal shutdown, while uncertainty remains in place around the publication of Challenger Job Cuts and Factory Orders. On the Fed side, L. Logan is due to speak.
EUR/USD briefly rose to multi-day highs near 1.1780 before surrendering much of those gains on a late recovery in the Greenback. The Unemployment Rate in the euro area is due ahead of speeches by the ECB’s Montagner and De Guindos.
GBP/USD advanced sharply, managing to surpass the 1.3500 hurdle to hit fresh five-day peaks. The BoE will publish its Decision Market Panel (DMP) survey.
Extra appreciation of the Japanese yen dragged USD/JPY to new two-week troughs near 146.60. Foreign Bond Investment figures and the Consumer Confidence gauge are next on tap on the domestic calendar.
AUD/USD extended its move higher, rising marginally beyond the 0.6600 barrier. The Balance of Trade results are due, along with Household Spending prints and the RBA’s Financial Stability Report (FSR).
Prices of WTI retreated further and reached new five-month lows around $61.40 per barrel on Wednesday, as market participants kept evaluating the OPEC+ plans to hike oil output while demand concerns also added to the widespread decline of the commodity.
Gold prices advanced to the boundaries of the $3,900 mark per troy ounce, hitting an all-time high on the back of further weakness in the greenback, declining US yields and swelling uncertainty after the US government shutdown. Silver prices followed suit, reaching new highs near the $48.00 mark per ounce for the first time since May 2011.
GBP/USD surges to one-week high as weak ADP data and US government shutdown dent Dollar

- GBP/USD climbs to a one-week high, its strongest since September 24, as the US Dollar weakens broadly.
- The ADP report showed US private-sector jobs fell by 32K in September.
- S&P Global Manufacturing PMI held steady at 52, while ISM Manufacturing PMI rose modestly to 49.1 but remained in contraction
The British Pound (GBP) advances sharply against the US Dollar (USD) on Wednesday, with GBP/USD climbing to a one-week high, reaching its strongest level since September 24, as the Greenback remains under broad pressure amid a weaker-than-expected ADP Employment Change report, the ongoing United States (US) government shutdown, and mounting bets on further Federal Reserve (Fed) interest rate cuts.
At the time of writing, GBP/USD is trading around 1.3512, extending its winning streak for a fourth day with a gain of 0.50%. Meanwhile, the US Dollar Index (DXY), which measures the Greenback’s performance against a basket of six major currencies, is hovering near 97.50, close to a one-week trough.
Data released by payroll processor ADP on Wednesday showed private sector employment declined by 32,000 jobs in September, defying expectations for a 50,000 gain. Adding to the downside surprise, August’s figure was revised sharply to a 3,000 loss from the previously reported 54,000 gain.
Commenting on the release, Nela Richardson, Chief Economist at ADP, said, “Despite the strong economic growth we saw in the second quarter, this month’s release further validates what we’ve been seeing in the labor market, that US employers have been cautious with hiring”.
The weak ADP data came as the US government shutdown cast doubt over Friday’s Nonfarm Payrolls (NFP) release, boosting the report’s significance for markets.
Meanwhile, the S&P Global US Manufacturing Purchasing Managers Index (PMI) for September held steady at 52, matching both forecasts and the previous month’s reading, signaling that the sector remains in modest expansion. However, the more closely watched ISM Manufacturing PMI rose only slightly to 49.1, just above expectations of 49 and up from August’s 48.7.
Pound Sterling Price Today
The table below shows the percentage change of British Pound (GBP) against listed major currencies today. British Pound was the strongest against the Canadian Dollar.
| USD | EUR | GBP | JPY | CAD | AUD | NZD | CHF | |
|---|---|---|---|---|---|---|---|---|
| USD | -0.15% | -0.53% | -0.82% | 0.07% | -0.05% | -0.55% | 0.03% | |
| EUR | 0.15% | -0.36% | -0.69% | 0.21% | 0.12% | -0.37% | 0.17% | |
| GBP | 0.53% | 0.36% | -0.28% | 0.58% | 0.49% | -0.00% | 0.55% | |
| JPY | 0.82% | 0.69% | 0.28% | 0.91% | 0.76% | 0.50% | 0.94% | |
| CAD | -0.07% | -0.21% | -0.58% | -0.91% | -0.11% | -0.60% | -0.04% | |
| AUD | 0.05% | -0.12% | -0.49% | -0.76% | 0.11% | -0.49% | 0.06% | |
| NZD | 0.55% | 0.37% | 0.00% | -0.50% | 0.60% | 0.49% | 0.56% | |
| CHF | -0.03% | -0.17% | -0.55% | -0.94% | 0.04% | -0.06% | -0.56% |
The heat map shows percentage changes of major currencies against each other. The base currency is picked from the left column, while the quote currency is picked from the top row. For example, if you pick the British Pound from the left column and move along the horizontal line to the US Dollar, the percentage change displayed in the box will represent GBP (base)/USD (quote).