Gold price gained some positive traction on the first day of a new week and reversed a part of Friday’s post-NFP slump to the $2,287-2,286 area, or over a one-month low. The uptick, however, remains capped in the wake of a bullish US Dollar, which tends to undermine demand for the USD-denominated commodity.
Ethereum could see a bullish reversal following its Q1 earnings surpassing those of Robinhood, Etsy and Reddit
- Ethereum ecosystem generated more revenue in Q1 than Etsy, Robinhood or Reddit.
- Issuers plan to market Ethereum as a ‘producing tech stock’ and the ‘ultimate app store’.
- Ethereum could see a bullish reversal in the coming days.
Ethereum’s (ETH) price is down 1% on Monday as its exchange supply hit record lows following growth in global ETH ETFs’ inflows. Meanwhile, issuers plan to market Ethereum as the ‘ultimate app store’.
Daily digest market movers: Low exchange supply, high ETF inflows, ‘ultimate app store’
Ethereum has recorded several amazing feats in the past few days despite its recent price decline. Here are the latest ETH market movers:
- According to Glassnode data, only 10.5% of the total ETH supply was left on exchanges as of June 8. Coupled with the declining exchange supply, data from IntoTheBlock shows that large ETH holders (addresses with >10K ETH) recorded a net inflow of 267K ETH on Thursday, the highest daily accumulation since March. This shows that investors are becoming increasingly bullish on ETH, potentially because of the expectation of spot ETH ETFs.
Also read: Ethereum’s price suffers slight decline amid Hong Kong’s plan to allow staking in ETH ETFs
- Recent Bitwise research revealed that crypto protocols on Ethereum generated more revenue than Robinhood, Reddit, Yelp and Etsy in Q1 2024. “These applications are a testament to the resilience, creativity, and vision of the global crypto industry,” said Bitwise.
- Global Ethereum ETFs witnessed about $69 million in inflows — their highest inflow since March. Inflows across ETH ETFs will likely continue to rise as investors expect spot ETH ETFs to begin trading in the US in the coming weeks.
- High inflows follow predictions from Bitfinex’s Head of Derivatives, Jag Kooner, that spot Ethereum ETFs could attract around 10-20% of flows witnessed in spot Bitcoin ETFs.
He built his predictions around the historical flows seen in Gold ETFs after they launched in 2004 and how it paved the way for subsequent flows in Silver ETF launches in 2006. Bloomberg analyst Eric Balchunas has previously shared a similar analysis comparing ETFs of Bitcoin to those of Gold and Ethereum to Silver.
Also read: Ethereum ecosystem active users spike 55% in Q1, 2x ETH ETF records impressive volume
- Meanwhile, executives of different issuers, including Van Eck, 21Shares and Franklin Templeton, deliberated on the potential demand for Ethereum ETFs in a recent panel session moderated by Eric Balchunas. According to Balchunas, the executives plan to “position it (Ethereum) as being like a ‘producing tech stock’, ‘ultimate app store’, very different pitch than BTC.”
ETH technical analysis: Ethereum to see a potential bullish reversal
Ethereum is trading around $3,661 on Monday after the US Nonfarm Payrolls (NFP) data on Friday cooled signs of any potential breakout above the $3,900 resistance. The NFP news briefly sent ETH below the $3,618 support before a slight recovery. ETH liquidations sit at $9.47 million, with the majority coming from long liquidations worth $6.99 million.
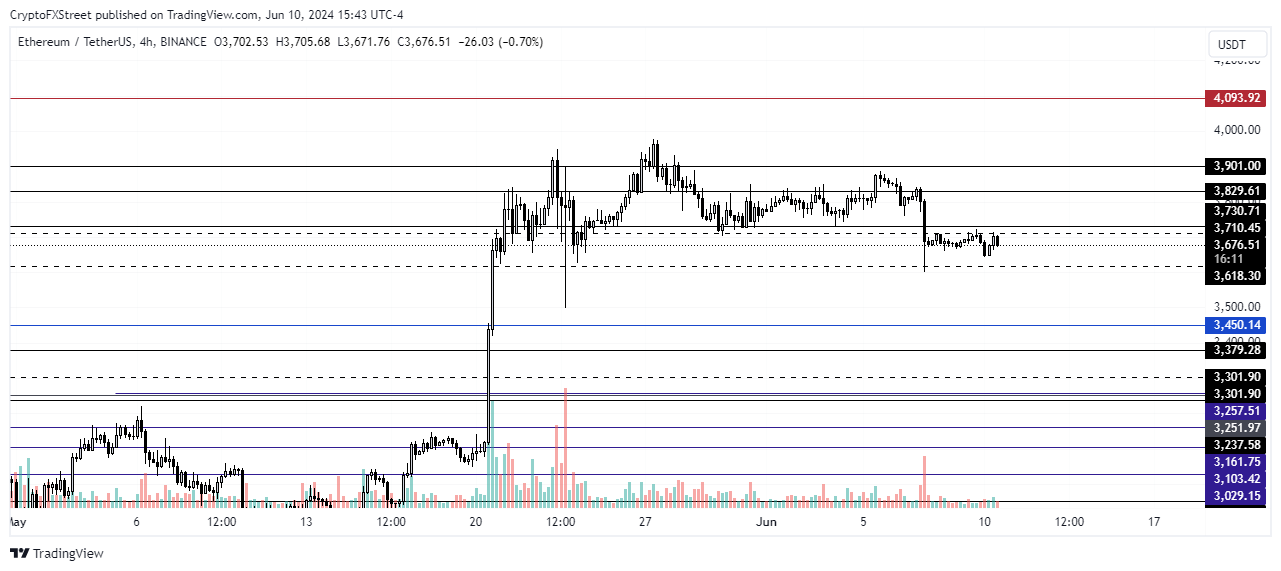
ETH/USDT 4-hour chart
According to data from Laevitas.ch, the ETH futures premium dropped from around the 15% mark to 13% on Monday — its lowest level since the SEC’s position response toward spot ETH ETFs — signaling dwindling investor interest. The futures premium stays around 5% to 10% in neutral market conditions.
Read more: Ethereum open interest surges by 50%, SEC Chair says ETH ETF launch will take more time
ETH Open Interest (OI) also declined from $16.97 billion on June 6 to $16.37 billion on Monday, a $600 million decrease. However, considering prices declined faster than OI, investors may still be confident of a bullish reversal, indicating the bearish move could be temporary.
As a result, ETH will likely sustain a horizontal move slightly tilted toward an upward movement. The $3,900 resistance is the key price level for ETH to overcome before any significant breakout. A sustained move below the $3,618 support will invalidate the bullish thesis.
Bitcoin, altcoins, stablecoins FAQs
Bitcoin is the largest cryptocurrency by market capitalization, a virtual currency designed to serve as money. This form of payment cannot be controlled by any one person, group, or entity, which eliminates the need for third-party participation during financial transactions.
Altcoins are any cryptocurrency apart from Bitcoin, but some also regard Ethereum as a non-altcoin because it is from these two cryptocurrencies that forking happens. If this is true, then Litecoin is the first altcoin, forked from the Bitcoin protocol and, therefore, an “improved” version of it.
Stablecoins are cryptocurrencies designed to have a stable price, with their value backed by a reserve of the asset it represents. To achieve this, the value of any one stablecoin is pegged to a commodity or financial instrument, such as the US Dollar (USD), with its supply regulated by an algorithm or demand. The main goal of stablecoins is to provide an on/off-ramp for investors willing to trade and invest in cryptocurrencies. Stablecoins also allow investors to store value since cryptocurrencies, in general, are subject to volatility.
Bitcoin dominance is the ratio of Bitcoin’s market capitalization to the total market capitalization of all cryptocurrencies combined. It provides a clear picture of Bitcoin’s interest among investors. A high BTC dominance typically happens before and during a bull run, in which investors resort to investing in relatively stable and high market capitalization cryptocurrency like Bitcoin. A drop in BTC dominance usually means that investors are moving their capital and/or profits to altcoins in a quest for higher returns, which usually triggers an explosion of altcoin rallies.
Source
EUR/JPY Price Analysis: Support holds strong at 168.00 and clears losses
- The daily RSI remains settled in the negative territory, with the daily MACD displaying flat red bars reflecting stable bearish momentum.
- The pair finds steady support near 168.00, stabilizing at 168.80 beyond the session’s low at 168.15.
- The prevalent bullish trend is sustained by the fortitude of the 100- and 200-day SMAs.
On Monday, the EUR/JPY pair experienced an initial fall to 168.15 before stabilizing at 168.80, which seems to affirm the fortification of the support level around 168.00. Although an effort to recover the short-term 20-day SMA is needed to avert further descent, the 168.00 barrier would likely act as a fallback for the bulls if market pressure intensifies.
The Relative Strength Index (RSI) on the daily chart now reads 47, preserving its position in the negative area, which implies a slightly bearish market disposition. The daily Moving Average Convergence Divergence (MACD) retains flat red bars, marking a steady bearish momentum. This could perhaps signal a consolidation phase prior to any substantial shifts.
EUR/JPY daily chart
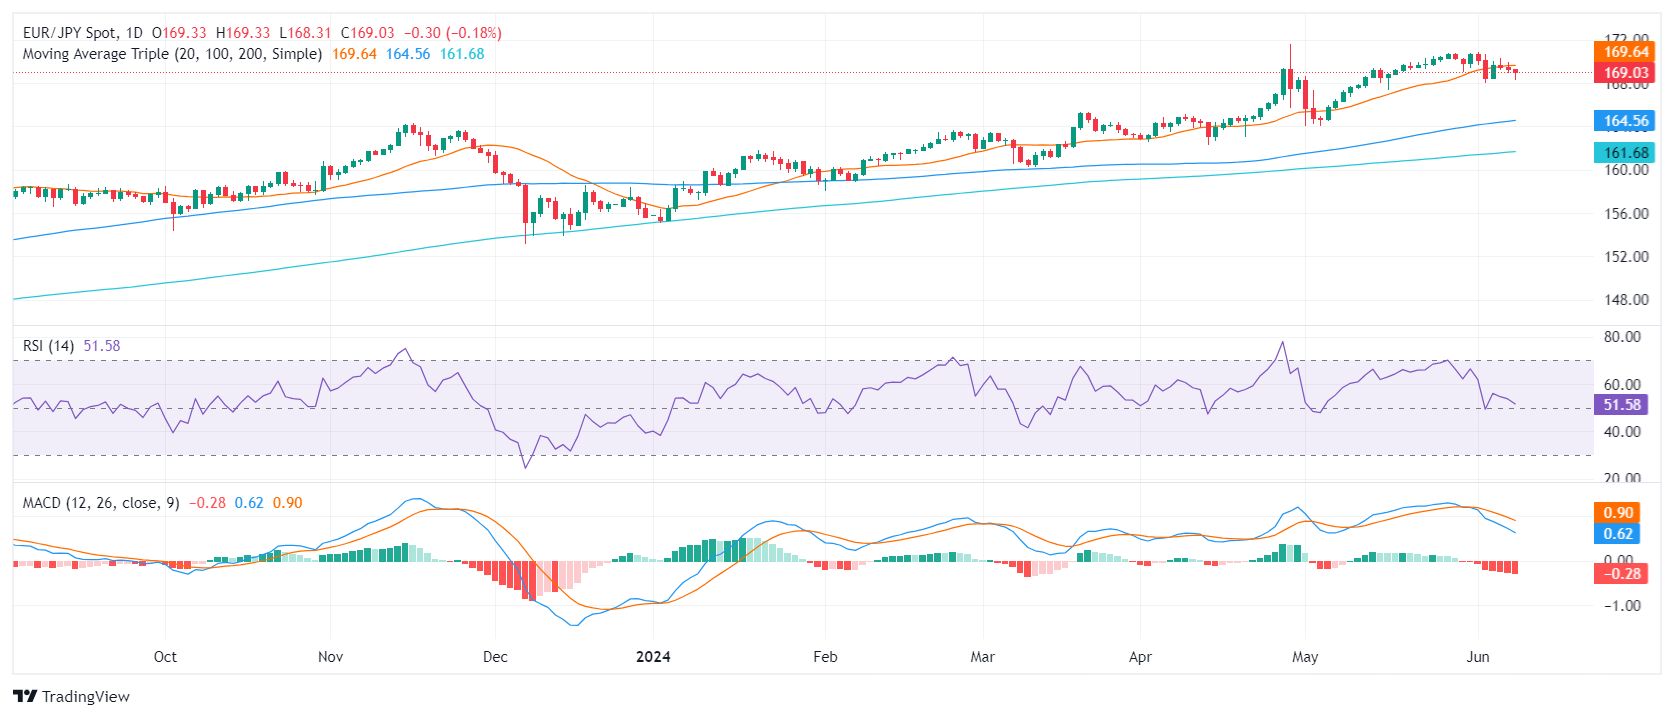
On the other hand, the broader bullish tendency in the EUR/JPY persists. The robust support rendered by the 100- and 200-day Simple Moving Averages (SMAs), located around 164.00 and 161.00 correspondingly, remains a strong fortification against extensive bearish movements. Hence, despite the mild bearish undertones of recent sessions, these fluctuations are possibly corrective rather than indicative of any sweeping alterations in the prevailing trend.
GBP/USD Price Analysis: Consolidates around 1.2700 after hitting 7-day low
- GBP/USD slightly down for the second session in a row.
- Technicals indicate losing buyer momentum as RSI approaches the 50-midline.
- A drop below 1.2700 could push GBP/USD towards key moving averages near 1.2686 and potentially lower.
- Upside seen above 1.2750, with buyers eyeing 1.2800.
The British Pound extended its losses for the second consecutive trading session against the US Dollar, following last Friday’s stellar jobs report from the US, which triggered the likelihood of a less dovish Federal Reserve. That and uncertainty on the upcoming Fed’s meeting would keep Cable pressured. Therefore, the GBP/USD trades at 1.2713, down 0.01%
GBP/USD Price Analysis: Technical outlook
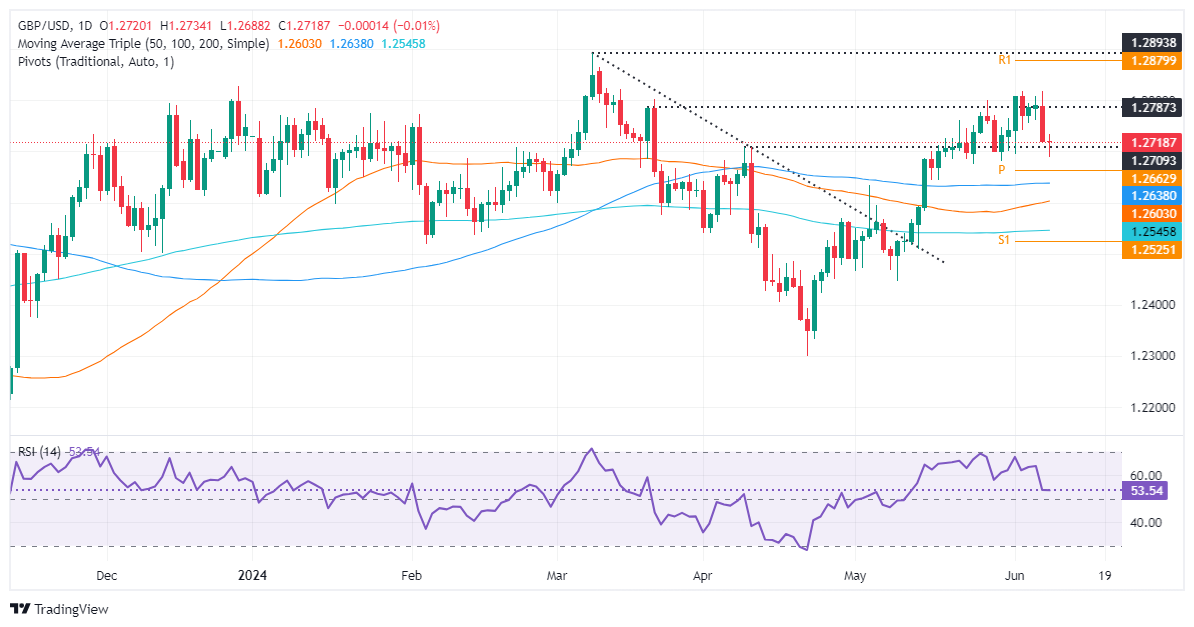
After struggling at around 1.2800 with key technical resistance levels, the GBP/USD tumbled below 1.2700 and printed a new seven-day low of 1.2687 before recovering some ground.
Although momentum still favors buyers, the Relative Strength Index (RSI) dropped sharply towards crossing the 50-midline, hinting that buyers are losing momentum. Nevertheless, Monday’s price action seems to form a ‘dragonfly doji,’ a bullish candlestick.
If GBP/USD reclaims 1.2750, it will be possible to challenge the June 7 high of 1.2813. Once cleared, the next resistance line will be 1.2850, followed by 1.2900.
Conversely, if GBP/USD prints a daily close below 1.2700, that would sponsor a leg-down toward the confluence of the 100-day moving average (DMA) at around 1.2686, ahead of the 50 and 200-DMAs each at 1.2602 and 1.2543, respectively.
GBP/USD Price Action – Daily Chart
Pound Sterling declines below 1.2700 as Fed rate-cut hopes wane, UK/US data in focus
- The Pound Sterling drops to 1.2700 as delayed Fed interest rate-cut prospects dampen market sentiment.
- The strong US NFP report for May hit market speculation for Fed rate cuts.
- This week, investors will focus on UK Employment, US CPI, and the Fed’s policy decision.
The Pound Sterling (GBP) seems vulnerable against the US Dollar (USD) slightly below the round-level support of 1.2700 in Monday’s London session. The GBP/USD pair weakens as the market sentiment turns downbeat after investors decreased their bets that leaned towards the Federal Reserve (Fed) to start reducing interest rates from the September meeting.
The CME FedWatch tool shows that 30-Day Fed Funds futures pricing data suggest a 47% chance that interest rate will be lower than the current level in September, significantly down from the 59.6% recorded a week ago.
Investors were hopeful that the Fed would commence lowering its key borrowing rates from September in the first four days of the last week. Their confidence was driven by weaker-than-expected United States (US) JOLTS Job Openings for April and ADP Employmnet Change data for May. However, robust labor demand and upbeat wage growth indicated by the US Nonfarm Payrolls (NFP) report for May published on Friday spooked their confidence. Strong labor market conditions suggest a stubborn inflation outlook, which would force Fed policymakers to prefer maintaining the current interest rate framework for a longer period.
Daily digest market movers: Pound Sterling falls further ahead of key events
- The Pound Sterling exhibits weakness against the US Dollar as market speculation about the Fed’s interest rate path suggests that there will be only one rate cut for the entire year, in the November or December meeting. Expectations for the number of Fed rate cuts have declined to one from two after the US NFP report remained stronger than expected. The US Dollar Index (DXY), which tracks the Greenback’s value against six major currencies, rises further to 105.30.
- The next move in the US Dollar and the Pound Sterling will be guided by the US Consumer Price Index (CPI) data for May and the Fed’s monetary policy decision on Wednesday, and the United Kingdom (UK) Employment data for the February-April period on Tuesday.
- US annual core inflation, which strips off volatile food and energy prices, is estimated to have decelerated to 3.5% from the prior release of 3.6%, with headline figures growing steadily by 3.4%. Monthly headline CPI is expected to have risen at a slower pace of 0.2% from April’s reading of 0.3%, with core inflation maintaining the current pace of 0.3%.
- Meanwhile, the Fed is widely anticipated to hold interest rates steady in the range of 5.25%-5.50% for the seventh time in a row. In the press conference after the Fed’s policy decision, Fed Chair Jerome Powell may argue to keep interest rates higher until they get confidence that inflation will sustainably decline to the desired target rate of 2%.
- According to the consensus, the UK Employmnet report will show that the Unemployment Rate remained steady at 4.3%. Investors will also focus on Average Earnings, a measure of wage inflation that dictates consumer spending and is estimated to have grown steadily compared to the previous period. Bank of England (BoE) policymakers will keenly focus on the wage inflation measure, as it is a major driver of service inflation that has remained a key barrier for price pressures to return to the desired rate of 2%.
- On the political front, uncertainty over the general election in early July is expected to heat up further as the UK’s opposition labor leader, Keri Starmer, announced that their party will unveil their election manifesto on Thursday. Exit polls have indicated that the Labor Party is ahead of the Conservatives.
Technical Analysis: Pound Sterling declines toward 61.8% Fibonacci retracement support
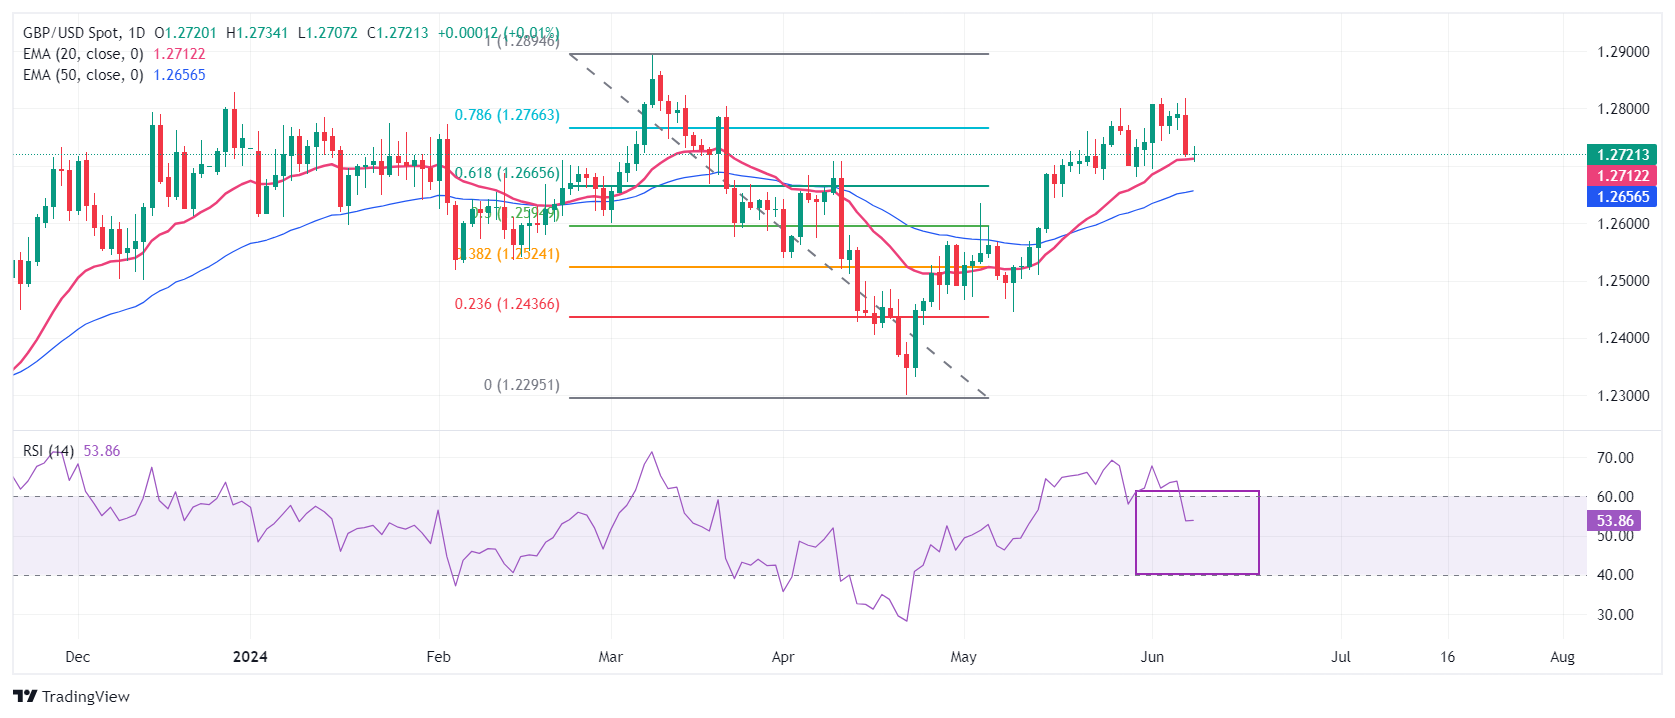
The Pound Sterling hovers below 1.2700 against the US Dollar after falling sharply from the round-level resistance of 1.2800. The GBP/USD pair falls but still holds the 61.8% Fibonacci retracement support (plotted from the March 8 high of 1.2900 to the April 22 low at 1.2300) at 1.2665.
The Cable retraces to the 20-day Exponential Moving Average (EMA), which trades near 1.2710. The 50-day EMA is still sloping higher, suggesting that the overall trend remains bullish.
The 14-period Relative Strength Index (RSI) has shifted into the 40.00-60.00 range, suggesting that the upside momentum has faded. However, the bullish bias remains intact.
Economic Indicator
Fed Interest Rate Decision
The Federal Reserve (Fed) deliberates on monetary policy and makes a decision on interest rates at eight pre-scheduled meetings per year. It has two mandates: to keep inflation at 2%, and to maintain full employment. Its main tool for achieving this is by setting interest rates – both at which it lends to banks and banks lend to each other. If it decides to hike rates, the US Dollar (USD) tends to strengthen as it attracts more foreign capital inflows. If it cuts rates, it tends to weaken the USD as capital drains out to countries offering higher returns. If rates are left unchanged, attention turns to the tone of the Federal Open Market Committee (FOMC) statement, and whether it is hawkish (expectant of higher future interest rates), or dovish (expectant of lower future rates).
Next release: Wed Jun 12, 2024 18:00
Frequency: Irregular
Consensus: 5.5%
Previous: 5.5%
Source: Federal Reserve
FX option expiries for June 10 NY cut

FX option expiries for June 10 NY cut at 10:00 Eastern Time, via DTCC, can be found below
– EUR/USD: EUR amounts
- 1.0685 1.1b
- 1.0760 570m
- 1.0775 1.1b
- 1.0800 961m
- 1.0850 834m
- 1.0875 580m
- 1.0900 1.7b
– USD/JPY: USD amounts
- 155.95 540m
- 156.15 405m
– USD/CHF: USD amounts
- 0.8900 529m
- 0.9000 600m
- 0.9080 583m
– AUD/USD: AUD amounts
- 0.6590 728m
- 0.6600 904m
– USD/CAD: USD amounts
- 1.3625 720m
- 1.3680 639m
- 1.3750 610m
- 1.3880 695m
WTI rebounds to near $75.50 due to expectations of Fed rate cuts

- WTI price gains ground due to speculation of a Fed rate cut in September.
- Crude Oil prices may struggle as a strong US jobs report would bolster a hawkish stance from the Fed.
- Concerns about a supply surplus have grown as OPEC+ decided to reverse voluntary cuts gradually.
West Texas Intermediate (WTI) Oil price recovers the previous session’s losses, trading around $75.30 per barrel during Monday’s Asian trading hours. This increase in crude Oil prices is largely due to speculation that the US Federal Reserve (Fed) may cut interest rates in September.
However, better-than-expected US employment data released on Friday has caused traders to delay their expectations of a Fed rate cut. According to the US Bureau of Labor Statistics (BLS), May’s US Nonfarm Payrolls (NFP) increased by 272,000, up from 165,000 in April. The stronger employment data has attracted buyers to the US Dollar (USD), which has put downward pressure on Oil prices by making the commodity more expensive for buyer countries using other currencies.
Crude Oil prices may face pressure if borrowing costs remain high for an extended period, which would negatively impact Oil demand. A strong US jobs report would bolster a hawkish stance from the Federal Reserve. The CME FedWatch Tool indicates that the likelihood of a Fed rate cut in September by at least 25 basis points has decreased to nearly 48.0%, down from 54.8% a week earlier.
Additionally, concerns over a potential supply surplus of Oil have increased as the Organization of the Petroleum Exporting Countries and its allies (OPEC+) decided to gradually unwind voluntary cuts from eight member countries starting in October. By December, more than 500,000 barrels per day (bpd) are expected to re-enter the market, with a total of 1.8 million bpd returning by June 2025.
Cardano price consolidation likely to trigger bearish breakout
- Cardano price is consolidating inside a descending triangle setup.
- A breakout from this pattern could trigger a 17% crash to $0.351.
- A decisive daily candlestick close above $0.492 will invalidate the bearish thesis.
Cardano (ADA) price consolidation could trigger a breakout soon, knocking ADA down by double digits to key support levels.
Also read: Cardano price flashes buy signal, but will ADA bulls cooperate?
Cardano price edging closer to a crash
Cardano price has crashed 51% from its 2024 high of $0.810 and set up a low at $0.396 on April 13. Since then, ADA has been consolidating above the $0.426 support level and setting up three lower highs. This technical formation is termed an ascending triangle and forecasts a 17% crash to $0.351, obtained by measuring the distance between the first swing high and swing low to the breakout point at $0.426.
The Relative Strength Index’s (RSI) failed attempt at clearing the mean level of 50 is a supporting factor to the bearish outlook explained above. Hence, it is highly likely that Cardano price will retain the bearish momentum from the 51% crash and continue its descent. However,, ADA might pause around $0.392 before reaching its theoretical target of $0.351.
Read more: Cardano Price Forecast: ADA’s recent breakout could trigger 15% rally
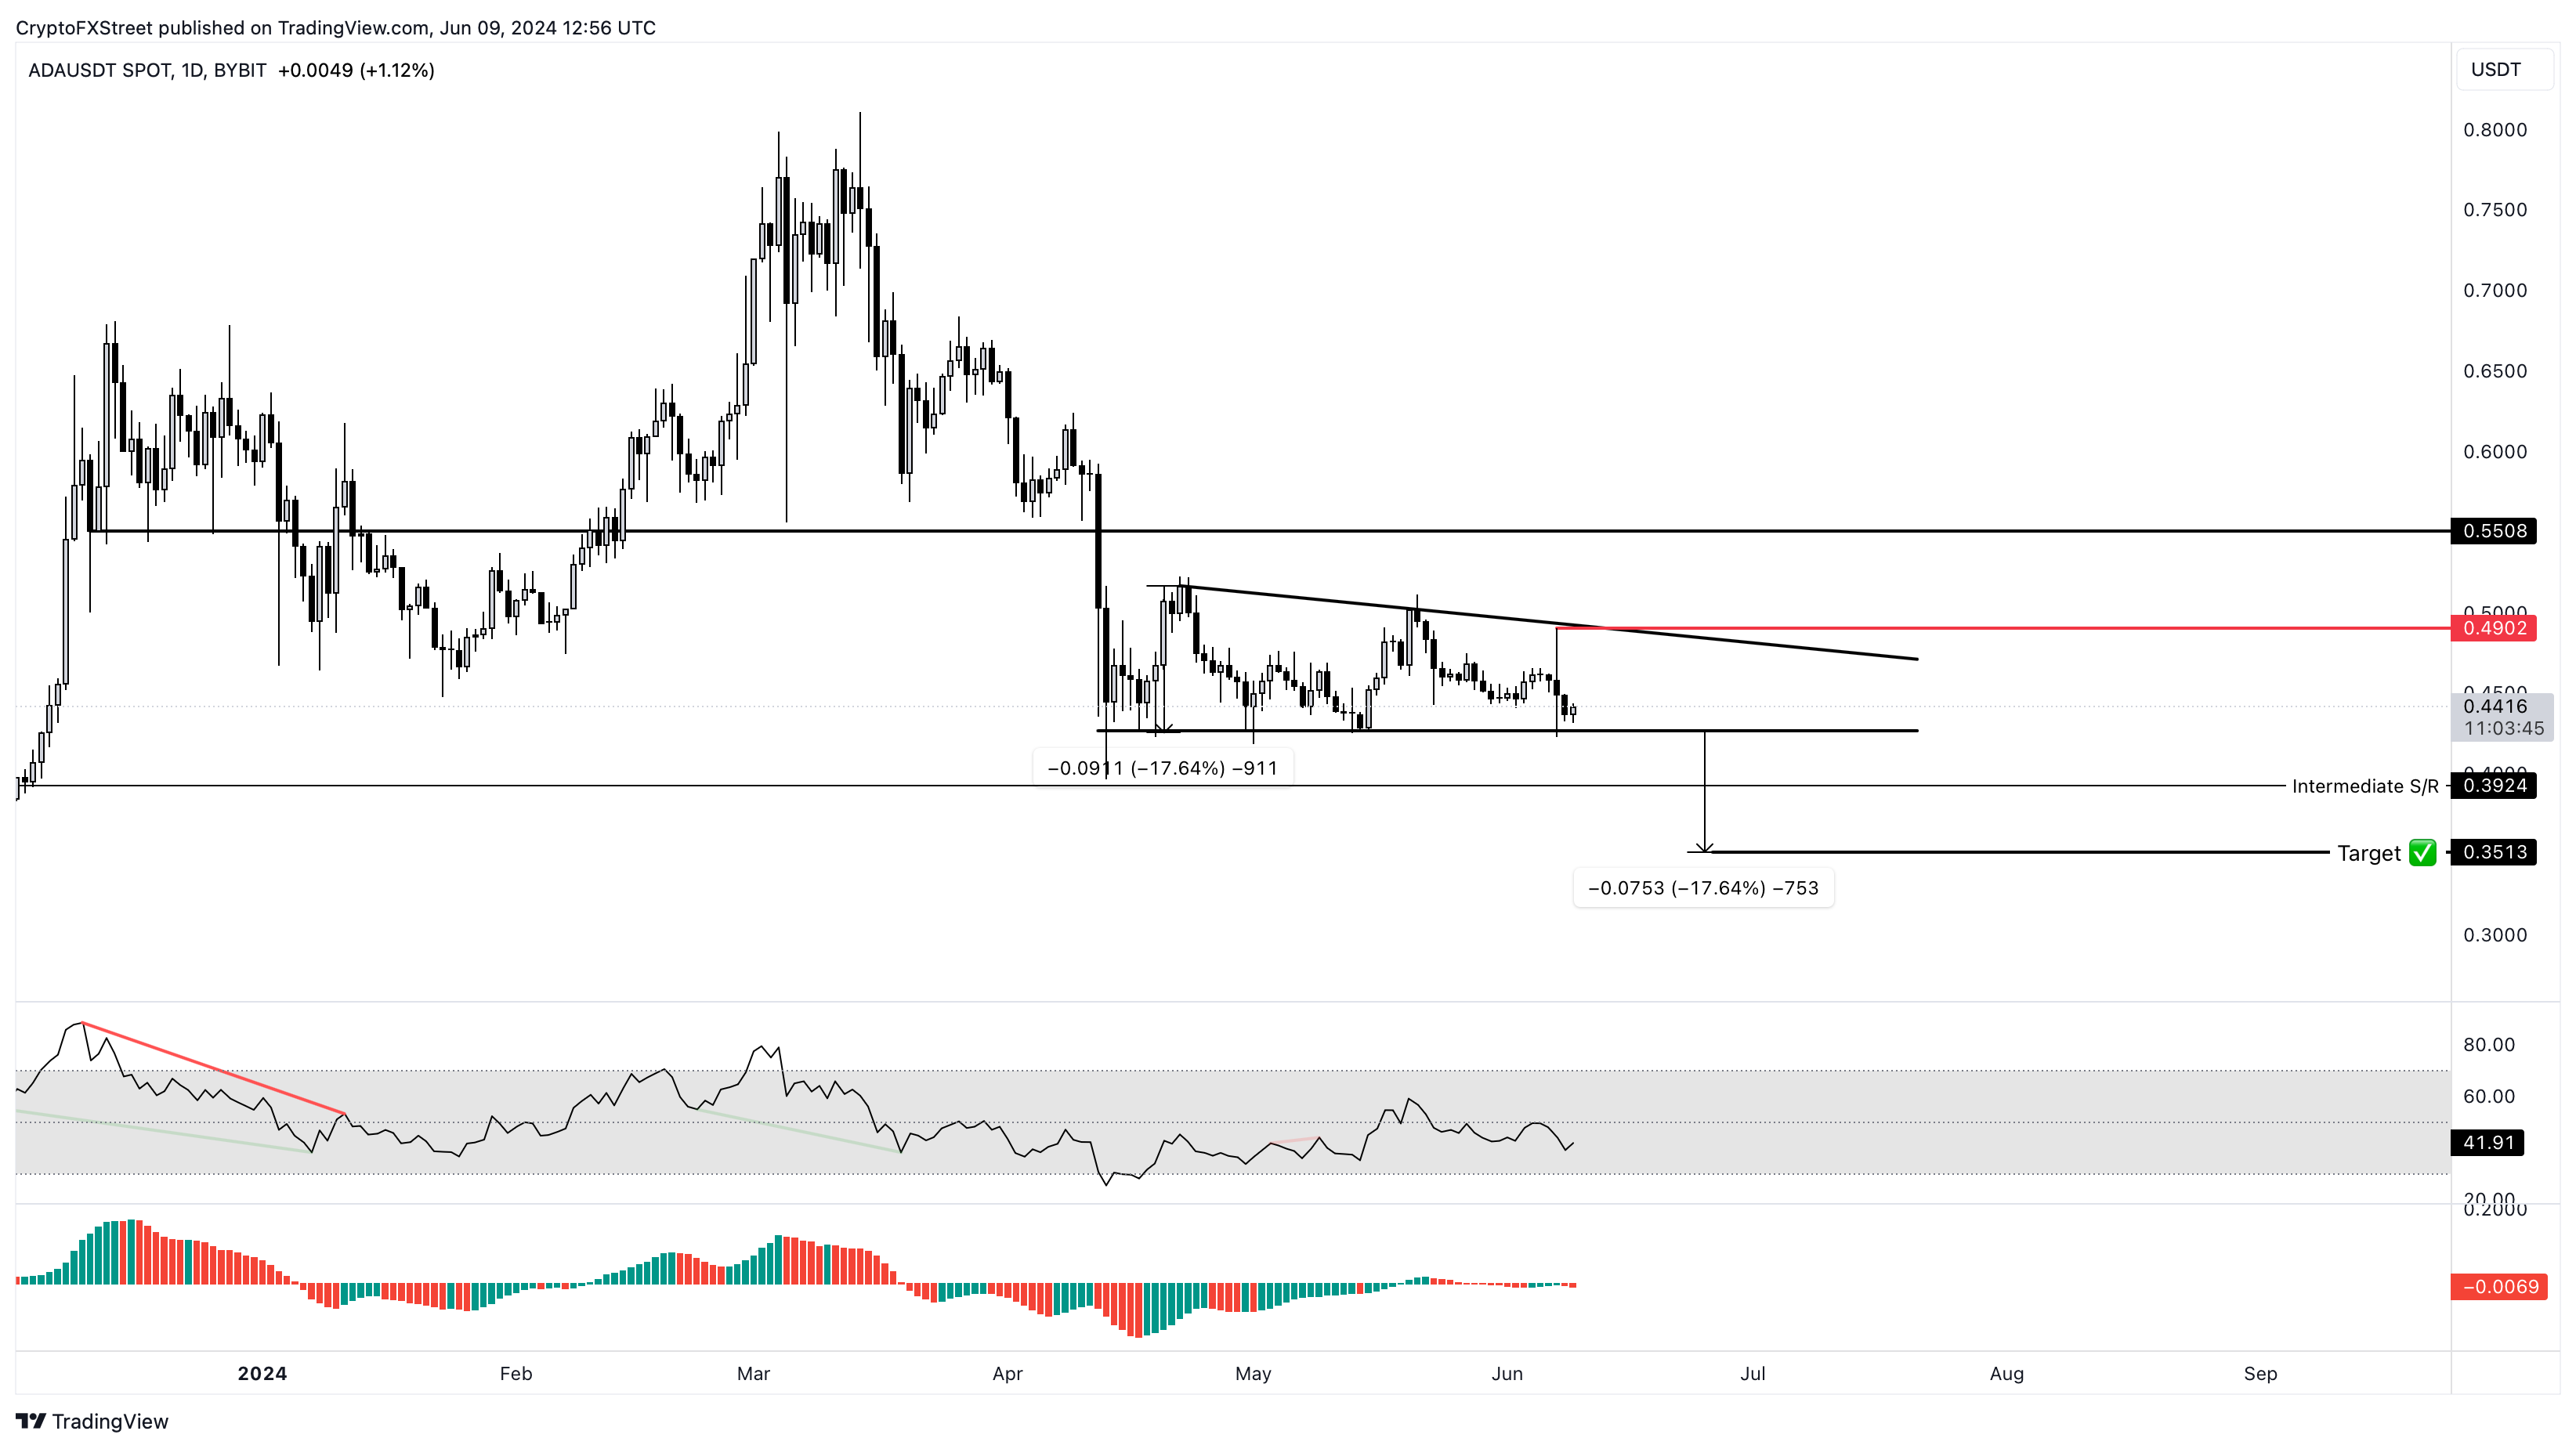
ADA/USDT 1-day chart
On the other hand, if the market outlook improves, it would give Cardano price the boost it’s needed. In such a case, if ADA produces a decisive candlestick close above $0.490, it would invalidate the ascending triangle and bullish thesis by producing a higher high.
If the bullish momentum sustains, then Cardano price could rally 12% from here and retest the $0.550 hurdle.
Source
Binance Coin price to give bullish breakout another go
- Binance Coin price is likely to provide sidelined buyers another opportunity to accumulate.
- Investors need to be careful in buying BNB dips due to the uncertain market outlook.
- A breakdown of the $596.5 support level will invalidate the bullish thesis.
Binance Coin (BNB) price exhaustion is likely to trigger a short-term correction. If the market outlook improves then the incoming pullback will be a good place to buy BNB on the dips.
Also read: Binance Coin pice poised to break all-time high after recent surge
Binance Coin price takes another shot
Binance Coin price broke out of the ascending triangle on June 4 and was due to retest the theoretical forecasted target of $775 after a 21% rally. However, the impulsive move stopped after a 13% rally that led to the local top formation of $721.8. This lack of momentum is likely to result in a 7% retracement that retests the ascending triangle’s base at $635.2.
Depending on how Binance Coin price reacts to the aforementioned level, investors can make their own decisions. A bounce above $635.2 will show that the buyers are in it for the long haul and are defending this key barrier. In such a case, BNB could embark on a bullish journey and target the theoretical forecasted target of $775.5.
While BNB retests the $635.2 support level, the Relative Strength Index also needs to hold above its mean level of 50. This development would further reinforce the optimistic outlook and help Binance Coin move toward $775.5.
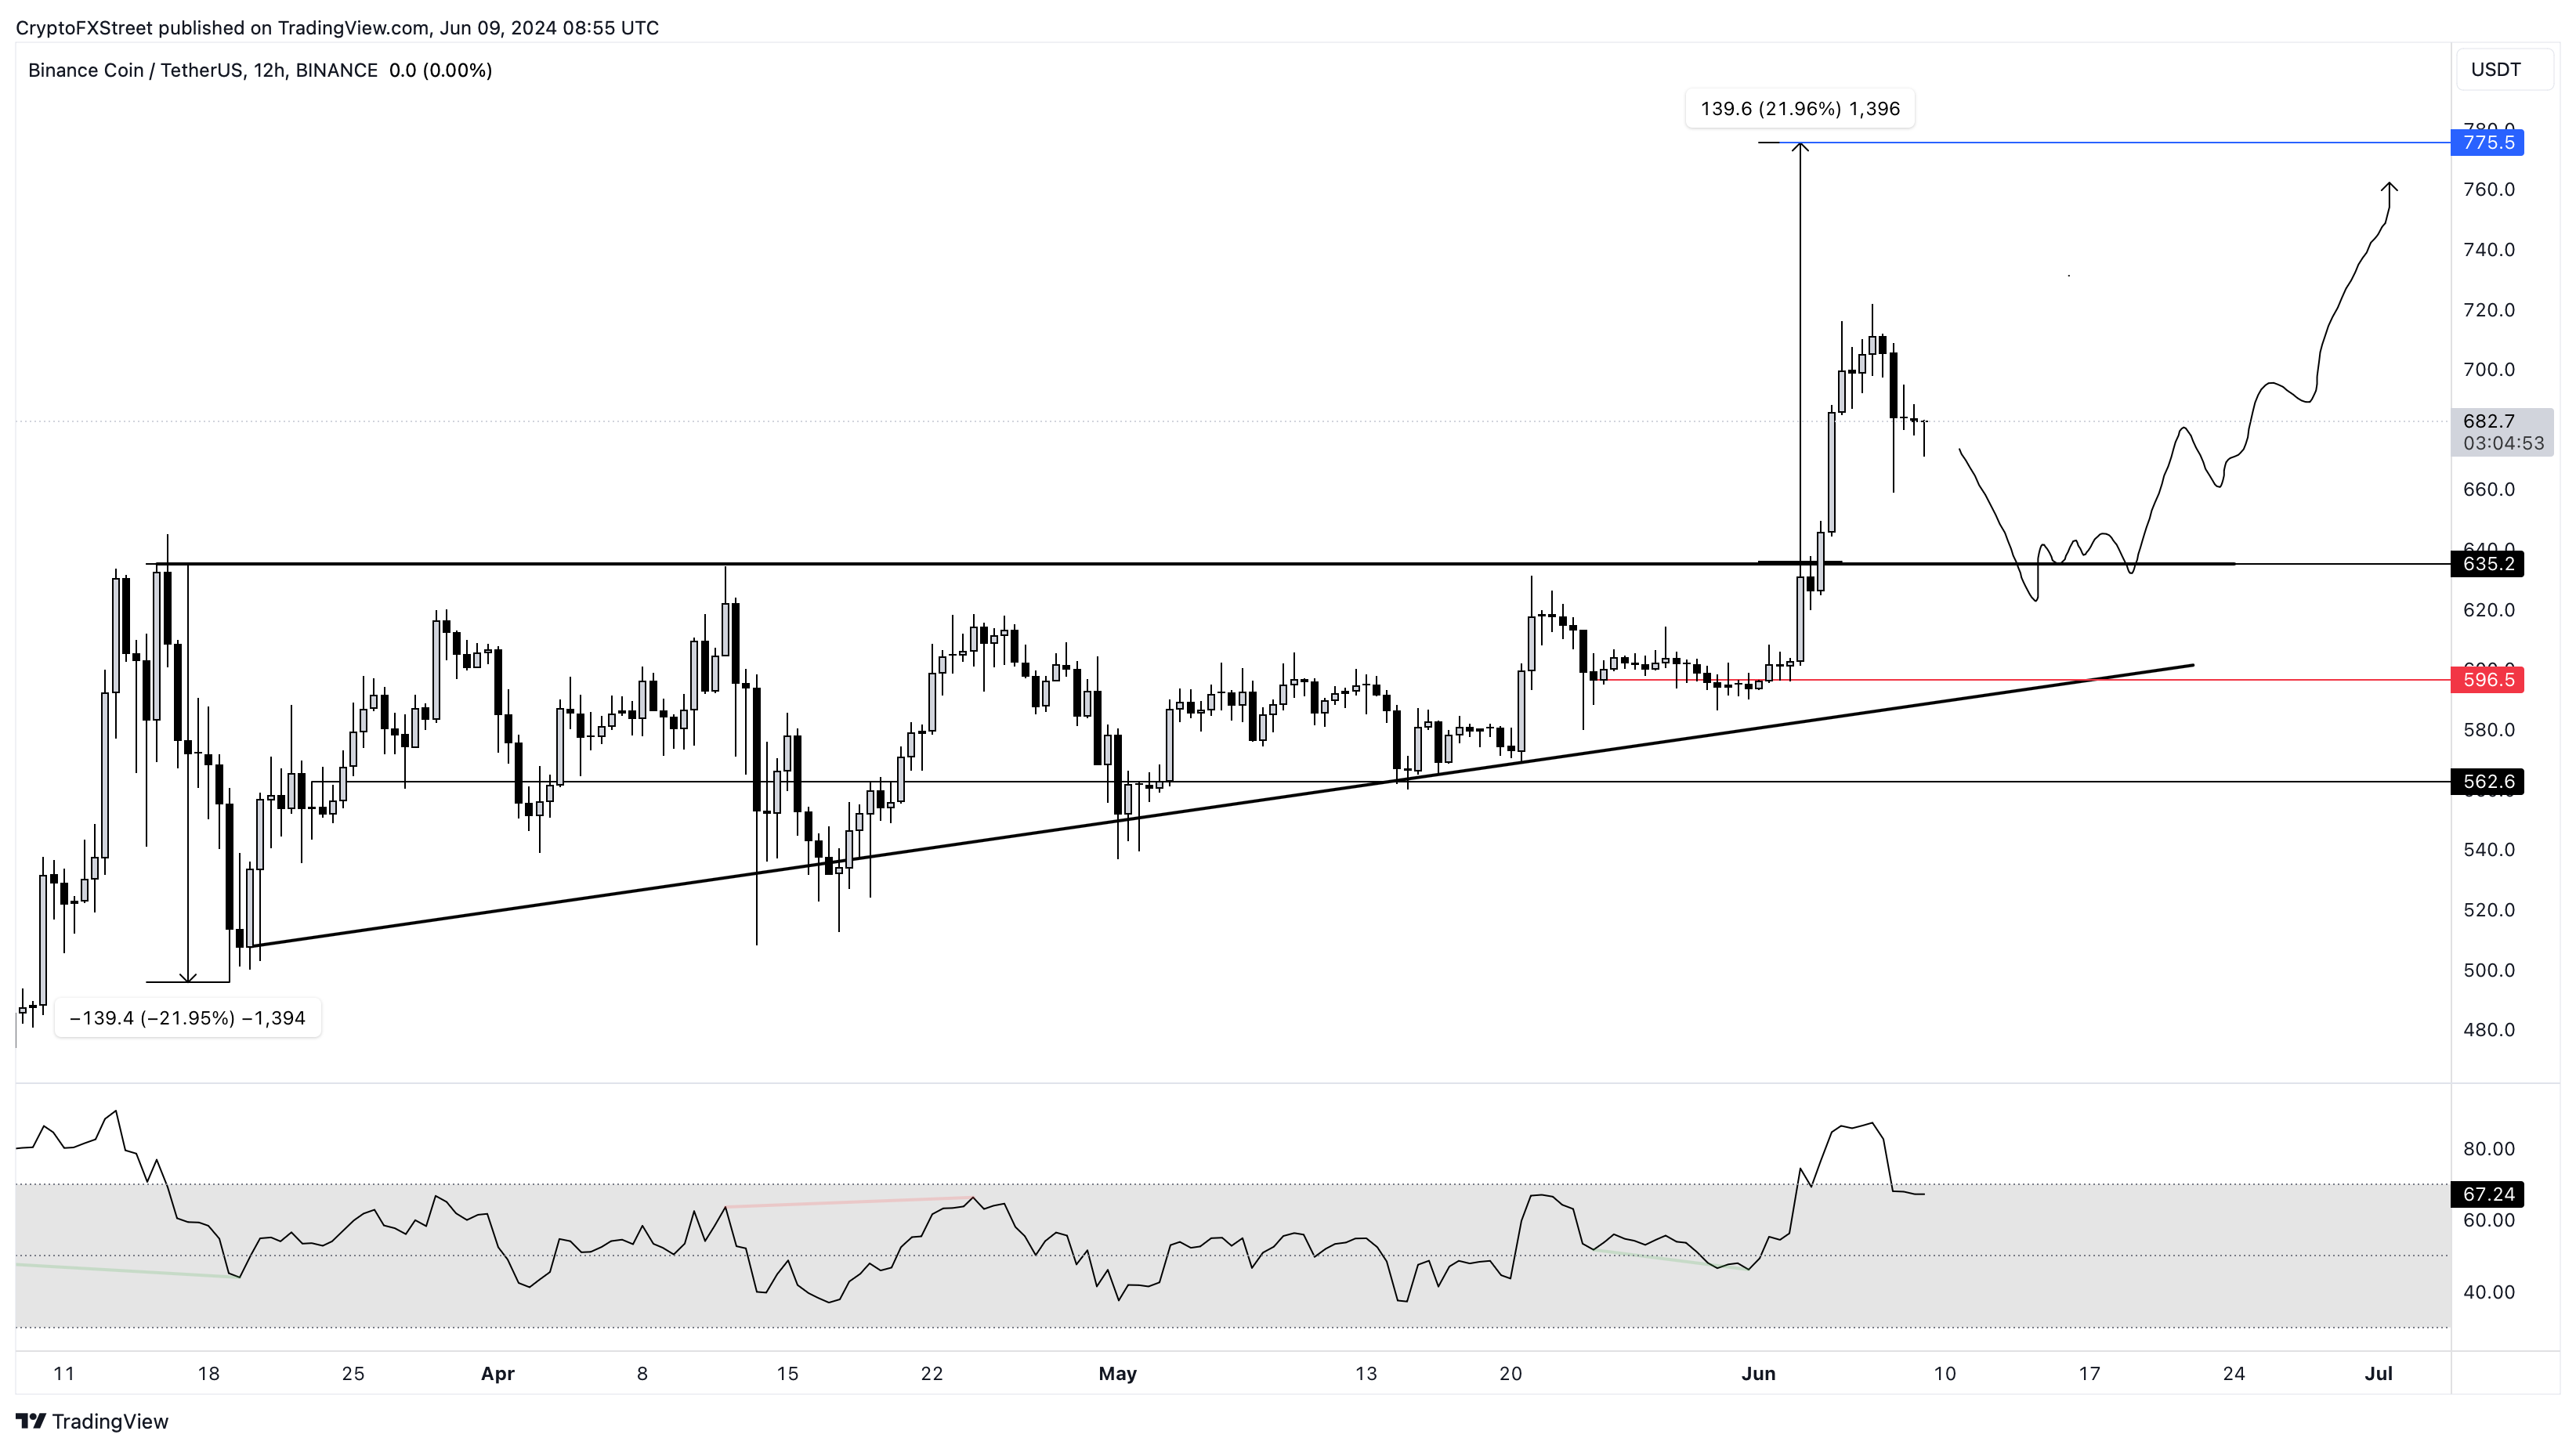
BNB/USDT 1-day chart
On the contrary, if the market outlook continues to deteriorate, then Binance Coin price is unlikely to hold above the $635.2 support level. A reentry into the ascending triangle setup would invalidate it.
However, if Binance Coin price flips $596 into a resistance level, it would create a lower low and invalidate the bullish market structure. Such development could see BNB nearly 6% and tag the $562.6 support level.
Read more: Binance effect fades, less than 20% tokens are profitable six months after listing
Source
1inch price edges closer to 15% crash as 1INCH bears shatter key support level
- 1inch price shows signs of exhaustion in line with the bearish market outlook.
- Investors can expect a 15% crash as the $0.0.451 support level is breached.
- A flip of the $0.501 support level will invalidate the bearish thesis for 1INCH.
1inch (1INCH) price has pulled a 180 and ended its bullish outlook as it slips below a key support level. If this outlook continues, 1INCH could trigger a double-digit crash.
Also read: Bitcoin’s 2% crash wipes $4.21 billion in OI and handicaps altcoins, what’s next?
1inch price edges closer to a crash
1inch price formed a bottom around mid-May and kickstarted a reversal. After growing by 52% in just 16 days, 1INCH formed a local top at $0.534 on May 31. Due to the stiff resistance around $0.501 the altcoin slipped into consolidation below the aforementioned hurdle. As buyers failed to step up and market conditions worsened, 1INCH slid 16% and currently trades below the $0.451 support level.
The Relative Strength Index (RSI) has slipped below the 50 mean level, suggesting that the bearish momentum is now in control. If 1inch price fails to recover above $0.451, the chances of a sustained bearish move are high. In such a case, 1INCH could drop 15% and tag the $0.380 support level.
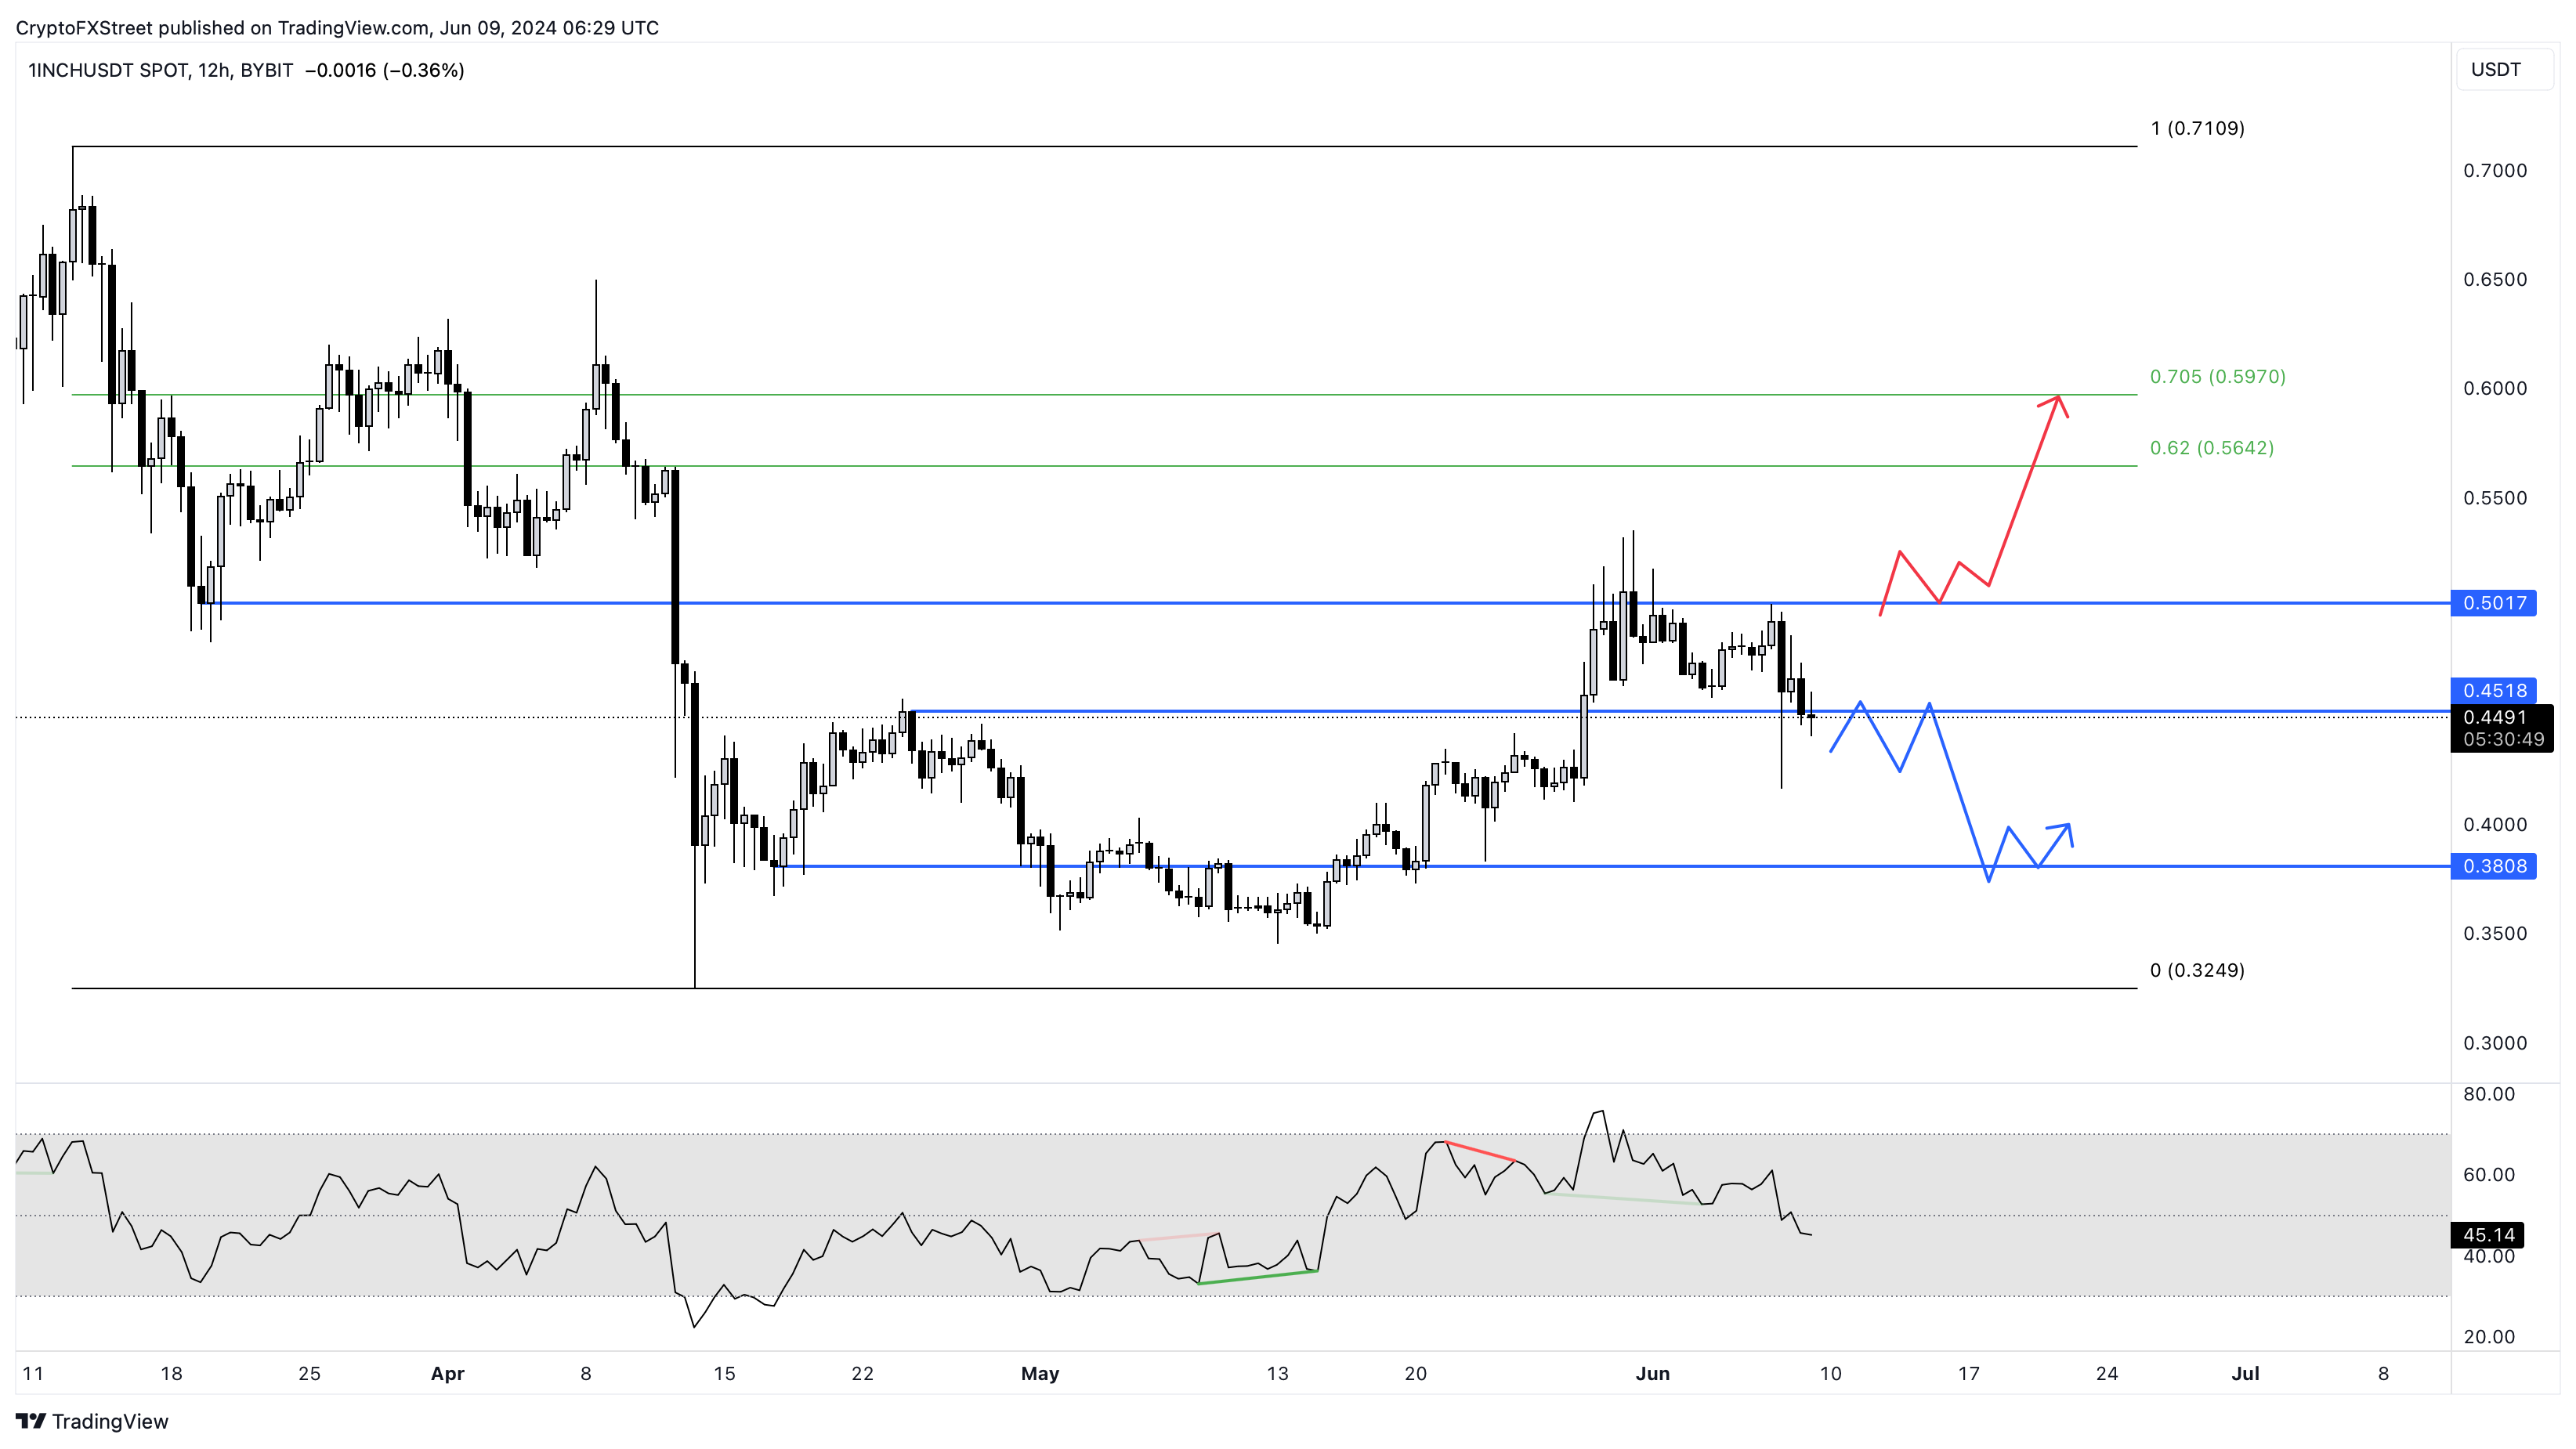
1INCH/USDT 12-hour chart
While the current outlook is predominantly bearish, it could turn bullish if Bitcoin (BTC) price sets a new weekly high above $72,000. This development could trigger a bullish move for altcoins, including 1inch’s price. In this case, if the $0.501 support level is flipped into a support floor, it would indicate a continuation of the 52% rally that began in mid-May.
Under these bullish circumstances, 1inch price could attempt a retest of the 62% retracement level at $0.564, roughly 13% away from $0.501. If the momentum is strong, then 1INCH could revisit the 70.5% retracement level at $0.597.
Source