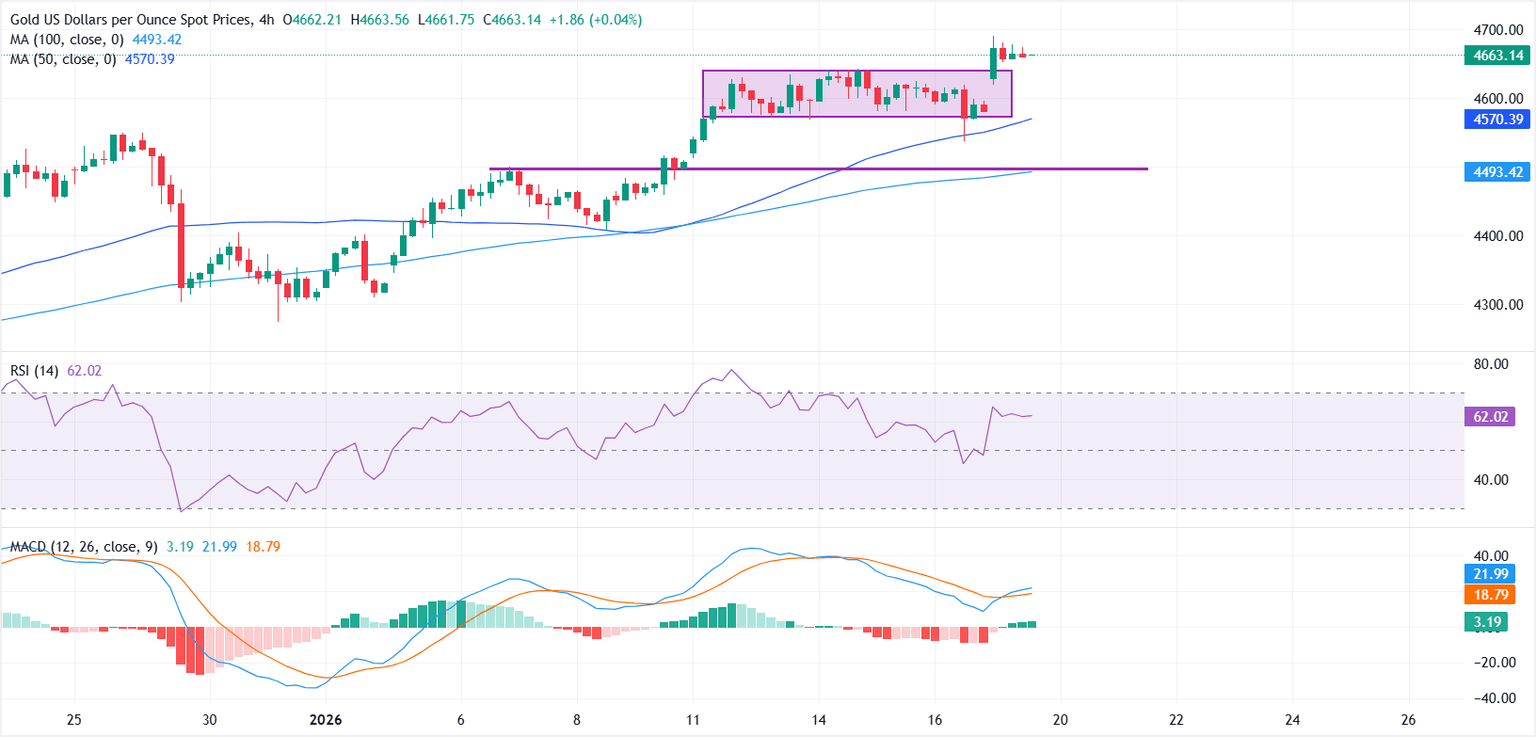
Gold reverses an intraday slide and holds steady above $4,100, although it remains below the all-time peak touched near $4,180 earlier this Tuesday. Gold draws support from safe-haven buying amid trade and geopolitical uncertainties ahead of Powell’s speech.
WTI Oil drops to the $58.00 area as global trade fears resurface

The US benchmark West Texas Intermediate Oil has lost nearly $1 per barrel on Tuesday, retreating to levels near $58.00, right above the five-month lows of $57.90 hit last week, hammered by growing trade tensions between the US and China.
The world’s two major economies have opened a new front in their trade feud, announcing higher fees on cargo ships, which will take effect from today.
This news has taken markets by surprise, crushing hopes of a de-escalation of tensions. The US Treasury’s Scott Bessent had soothed traders on Monday, announcing that US President Trump will meet Xi Jinping in late October.
Trump himself had eased his tone towards China after threatening 100% tariffs on Friday. Beijing, however, has remained firm, accusing the US of “double standards” with China, while the commerce ministry warned that the US cannot seek dialogue while threatening new measures.
Meanwhile, Crude producers are planning to hike output by 137,000 additional barrels per day in November. This is a more moderate increase than expected, yet it keeps fears of an Oil glut alive as trade uncertainty remains high, and most of the world’s leading economies are stuttering.
WTI Oil FAQs
WTI Oil is a type of Crude Oil sold on international markets. The WTI stands for West Texas Intermediate, one of three major types including Brent and Dubai Crude. WTI is also referred to as “light” and “sweet” because of its relatively low gravity and sulfur content respectively. It is considered a high quality Oil that is easily refined. It is sourced in the United States and distributed via the Cushing hub, which is considered “The Pipeline Crossroads of the World”. It is a benchmark for the Oil market and WTI price is frequently quoted in the media.
Like all assets, supply and demand are the key drivers of WTI Oil price. As such, global growth can be a driver of increased demand and vice versa for weak global growth. Political instability, wars, and sanctions can disrupt supply and impact prices. The decisions of OPEC, a group of major Oil-producing countries, is another key driver of price. The value of the US Dollar influences the price of WTI Crude Oil, since Oil is predominantly traded in US Dollars, thus a weaker US Dollar can make Oil more affordable and vice versa.
The weekly Oil inventory reports published by the American Petroleum Institute (API) and the Energy Information Agency (EIA) impact the price of WTI Oil. Changes in inventories reflect fluctuating supply and demand. If the data shows a drop in inventories it can indicate increased demand, pushing up Oil price. Higher inventories can reflect increased supply, pushing down prices. API’s report is published every Tuesday and EIA’s the day after. Their results are usually similar, falling within 1% of each other 75% of the time. The EIA data is considered more reliable, since it is a government agency.
OPEC (Organization of the Petroleum Exporting Countries) is a group of 12 Oil-producing nations who collectively decide production quotas for member countries at twice-yearly meetings. Their decisions often impact WTI Oil prices. When OPEC decides to lower quotas, it can tighten supply, pushing up Oil prices. When OPEC increases production, it has the opposite effect. OPEC+ refers to an expanded group that includes ten extra non-OPEC members, the most notable of which is Russia.
warned
Cardano Price Forecast: ADA bears regain control after rejection at key resistance
Cardano (ADA) price edges down at around $0.715 at the time of writing on Tuesday after facing rejection from the key resistance level. The bearish sentiment is further supported by the negative Spot Taker CVD (Cumulative Volume Delta) and rising short bets among traders. On the technical side, indicators suggest ADA may face a deeper correction ahead.
On-chain and derivatives show bearish bias
CryptoQuant’s Spot Taker CVD for Cardano is negative, and its value has been steadily falling since early October. This metric measures the cumulative difference between market buy and sell volumes over a three-month period. When the three-month CVD is positive, it suggests the Taker Buy Dominant Phase. A negative value, as it is currently happening, indicates the Taker Sell Dominant Phase.
%20(3)-1760412364554-1760412364556.png&w=1536&q=95)
Cardano Spot Taker CVD chart. Source: CryptoQuant
On the derivatives side, CoinGlass’s ADA long-to-short ratio, which stands at 0.81, is the lowest value in a month. This ratio, below one, reflects bearish sentiment in the markets, as more traders are betting on the asset price to fall.

ADA long-to-short ratio chart. Source: Coinglass
Cardano Price Forecast: ADA bears tighten grip
Cardano price broke below the ascending trendline (drawn by connecting multiple lows since the end of June) on Friday and corrected by more than 22% that day. However, on Sunday, ADA recovered by 15% and continued into Monday, retesting the 61.8% Fibonacci retracement level at $0.734. At the time of writing on Tuesday, it trades slightly down, facing rejection from the $0.734 level.
If ADA continues its correction, it could extend the decline toward the next key support level at $0.646.
The Relative Strength Index (RSI) on the daily chart reads 40, below the neutral level of 50, indicating that the bears are in control of the momentum.

ADA/USDT daily chart
However, if ADA breaks and closes above $0.734 level on a daily basis, it could extend the recovery toward the 200-day Exponential Moving Average (EMA) at 0.771.
GBP/USD slips as Dollar rebounds, ahead of UK data and Fed speeches
The GBP/USD ended Monday’s session with loses of 0.13% as the Greenback staged a recovery, after US President Donald Trump tempered its rhetoric on China, over the weekend. At the time of writing, the pair trades at 1.3333 as the Tuesday’s Asian session begins.
Sterling weakens as easing US–China tensions lift the Greenback amid prolonged government shutdown
The daily recap shows that price action reversed its course as last Friday, Trump threatened to impose 100% additional tariffs on Chinese products, as China imposed duties on US vessels, and export controls on rare earths. Nevertheless, Trump posted in his Truth Social network that everything would be “fine,” echoed later by comments of Treasury Secretary Bessent who said that US and Chinese Presidents are set to meet at South Korea towards the end of the month.
As tensions receded, the Dollar rallied as depicted by the US Dollar Index (DXY). The DXY, which tracks the buck’s performance against a basket of six currencies including the Pound, is up 0.40% at 99.24.
The US government shutdown has extended to the thirteen straight day, leaving traders leaning on the resolution of the shutdown and speeches by Fed officials. Philadelphia Fed Anna Pausol was dovish, saying that signs of weakness in the labor market suggest that the Fed should be more worried about the jobs market, than fighting inflation. She favors gradual cuts this year and in the next, as she sees policy modestly restrictive.
Ahead, the docket in the UK will feature jobs data. The ILO Unemployment Rate for the last three months to September is expected to remain unchanged at 4.7%, while Average Earnings Including and Excluding Bonuses as projected to remain unchanged, for the same period. In August, the Employment Change came at 232K.
Besides this, traders would eye Bank of England MPC member Alan Taylor and Governor Andrew Bailey will cross the wires. Across the pond, the US economic schedule will feature speeches by Fed Governor Michelle Bowman, who shifted dovish since mid-July, Fed Chair Powell and Governor Christopher Waller. Later, Boston Fed Susan Collins, will cross the wires.
GBP/USD Price Chart – Daily

Economic Indicator
ILO Unemployment Rate (3M)
The ILO Unemployment Rate released by the UK Office for National Statistics is the number of unemployed workers divided by the total civilian labor force. It is a leading indicator for the UK Economy. If the rate goes up, it indicates a lack of expansion within the UK labor market. As a result, a rise leads to a weakening of the UK economy. Generally, a decrease of the figure is seen as bullish for the Pound Sterling (GBP), while an increase is seen as bearish.
Ethereum Price Forecast: ETH continues recovery as BitMine expands treasury by 202K ETH
Ethereum price today: $4,220
- Ethereum treasury BitMine scooped up over 202,000 ETH following the crypto market crash last week.
- The firm has now achieved more than half of its vision to acquire 5% of the entire ETH circulating supply.
- ETH is facing resistance near $4,270 as it continues its recovery march.
Ethereum (ETH) trades above $4,200 on Monday following BitMine’s (BMNR) latest update that it bought over 202,000 ETH during last week’s crypto market crash.
BitMine holdings cross 3 million ETH, over 2.5% of circulating supply
Ethereum treasury firm BitMine Immersion scooped up 202,037 ETH following the market dip last week.
The latest purchase has expanded the company’s Ethereum stash to 3.03 million tokens, bringing it more than halfway closer to its vision of acquiring 5% of the entire ETH circulation, according to a Monday statement.
“The crypto liquidation over the past few days created a price decline in ETH, which BitMine took advantage of,” wrote BitMine Chairman Thomas Lee.
The Nevada-based firm also reported holdings of 192 Bitcoin (BTC), a $135 million stake in Worldcoin (WLD) treasury, Eightco Holdings, and unencumbered cash of $104 million.
BitMine ranks as the largest ETH treasury, leading its closest competitor, SharpLink Gaming (SBET), by over 3.5x. The company also claims it was the twenty-second most traded stock in the US last week, with an average trading volume of $3.5 billion.
BMNR is up over 3% at the time of publication on Monday.
Last week, investment management firm Kerrisdale Capital disclosed a short position on BitMine, highlighting declining net asset value (NAV) premiums and waning interest in the crypto treasury “playbook.”
Ethereum Price Forecast: ETH faces resistance near $4,270 en route to recovery
Ethereum is seeing a recovery on Monday after the $19.1 billion crypto leverage wipeout on Friday, where ETH liquidations comprised over $4.3 billion.
“Volatility creates deleveraging and this can cause assets to trade at substantial discounts to fundamentals, or as we say, ‘substantial discount to the future’ and this creates advantage for investors, at the expense of traders,” added Lee.
ETH faces resistance near the $4,270 level, after recovering the $4,100-$4,000 support range, which is strengthened by the 100-day Simple Moving Average (SMA).

ETH/USDT daily chart
The recovery above $4,000 comes after bulls defended the support near $3,470 during the crypto market’s flash crash on Friday. This level could prove crucial if the market tilts downward again.
The Relative Strength Index (RSI) is trending upward toward its neutral level, while the Moving Average Convergence Divergence (MACD) is posting receding red histogram bars. A firm crossover in both indicators will validate a resumption of bullish momentum.
Pi Network Price Forecast: Recovery at risk as core team wallets shift 100 million PI tokens
Pi Network (PI) edges higher by 4% at press time on Monday, extending its recovery for the third consecutive day after bouncing off the $0.2000 psychological level. Despite the short-term recovery, PI remains at risk of extended correction as outflows from the Pi Network Foundation wallet and liquidity reserve threaten further supply pressure.
Pi Network’s supply problem
Out of Pi Network’s 8.27 million circulating supply, the majority is off exchanges, according to PiScan data, which shows the total reserve of Centralized Exchanges (CEXs) at 417.20 million PI. This suggests that the majority of the selling pressure comes from off-exchange transactions.

Pi Network metrics. Source: PiScan
The outflow of 50 million PI tokens from Pi Network Foundation wallet #11 on Sunday resulted in strategic distribution within the community via Foundation Wallet #2. At the same time, the 50 million PI outflow from the liquidity reserve remains stagnant in a different wallet at press time. This increased outflow activity from Pi core team wallets risks adding to the available supply.

Pi Network transactions data. Source: PiScan
Technical Outlook: Will Pi Network extend the recovery?
Pi Network price dropped 13% on Friday, resulting in a fresh low of $0.1533 before retracing higher to close at $0.1996 on the day. At the time of writing, PI trades above $0.2150, hinting at a potential V-shaped reversal.
If the bounce back from the $0.2000 psychological level extends, PI could face a hurdle at $0.2755, marked by the centre Pivot Point level.
The Relative Strength Index (RSI) reads 28 on the daily chart, reversing within the oversold zone while the selling pressure remains heightened. The Moving Average Convergence Divergence (MACD) on the same chart inches closer to its signal line while maintaining a declining trend, hinting at a potential crossover. If MACD crosses above the signal line, it would flash a positive shift in trend momentum that could signal extended recovery.

PI/USDT daily price chart.
Looking down, crucial support levels for Pi Network remain at the $0.2000 psychological level and the S1 Pivot Point level at $0.1731.
Cryptocurrency prices FAQs
China: Export stayed resilient in September on strong demand from nonUS markets – UOB Group

Both China’s export and import growth were well-above Bloomberg’s consensus forecasts in September. China’s exports rose at the fastest pace in six months at 8.3% y/y in September (Bloomberg est: 6.6%, August: 4.4%) and imports jumped sharply by 7.4% y/y (Bloomberg est: 1.8%, August: 1.3%). In CNY-terms, exports were up 8.4% y/y (August: 4.8%) while imports were similarly higher at 7.5% y/y (August: 1.7%). Due to the larger improvements in imports, China’s trade surplus narrowed to US$90.45 bn from US$102.33 bn in August, UOB Group’s FX analysts Quek Ser Leang and Peter Chia note.
China’s rare earth export moderates at a sharper pace in September
“Exports remained buoyed by non-US markets while US continued to be the worst performing major market for China as supply chains diversification accelerates. Export to the US contracted for the 6th consecutive month since Apr, though the decline narrowed to -27.0% y/y in September from -33.1% y/y in August. In September, export growth was led by markets such as South Africa (+23.3%), India (+14.4%), EU (+14.2%), and ASEAN (+15.6%) in particular Vietnam (+24.5%), Thailand (+19.7%) and Indonesia (+17.1%).”
“By key products, the strongest export growth was seen in ships, semiconductors, LCD panels, Chinese medicine and motor vehicles which expanded at a doubledigit pace in September. On the other hand, contractions were the worst for consumer goods such as toys, footwear, handbags and garments as well as commodities such as refined petroleum products and steel/iron products, indicating a slowdown in global consumer demand.”
“China’s rare earth export which is at the center of its tensions with the US, moderated at a sharper pace in September. In volume terms, rare earth shipments fell 30.9% compared to August, to 4,000 tons in September.”
EUR/JPY holds gains near 176.50 due to weakening safe-haven demand

EUR/JPY recovers its losses registered in the previous session, trading around 176.50 during the Asian hours on Monday. The currency cross appreciates as the Japanese Yen (JPY) struggles amid dampening safe-haven demand, driven by easing US-China trade tensions.
President Trump posted on Truth Social on Sunday, noting that China’s economy “will be fine” and that the US wants to “help China, not hurt it.” On Sunday, Trump said that there’s no need to meet China’s President Xi Jinping at the upcoming South Korea summit and threatened to impose 100% tariffs on Chinese imports. China also responded by warning to retaliate if Trump fails to back down on his threat to impose 100% tariffs on Chinese imports.
The Japanese Yen (JPY) could come under pressure as Japan’s incoming Prime Minister, Sanae Takaichi, is expected to pursue higher fiscal spending while maintaining a loose monetary policy. The political concerns increase as Japan’s Komeito party announced on Friday that it is leaving the ruling coalition, delivering a setback to Takaichi’s bid for the premiership and potentially weakening the Liberal Democratic Party’s hold on power in the world’s fourth-largest economy.
The EUR/JPY cross appreciates as the Euro (EUR) receives support from easing political tensions in France, where President Emmanuel Macron is set to appoint a new prime minister after Sebastien Lecornu’s resignation. Investors’ sentiment improved as Lecornu indicated that dissolving parliament and thus holding snap elections was unlikely.
The European Central Bank’s (ECB) September meeting accounts showed that policymakers broadly agreed the current policy stance remains consistent with the 2% medium-term inflation target. ECB members concurred that current interest rates are sufficiently strong to handle potential shocks amid two-sided inflation risks.
Euro Price Today
The table below shows the percentage change of Euro (EUR) against listed major currencies today. Euro was the strongest against the New Zealand Dollar.
USD | EUR | GBP | JPY | CAD | AUD | NZD | CHF | |
---|---|---|---|---|---|---|---|---|
USD | 0.00% | -0.02% | -0.05% | -0.01% | -0.21% | 0.08% | 0.01% | |
EUR | -0.01% | -0.03% | 0.00% | -0.03% | -0.13% | 0.07% | -0.01% | |
GBP | 0.02% | 0.03% | 0.06% | 0.00% | -0.11% | 0.10% | 0.00% | |
JPY | 0.05% | 0.00% | -0.06% | -0.04% | -0.21% | 0.15% | 0.00% | |
CAD | 0.01% | 0.03% | -0.00% | 0.04% | -0.23% | 0.11% | -0.00% | |
AUD | 0.21% | 0.13% | 0.11% | 0.21% | 0.23% | 0.22% | 0.11% | |
NZD | -0.08% | -0.07% | -0.10% | -0.15% | -0.11% | -0.22% | -0.11% | |
CHF | -0.01% | 0.01% | 0.00% | -0.00% | 0.00% | -0.11% | 0.11% |
The heat map shows percentage changes of major currencies against each other. The base currency is picked from the left column, while the quote currency is picked from the top row. For example, if you pick the Euro from the left column and move along the horizontal line to the US Dollar, the percentage change displayed in the box will represent EUR (base)/USD (quote).
Gold Price Forecast: XAU/USD rises to near $4,050 as Trump’s 100% tariffs ignite safe-haven demand

Gold price (XAU/USD) extends the rally to around $4,040 during the early Asian session on Monday. The escalating trade tensions between the United States (US) and China provide some support to the precious metal. Traders await signs on when the US government will reopen and release data that will shape Federal Reserve (Fed) policy.
The rally in the yellow metal is bolstered by US President Donald Trump’s decision to impose fresh 100% tariffs on Chinese imports starting November 1. China warned the US that it would retaliate if Trump fails to back down on his threat to impose levies on Chinese imports. ”Heating up the trade war again will tank the dollar and be good for safe-havens,” said Tai Wong, an independent metals trader.
Furthermore, traders expect the Fed to cut interest rates by 25 basis points (bps) each in October and December. According to the CME FedWatch tool, markets are pricing in nearly a 97% possibility that the US central bank cuts rates by 25 bps at its October meeting, while the odds of an additional reduction in December are at 92%. Lower interest rates could reduce the opportunity cost of holding Gold, supporting the non-yielding precious metal.
Traders will take more cues from the US Retail Sales and Producer Price Index (PPI) reports, which will be released later on Thursday. Any signs of hotter inflation in the US could lift the US Dollar (USD) and weigh on the USD-denominated commodity price in the near term.
Gold FAQs
Gold has played a key role in human’s history as it has been widely used as a store of value and medium of exchange. Currently, apart from its shine and usage for jewelry, the precious metal is widely seen as a safe-haven asset, meaning that it is considered a good investment during turbulent times. Gold is also widely seen as a hedge against inflation and against depreciating currencies as it doesn’t rely on any specific issuer or government.
Central banks are the biggest Gold holders. In their aim to support their currencies in turbulent times, central banks tend to diversify their reserves and buy Gold to improve the perceived strength of the economy and the currency. High Gold reserves can be a source of trust for a country’s solvency. Central banks added 1,136 tonnes of Gold worth around $70 billion to their reserves in 2022, according to data from the World Gold Council. This is the highest yearly purchase since records began. Central banks from emerging economies such as China, India and Turkey are quickly increasing their Gold reserves.
Gold has an inverse correlation with the US Dollar and US Treasuries, which are both major reserve and safe-haven assets. When the Dollar depreciates, Gold tends to rise, enabling investors and central banks to diversify their assets in turbulent times. Gold is also inversely correlated with risk assets. A rally in the stock market tends to weaken Gold price, while sell-offs in riskier markets tend to favor the precious metal.
The price can move due to a wide range of factors. Geopolitical instability or fears of a deep recession can quickly make Gold price escalate due to its safe-haven status. As a yield-less asset, Gold tends to rise with lower interest rates, while higher cost of money usually weighs down on the yellow metal. Still, most moves depend on how the US Dollar (USD) behaves as the asset is priced in dollars (XAU/USD). A strong Dollar tends to keep the price of Gold controlled, whereas a weaker Dollar is likely to push Gold prices up.
Bitcoin, crypto market experience largest decline in 2025 as Trump threatens fresh tariffs on China
Bitcoin (BTC) briefly declined nearly 10% on Friday as the crypto market took a sharp downturn following US President Donald Trump’s plan to raise tariffs on Chinese goods.
Trump tariff threat on China sparks weekend decline in Bitcoin, crypto market
The crypto market took a sharp dive on Friday, erasing nearly $280 billion from its market cap.
The downturn stems from President Donald Trump’s announcement that the US is planning a 100% increase in levies on Chinese imports beginning November 1.
“One of the policies that we are calculating at this moment is a massive increase of tariffs on Chinese products coming into the United States of America,” wrote Trump in a Truth Social post on Friday.
Trump described China as “hostile” and accused it of trying to dominate the market by imposing export controls on rare-earth metals. In line with this, he stated that a range of additional countermeasures is also under serious consideration, suggesting that further actions could be taken in response to China’s policies.
The announcement stirred a decline among top crypto assets, with Bitcoin briefly falling over 10% below the $108,000 level over the past 24 hours.

BTC/USDT daily chart
A sharp pullback was also observed among altcoins, with Ethereum (ETH), XRP and Solana (SOL) dropping 18%, 32% and 20%, to $3,540, $1.87, and $174, respectively.
Several other sectors saw similar downturns, with the memecoin category plunging 35% and the Artificial Intelligence (AI) sector dropping 30%.
The wave of negative reactions sparked heavy long liquidations on Friday, with the Coinglass liquidation data platform crashing briefly.
This marks one of the steepest single-day declines in the crypto market in 2025.
Prior to the decline, a key Bitcoin OG wallet opened $1.1 billion short positions on BTC and ETH, resulting in unrealized profits of over $27 million, according to data compiled by smart money tracker Lookonchain.
A broader decline was observed across other risk assets, with stocks seeing a rapid pullback. The S&P 500 fell 2.7%, dropping 182 points on the day. The Dow Jones indices also fell 878 points, dropping 1.9% following the announcement.
This isn’t the first time that a Trump tariff threat has sparked a decline in the crypto market. A similar event occurred in April after the US President announced the Liberation Day tariffs.
Another market plunge occurred in August following the US reciprocal tariff announcement for trade partners across the globe.
Market experts predict that the impact of new tariffs on China could quench the positive momentum that crypto assets have maintained since the start of October.