Bitcoin rises above $76,000 following an extended decline to $72,946 the previous day as Fed-related headlines keep investors on edge. Ethereum advances toward the $2,300 hurdle amid low retail interest, with futures Open Interest falling to $26.3 billion.
USD/INR trades cautiously as US-India trade deal improves FIIs sentiment
The Indian Rupee (INR) demonstrates strength against the US Dollar (USD) on Wednesday, with the USD/INR pair holding onto losses near 90.55.
The near-term trend of the pair seems fragile as the broader outlook of the Indian Rupee has improved, following the trade deal announcement between the United States (US) and India by President Donald Trump. The acknowledgement of the long-awaited US-India trade deal appears to have improved the sentiment of foreign investors toward the Indian equity market.
On Tuesday, Foreign Institutional Investors (FIIs) turned out to be net buyers and purchased stocks worth Rs. 5,236.28 crore, the highest inflow of overseas funds seen since October 28, 2025, Economic Times (ET) reported.
While market participants were cautious about whether the Indian government had sacrificed its “non-compromise” policy on critical sectors, such as agriculture and dairy, Commerce Minister Piyush Goyal has clarified that these sectors were protected from international exposure during negotiations.
Going forward, investors will focus on the Reserve Bank of India’s (RBI) monetary policy announcement on Friday, in which it is expected to leave the Repo Rate unchanged at 5.25%.
The table below shows the percentage change of Indian Rupee (INR) against listed major currencies today. Indian Rupee was the strongest against the Japanese Yen.
| USD | EUR | GBP | JPY | CAD | AUD | INR | CHF | |
|---|---|---|---|---|---|---|---|---|
| USD | -0.07% | -0.12% | 0.42% | -0.01% | -0.13% | 0.03% | -0.03% | |
| EUR | 0.07% | -0.05% | 0.50% | 0.06% | -0.06% | 0.10% | 0.04% | |
| GBP | 0.12% | 0.05% | 0.56% | 0.11% | -0.01% | 0.16% | 0.10% | |
| JPY | -0.42% | -0.50% | -0.56% | -0.43% | -0.55% | -0.39% | -0.45% | |
| CAD | 0.01% | -0.06% | -0.11% | 0.43% | -0.12% | 0.06% | -0.01% | |
| AUD | 0.13% | 0.06% | 0.01% | 0.55% | 0.12% | 0.18% | 0.10% | |
| INR | -0.03% | -0.10% | -0.16% | 0.39% | -0.06% | -0.18% | -0.06% | |
| CHF | 0.03% | -0.04% | -0.10% | 0.45% | 0.01% | -0.10% | 0.06% |
The heat map shows percentage changes of major currencies against each other. The base currency is picked from the left column, while the quote currency is picked from the top row. For example, if you pick the Indian Rupee from the left column and move along the horizontal line to the US Dollar, the percentage change displayed in the box will represent INR (base)/USD (quote).
Daily Digest Market Movers: Investors await key US economic data
- The US Dollar trades broadly calm against its other currency peers ahead of the release of US ADP Employment Change and the ISM Services Purchasing Managers’ Index (PMI) data for January, which will be published during the North American session.
- At the time of writing, the US Dollar Index (DXY), which tracks the Greenback’s value against six major currencies, trades slightly higher to near 97.50. The DXY is close to its weekly high of 97.73 posted on Monday.
- The US ADP employment report is expected to show that private employers added 48K fresh workers, slightly higher than 41K in December. A slight improvement in the job data is unlikely to provide relief to Federal Reserve (Fed) officials, who have been expressing labor market concerns for months.
- The US ISM Services PMI is seen arriving at 53.5, lower than 54.4 in December, indicating that the service sector activity continued to advance but at a moderate pace.
- Upbeat US data would dampen market expectations for an interest rate cut by the Fed in the near term. Currently, traders seem confident that the Fed will leave interest rates unchanged in the range of 3.50%-3.75% in the March policy meeting, according to the CME FedWatch tool.
- Meanwhile, the US government’s partial shutdown has ended as the House advanced the bill to fund federal agencies on Tuesday.
- The US Dollar had a strong rally in the past few trading days, following President Trump’s nomination of Kevin Warsh as the new Fed Chairman. The event was positive for the US Dollar, but unfavorable for precious metals and US equities, given Warsh’s preference for a firmer US Dollar in his previous work at the Fed.
Technical Analysis: USD/INR stays below 20-day EMA
-1770178915500-1770178915501.png&w=1536&q=95)
USD/INR trades marginally lower at around 90.55 as of writing. The pair holds below the 20-day Exponential Moving Average (EMA) at 91.0466, which slopes lower and caps rebound attempts. The declining 20-day EMA keeps the near-term trend tilted lower.
The 14-day Relative Strength Index (RSI) at 44.82 (neutral) slips beneath the midline, confirming waning upside momentum.
A close back above the 20-day EMA would temper bearish pressure and could pave the way for stabilization. Failure to reclaim it, alongside an RSI that stays under 50 or drifts toward 40, would maintain downside risk and keep rallies vulnerable to supply. Momentum would improve only if RSI returns above 50 and price establishes acceptance over the average.
(The technical analysis of this story was written with the help of an AI tool.)
Gold: Strong rebound after sharp declines – UOB

Gold prices rebounded strongly on Tuesday, reversing previous declines. The price rose by US$285.38 (6.1%) to US$4,946.76 per troy ounce. Silver also saw a significant rebound, increasing by US$5.89 (7.4%) to US$85.16 per troy ounce. This recovery comes amid ongoing market dynamics and investor sentiment. UOB Group’s Global Economics & Markets Research Team highlights the importance of gold’s price movements in the current economic landscape.
Gold prices recover from previous lows
“After two sessions of sharp declines, gold price rebounded strongly on Tue. By the end of the session, gold price rose by US$ 285.38 (6.1%) to US$4,946.76/ troy ounce, reversing all of Mon’s decline.”
“Silver also rebounded meaningfully by US$5.89 (7.4%) to US$85.16/troy ounce, just a silver below last Fri’s close but 27% off its peak on 28 Jan.”
“Overall, the trajectory of a weaker USD/Asia is clear and this is in line with the further strengthening of the CNY.”
(This article was created with the help of an Artificial Intelligence tool and reviewed by an editor.)
Australian Dollar holds ground as China’s Services PMI rises in January
The Australian Dollar (AUD) advances against the US Dollar (USD) on Wednesday after registering over 1% gains in the previous session. The AUD/USD pair holds ground after China’s Services Purchasing Managers’ Index (PMI) rose to 52.3 in January from 52.0 in December. This figure came in stronger than the expectations of 51.8. China is a key trading partner of Australia, so any changes in the Chinese economy could impact the AUD.
The AUD rises after the release of seasonally adjusted S&P Global Purchasing Managers’ Index (PMI) data, which showed Australia’s Composite PMI rising to 55.7 in January from 51.0 in December. The expansion was the strongest in 45 months. Meanwhile, Services PMI climbed to 56.3 from 51.1, marking its highest level since February 2022. The reading beat the flash estimate of 56.0 and remained above the 50.0 threshold, extending the run of expanding services activity to two years.
The Reserve Bank of Australia (RBA) raised the Official Cash Rate (OCR) by 25 basis points (bps) to 3.85% on Tuesday, citing stronger-than-expected growth and a sticky inflation outlook. As the tightening cycle begins, markets have lifted the probability of a May hike to 80% and now price in roughly 40 bps of further tightening over the rest of the year.
RBA Governor Michele Bullock said during the post-meeting press conference that inflation pressures remain too strong, warning it will take longer to return to target and is no longer acceptable. She stressed the board will stay data-dependent and avoid forward guidance.
US Dollar moves little after registering recent losses
- The US Dollar Index (DXY), which measures the value of the US Dollar against six major currencies, is remaining subdued for the second successive session and trading near 97.40 at the time of writing.
- Monday’s data showed an unexpected rebound in US factory activity, underscoring economic resilience, as the Institute for Supply Management’s (ISM) Manufacturing Purchasing Managers’ Index (PMI) rose to 52.6 from 47.9 in December, beating market expectations of 48.5.
- US President Donald Trump’s nomination of Kevin Warsh as the next Federal Reserve (Fed) Chair. Markets interpreted Warsh’s appointment as signaling a more disciplined and cautious approach to monetary easing.
- The US Dollar gained traction as risk sentiment improved after the US Senate reached an agreement to advance a government funding package, thereby averting a shutdown, according to Politico.
- US producer-side inflation firmed, moving further away from the Federal Reserve’s 2% target and reinforcing the central bank’s policy stance. US PPI inflation holds steady at 3.0% year-over-year (YoY) in December, unchanged from November and above expectations for a moderation to 2.7%. Core PPI, excluding food and energy, accelerated to 3.3% YoY from 3.0%, defying forecasts for a decline to 2.9% and highlighting persistent upstream price pressures.
- St. Louis Fed President Alberto Musalem said additional rate cuts are not warranted at this stage, characterizing the current 3.50%–3.75% policy rate range as broadly neutral. Similarly, Atlanta Fed President Raphael Bostic urged patience, arguing that monetary policy should remain modestly restrictive.
- Australia’s RBA Trimmed Mean inflation increased to 0.2% month-over-month (MoM) and 3.3% year-over-year (YoY). The monthly CPI rose 1.0% in December, up from 0% previously and above the 0.7% forecast.
- Australia’s export prices rose 3.2% quarter-on-quarter (QoQ) in Q4 2025, rebounding from a 0.9% fall in Q3 and marking the first increase in three quarters, as well as the strongest gain in a year. Meanwhile, import prices climbed 0.9%, beating expectations for a 0.2% decline and reversing a 0.4% drop in Q3.
- China’s RatingDog Manufacturing Purchasing Managers’ Index (PMI) rose to 50.3 in January from 50.1 in December. This figure came in line with the expectations. The latest reading indicated a slight expansion in factory activity, but the fastest growth since last October.
- Australia’s TD-MI Inflation Gauge rose 3.6% year-over-year (YoY) in January, up from 3.5% previously. The Monthly Inflation Gauge increased by 0.2%, slowing sharply from December’s two-year high of 1% and marking the weakest pace since August.
- ANZ Job Advertisements jumped 4.4% month-over-month (MoM) in December 2025, rebounding from a revised 0.8% decline and posting the first increase since July. The rise was also the strongest monthly gain since February 2022, signaling renewed momentum in hiring toward year-end.
Australian Dollar rebounds toward three-year highs near 0.7100
The AUD/USD pair is trading around 0.7030 on Wednesday. Daily chart analysis indicates that the pair remains within the ascending channel pattern, indicating a persistent bullish bias. The 14-day Relative Strength Index (RSI) is at 73.30; it typically signals bullish momentum, but stretching momentum.
The AUD/USD pair rebounded toward 0.7094, the highest level since February 2023, which was recorded on January 29. A break above this level would support the pair to test the upper ascending channel boundary around 0.7210. On the downside, the primary support lies at the nine-day Exponential Moving Average (EMA) of 0.6964, aligned with the lower boundary of the channel. Further declines would expose the 50-day EMA at 0.6759 support.

Australian Dollar Price Today
The table below shows the percentage change of Australian Dollar (AUD) against listed major currencies today. Australian Dollar was the strongest against the Japanese Yen.
| USD | EUR | GBP | JPY | CAD | AUD | NZD | CHF | |
|---|---|---|---|---|---|---|---|---|
| USD | -0.00% | -0.06% | 0.25% | 0.00% | -0.13% | 0.17% | 0.08% | |
| EUR | 0.00% | -0.06% | 0.28% | 0.01% | -0.13% | 0.17% | 0.08% | |
| GBP | 0.06% | 0.06% | 0.32% | 0.07% | -0.07% | 0.23% | 0.14% | |
| JPY | -0.25% | -0.28% | -0.32% | -0.24% | -0.38% | -0.09% | -0.17% | |
| CAD | -0.01% | -0.01% | -0.07% | 0.24% | -0.14% | 0.15% | 0.07% | |
| AUD | 0.13% | 0.13% | 0.07% | 0.38% | 0.14% | 0.30% | 0.22% | |
| NZD | -0.17% | -0.17% | -0.23% | 0.09% | -0.15% | -0.30% | -0.09% | |
| CHF | -0.08% | -0.08% | -0.14% | 0.17% | -0.07% | -0.22% | 0.09% |
The heat map shows percentage changes of major currencies against each other. The base currency is picked from the left column, while the quote currency is picked from the top row. For example, if you pick the Australian Dollar from the left column and move along the horizontal line to the US Dollar, the percentage change displayed in the box will represent AUD (base)/USD (quote).
Australian Dollar FAQs
One of the most significant factors for the Australian Dollar (AUD) is the level of interest rates set by the Reserve Bank of Australia (RBA). Because Australia is a resource-rich country another key driver is the price of its biggest export, Iron Ore. The health of the Chinese economy, its largest trading partner, is a factor, as well as inflation in Australia, its growth rate and Trade Balance. Market sentiment – whether investors are taking on more risky assets (risk-on) or seeking safe-havens (risk-off) – is also a factor, with risk-on positive for AUD.
The Reserve Bank of Australia (RBA) influences the Australian Dollar (AUD) by setting the level of interest rates that Australian banks can lend to each other. This influences the level of interest rates in the economy as a whole. The main goal of the RBA is to maintain a stable inflation rate of 2-3% by adjusting interest rates up or down. Relatively high interest rates compared to other major central banks support the AUD, and the opposite for relatively low. The RBA can also use quantitative easing and tightening to influence credit conditions, with the former AUD-negative and the latter AUD-positive.
China is Australia’s largest trading partner so the health of the Chinese economy is a major influence on the value of the Australian Dollar (AUD). When the Chinese economy is doing well it purchases more raw materials, goods and services from Australia, lifting demand for the AUD, and pushing up its value. The opposite is the case when the Chinese economy is not growing as fast as expected. Positive or negative surprises in Chinese growth data, therefore, often have a direct impact on the Australian Dollar and its pairs.
Iron Ore is Australia’s largest export, accounting for $118 billion a year according to data from 2021, with China as its primary destination. The price of Iron Ore, therefore, can be a driver of the Australian Dollar. Generally, if the price of Iron Ore rises, AUD also goes up, as aggregate demand for the currency increases. The opposite is the case if the price of Iron Ore falls. Higher Iron Ore prices also tend to result in a greater likelihood of a positive Trade Balance for Australia, which is also positive of the AUD.
The Trade Balance, which is the difference between what a country earns from its exports versus what it pays for its imports, is another factor that can influence the value of the Australian Dollar. If Australia produces highly sought after exports, then its currency will gain in value purely from the surplus demand created from foreign buyers seeking to purchase its exports versus what it spends to purchase imports. Therefore, a positive net Trade Balance strengthens the AUD, with the opposite effect if the Trade Balance is negative.
Canadian Dollar crimps two-day losing streak on Tuesday
• The Canadian Dollar found fresh footing on Tuesday, keeping USD/CAD bids below 1.3700.
• Soft Canadian GDP data and falling oil prices weighed on the Loonie, while the Greenback recovered from Fed uncertainty.
• the US House passed $1 trillion spending deal to end partial US shutdown.
The Canadian Dollar (CAD) slowed its recent tumble against the US Dollar (USD) on Tuesday, too weak to push through near-term levels but also not strong enough to break through on the other side. The Loonie has shed ground for three of the last four trading sessions as softer domestic growth signals and renewed US Dollar strength reversed part of January’s rally.
Recent Canadian data showed real Gross Domestic Product (GDP) flat in November, with a third contraction in four months across goods-producing industries led by a deepening slump in manufacturing. The manufacturing sector fell 1.3% month-over-month, with motor vehicles and parts output plunging 6.4% amid a global semiconductor shortage. This underlying weakness underscores that economic momentum remains fragile even as services provide only a limited offset.
House passes spending deal, ends partial shutdown
The US House of Representatives passed a more than $1 trillion spending package on Tuesday by a vote of 217 to 214, bringing an end to the partial government shutdown that began on January 31. The legislation, which had already passed the Senate on Friday, funds several of the government’s largest departments through the end of the fiscal year in September, including the Pentagon, the Department of Health and Human Services, the Department of Transportation, the Department of Education, and the Department of Housing and Urban Development. President Trump endorsed the plan and is expected to sign it immediately.
The deal includes a two-week continuing resolution for the Department of Homeland Security, giving lawmakers more time to negotiate over guardrails on the Trump administration’s immigration enforcement operations. Democratic appropriators praised the final package for staving off deep funding cuts the Trump administration had requested, including a proposed 50% slash to Centers for Disease Control and Prevention funding that was rejected. The resolution of the shutdown removes a source of near-term political uncertainty, though markets remain focused on broader fiscal concerns and upcoming economic data.
Daily digest market movers: CAD retreats as USD rebounds on shutdown resolution
• CAD weakened past 1.36 per USD on Tuesday, extending losses from 16-month highs near
1.35.
• Canadian GDP was flat in November, with manufacturing down 1.3% MoM; Q4 growth likely
contracted 0.1%.
• House passed $1 trillion spending deal (217-214) to end partial shutdown; DHS funded for two
more weeks.
• BoC held rates at 2.25% on January 28, citing elevated uncertainty around CUSMA
renegotiations.
• US ISM Manufacturing PMI surged to 52.6 in January, the first expansion in 12 months.
• DXY climbed toward 97.7 after Trump nominated Kevin Warsh as next Fed chair.
• WTI Crude Oil fell to $62/barrel as US-Iran talks eased geopolitical risk premium.
Canadian Dollar price forecast
USD/CAD opened near 1.3670 on Tuesday, rebounding from the recent low near 1.3490 touched late last week. The pair has recovered sharply after testing sixteen-month lows, with the bounce gaining momentum as the Greenback finds renewed support. Price action has pushed back above the 50-day Exponential Moving Average (EMA), which sits near 1.37, signaling a potential shift in short-term momentum.
Support at 1.35, resistance at 1.39
The 200-day EMA at approximately 1.39 represents the next key resistance level, with a sustained break above this threshold needed to suggest a more meaningful reversal of the recent downtrend. On the downside, support is seen near the recent lows around 1.3490-1.3500, with a break below opening the door toward 1.3400. The Relative Strength Index (RSI) has rebounded from oversold territory and sits in the mid-40s, indicating neutral conditions with room for the pair to move in either direction.
Near-term bias tilts modestly higher
With Canadian fundamentals remaining soft and the US Dollar regaining traction on Fed uncertainty and strong economic data, the near-term bias for USD/CAD tilts modestly higher. The resolution of the partial US government shutdown removes one source of uncertainty, though markets remain focused on the upcoming CUSMA renegotiations and US labor market data. A sustained move above 1.3775-1.3800 would confirm renewed bullish momentum, while a failure to hold above the 50-day EMA could see the pair drift back toward multi-month lows.
USD/CAD daily chart

Canadian Dollar FAQs
The key factors driving the Canadian Dollar (CAD) are the level of interest rates set by the Bank of Canada (BoC), the price of Oil, Canada’s largest export, the health of its economy, inflation and the Trade Balance, which is the difference between the value of Canada’s exports versus its imports. Other factors include market sentiment – whether investors are taking on more risky assets (risk-on) or seeking safe-havens (risk-off) – with risk-on being CAD-positive. As its largest trading partner, the health of the US economy is also a key factor influencing the Canadian Dollar.
The Bank of Canada (BoC) has a significant influence on the Canadian Dollar by setting the level of interest rates that banks can lend to one another. This influences the level of interest rates for everyone. The main goal of the BoC is to maintain inflation at 1-3% by adjusting interest rates up or down. Relatively higher interest rates tend to be positive for the CAD. The Bank of Canada can also use quantitative easing and tightening to influence credit conditions, with the former CAD-negative and the latter CAD-positive.
The price of Oil is a key factor impacting the value of the Canadian Dollar. Petroleum is Canada’s biggest export, so Oil price tends to have an immediate impact on the CAD value. Generally, if Oil price rises CAD also goes up, as aggregate demand for the currency increases. The opposite is the case if the price of Oil falls. Higher Oil prices also tend to result in a greater likelihood of a positive Trade Balance, which is also supportive of the CAD.
While inflation had always traditionally been thought of as a negative factor for a currency since it lowers the value of money, the opposite has actually been the case in modern times with the relaxation of cross-border capital controls. Higher inflation tends to lead central banks to put up interest rates which attracts more capital inflows from global investors seeking a lucrative place to keep their money. This increases demand for the local currency, which in Canada’s case is the Canadian Dollar.
Macroeconomic data releases gauge the health of the economy and can have an impact on the Canadian Dollar. Indicators such as GDP, Manufacturing and Services PMIs, employment, and consumer sentiment surveys can all influence the direction of the CAD. A strong economy is good for the Canadian Dollar. Not only does it attract more foreign investment but it may encourage the Bank of Canada to put up interest rates, leading to a stronger currency. If economic data is weak, however, the CAD is likely to fall.
Gold rebounds after sharp correction, eyes $5,000 resistance
Gold (XAU/USD) climbs more than 5% on Tuesday as dip buyers step back into the market following last week’s violent correction from record highs near $5,600. At the time of writing, XAU/USD is hovering near $4,980, recovering after slipping to near four-week lows around $4,402 on Monday.
The sharp sell-off was largely technical in nature, driven by position unwinding and margin-related liquidation rather than clear deterioration in fundamentals. The broader backdrop for Bullion remains supportive, while Tuesday’s rebound highlights still-elevated volatility across the precious-metals space, with Silver up nearly 10% on the day.
That said, Gold may consolidate in the near term in the absence of fresh catalysts, while tentative signs of easing tensions between the US and Iran could temper safe-haven demand. At the same time, renewed strength in the US Dollar (USD) may cap the upside in XAU/USD.
Market movers: US-Iran tensions ease, US-India trade deal announced, DXY rebounds
- Signs of easing US-Iran tensions emerge after Iranian President Masoud Pezeshkian said on Tuesday that he had instructed his foreign minister to “pursue fair and equitable negotiations” with the United States, with the two sides reportedly preparing to send senior envoys to Istanbul later this week for talks on Iran’s nuclear programme. The comments follow remarks from US President Donald Trump that Iran is “seriously talking”.
- US President Trump announced on Monday that the United States and India have agreed on a trade deal under which US tariffs on Indian goods will be reduced from around 50% to about 18%, while India will step up purchases of US products, with commitments that could reach up to $500 billion.
- US economic data flow has thinned after the Bureau of Labor Statistics said on Monday that the January Employment Situation report due on Friday will be delayed because of the partial government shutdown, with the JOLTS report also postponed.
- The US Dollar Index (DXY), which tracks the Greenback’s value against a basket of six major currencies, is trading near one-week highs around 97.40, recovering after slipping to four-year lows last week.
- The rebound in the Greenback comes after markets welcomed US President Donald Trump’s nomination of former Federal Reserve Governor Kevin Warsh as the next Fed Chair. Warsh, who is widely viewed as an inflation hawk, has helped ease market concerns about the risk of aggressive rate cuts under political pressure.
- Upbeat US manufacturing data has reinforced the view that the Fed can afford to remain patient before resuming monetary policy easing. The Institute for Supply Management (ISM) Manufacturing Purchasing Managers Index (PMI) jumped to 52.6 in January from 47.9 in December, comfortably beating market expectations of 48.5, while the S&P Global Manufacturing PMI edged higher to 52.4 from 51.9.
Technical analysis: Uptrend intact despite elevated volatility
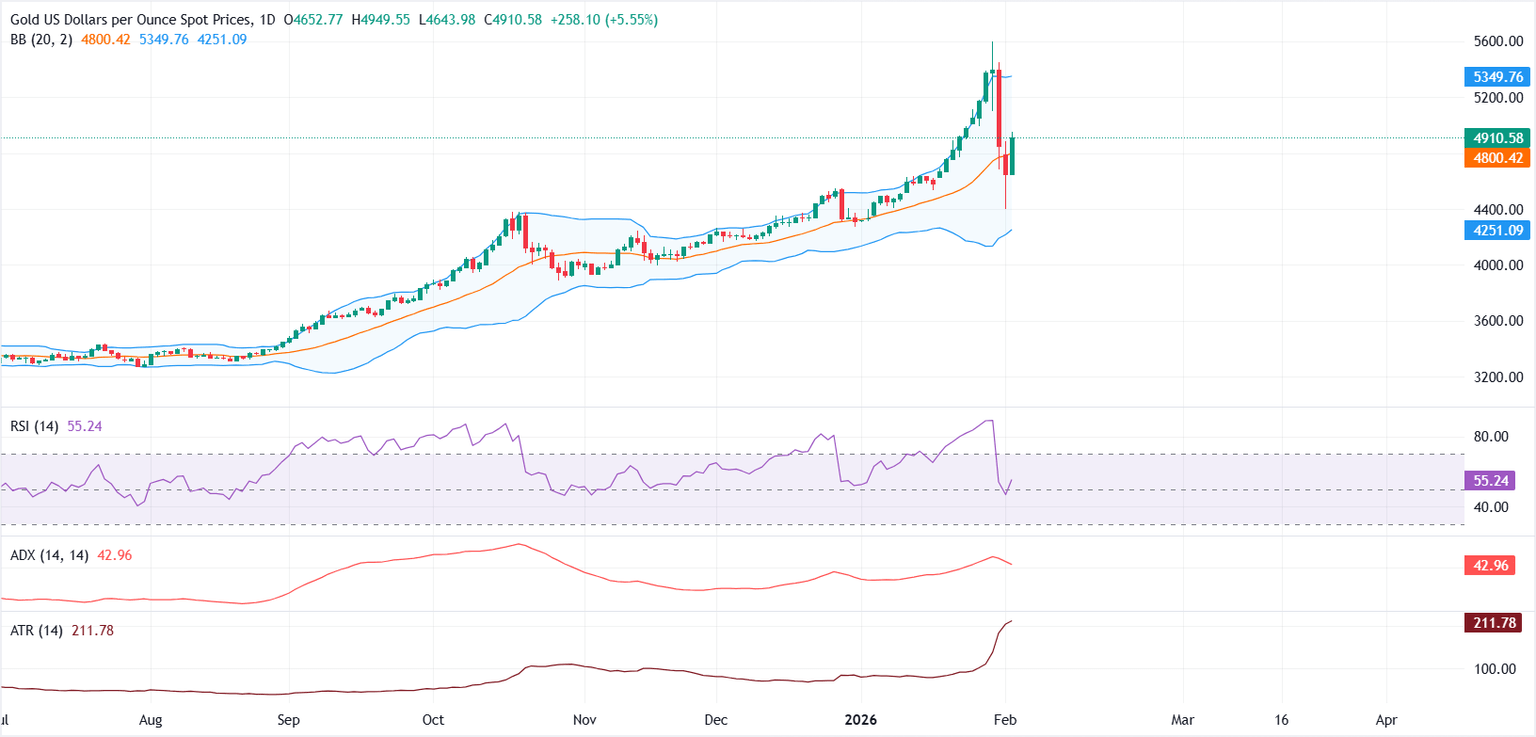
From a technical perspective, the broader uptrend on the daily chart remains intact. Price is holding above the 20-day Simple Moving Average (SMA), which also represents the middle Bollinger Band, near $4,800, keeping the short-term trend structure constructive despite the sharp and volatile correction from last week’s peak.
Bollinger Bands are widening and the Average True Range (ATR) has surged to around 212, signalling elevated volatility. Momentum indicators have also started to recover. The Relative Strength Index (RSI) stands near 55, rebounding from sub-50 territory and pointing to improving bullish momentum.
At the same time, the trend remains strong, with the Average Directional Index (ADX) elevated around 43, although the indicator is beginning to roll over from recent highs, suggesting the strength of the trend is easing rather than accelerating.
On the upside, the $5,000 psychological level marks the immediate resistance, followed by the upper Bollinger Band near $5,350. On the downside, a break below the middle Bollinger Band would expose initial support around $4,500, followed by Monday’s low near $4,402. A deeper cushion is located at the lower Bollinger Band around $4,250.
Gold FAQs
Gold has played a key role in human’s history as it has been widely used as a store of value and medium of exchange. Currently, apart from its shine and usage for jewelry, the precious metal is widely seen as a safe-haven asset, meaning that it is considered a good investment during turbulent times. Gold is also widely seen as a hedge against inflation and against depreciating currencies as it doesn’t rely on any specific issuer or government.
Central banks are the biggest Gold holders. In their aim to support their currencies in turbulent times, central banks tend to diversify their reserves and buy Gold to improve the perceived strength of the economy and the currency. High Gold reserves can be a source of trust for a country’s solvency. Central banks added 1,136 tonnes of Gold worth around $70 billion to their reserves in 2022, according to data from the World Gold Council. This is the highest yearly purchase since records began. Central banks from emerging economies such as China, India and Turkey are quickly increasing their Gold reserves.
Gold has an inverse correlation with the US Dollar and US Treasuries, which are both major reserve and safe-haven assets. When the Dollar depreciates, Gold tends to rise, enabling investors and central banks to diversify their assets in turbulent times. Gold is also inversely correlated with risk assets. A rally in the stock market tends to weaken Gold price, while sell-offs in riskier markets tend to favor the precious metal.
The price can move due to a wide range of factors. Geopolitical instability or fears of a deep recession can quickly make Gold price escalate due to its safe-haven status. As a yield-less asset, Gold tends to rise with lower interest rates, while higher cost of money usually weighs down on the yellow metal. Still, most moves depend on how the US Dollar (USD) behaves as the asset is priced in dollars (XAU/USD). A strong Dollar tends to keep the price of Gold controlled, whereas a weaker Dollar is likely to push Gold prices up.
Banxico: Policy rate pause expected – Rabobank

Rabobank analysts, Molly Schwartz and Christian Lawrence, anticipate that Banxico will hold the policy rate at 7.00% during the February 5 meeting. This expectation is shared unanimously among Bloomberg surveyed analysts. They also foresee two additional 25bp cuts in 2026, bringing the overnight policy rate to a terminal level of 6.50%.
Anticipation of Banxico’s next move
“We expect Banxico to hold the policy rate at 7.00% at the February 5 meeting, which would mark the first pause after 12 consecutive cuts. This view is held unanimously amongst Bloomberg surveyed analysts, including ourselves.”
“We foresee at least two more 25bp cuts from Banxico in 2026, to bring the overnight policy rate to a terminal level of 6.50%.”
“In the most recent monetary policy statement, the Bank adjusted the language from ‘the Board will evaluate reducing the reference rate’ to ‘the Board will evaluate the timing for additional reference rate adjustments,’ potentially hinting at a future pause.”
(This article was created with the help of an Artificial Intelligence tool and reviewed by an editor.)
USD: Positive outlook amid strong data – Deutsche Bank

Deutsche Bank’s Macro Strategy report highlights a positive outlook for the Dollar following strong economic data. The report notes that the ISM manufacturing index unexpectedly surged, contributing to rising optimism for 2026. The Dollar Index increased by 0.66%, marking its best two-day performance since last spring.
Dollar strengthens on positive economic signals
“One of the clearest reactions to the ISM was in US Treasury markets, with yields moving higher as investors priced out the chance of Fed rate cuts. For instance, futures had been pricing in an 87% chance of another rate cut by the June FOMC (which would be Warsh’s first as Chair if confirmed), but that was down to 70% by the close.”
“Higher yields supported the dollar index (+0.66%), which has had its best two-day run since last spring.”
(This article was created with the help of an Artificial Intelligence tool and reviewed by an editor.)
Australia RBA Interest Rate Decision meets expectations (3.85%)
Gold stages a comeback in Asian trades on Tuesday, after having found brief support near $4,650. The US Dollar uptrend stalls amid US-Iran de-escalation, easing US-India trade tensions and data disruption. Gold fails to close Monday above the 21-day SMA, but RSI recaptures the midline on the daily chart.
South Korea Consumer Price Index Growth (YoY) registered at 2%, below expectations (2.1%) in January
GBP/USD adds to Friday’s losses, reaching six-day lows near 1.3620, although regaining some composure soon afterwards. Indeed, Cable’s pullback comes amid the ongoing solid performance of the Greenback, while traders also begin to turn their attention to the upcoming BoE meeting.