Bitcoin edges up above $65,000 at the time of writing on Friday, as dust from the recent macro-triggered sell-off settles. The leading altcoin, Ethereum, hovers above $1,900, but resistance at $2,000 caps the upside. Meanwhile, Ripple has recorded the largest intraday jump among the three assets, up over 10% to $1.35.
Silver rebounds sharply on safe-haven demand, rate cut expectations

Silver (XAG/USD) trades firmly higher on Friday and hovers around $76.20 at the time of writing, posting gains of 3.50% on the day. After coming under pressure earlier in the day, the white metal attracts dip buyers amid a renewed shift toward safe-haven assets and revived speculation about a more accommodative US monetary policy.
The return of risk aversion across global markets boosts demand for precious metals, as investors remain attentive to geopolitical tensions and sensitive diplomatic discussions involving the United States (US). At the same time, signs of weakness in the US labor market strengthen expectations of interest rate cuts by the Federal Reserve (Fed), a factor that is structurally supportive for non-yielding assets such as Silver.
Recent US data released this week highlight a less robust employment dynamic, reinforcing bets on an easier monetary stance. This outlook lowers the opportunity cost of holding Silver and supports prices, especially as some investors seek to diversify their exposure to precious metals beyond Gold.
That said, the upside potential for Silver remains partially capped by the resilience of the US Dollar (USD), which retains part of its recent gains. A firmer US Dollar tends to make dollar-denominated metals more expensive for international buyers, prompting some caution despite the positive intraday bias.
Overall, the combination of safe-haven demand, expectations of rate cuts by the Federal Reserve and speculative interest keeps Silver firmly underpinned, even as movements in the US Dollar remain a key factor to watch going forward.
Silver FAQs
Silver is a precious metal highly traded among investors. It has been historically used as a store of value and a medium of exchange. Although less popular than Gold, traders may turn to Silver to diversify their investment portfolio, for its intrinsic value or as a potential hedge during high-inflation periods. Investors can buy physical Silver, in coins or in bars, or trade it through vehicles such as Exchange Traded Funds, which track its price on international markets.
Silver prices can move due to a wide range of factors. Geopolitical instability or fears of a deep recession can make Silver price escalate due to its safe-haven status, although to a lesser extent than Gold’s. As a yieldless asset, Silver tends to rise with lower interest rates. Its moves also depend on how the US Dollar (USD) behaves as the asset is priced in dollars (XAG/USD). A strong Dollar tends to keep the price of Silver at bay, whereas a weaker Dollar is likely to propel prices up. Other factors such as investment demand, mining supply – Silver is much more abundant than Gold – and recycling rates can also affect prices.
Silver is widely used in industry, particularly in sectors such as electronics or solar energy, as it has one of the highest electric conductivity of all metals – more than Copper and Gold. A surge in demand can increase prices, while a decline tends to lower them. Dynamics in the US, Chinese and Indian economies can also contribute to price swings: for the US and particularly China, their big industrial sectors use Silver in various processes; in India, consumers’ demand for the precious metal for jewellery also plays a key role in setting prices.
Silver prices tend to follow Gold’s moves. When Gold prices rise, Silver typically follows suit, as their status as safe-haven assets is similar. The Gold/Silver ratio, which shows the number of ounces of Silver needed to equal the value of one ounce of Gold, may help to determine the relative valuation between both metals. Some investors may consider a high ratio as an indicator that Silver is undervalued, or Gold is overvalued. On the contrary, a low ratio might suggest that Gold is undervalued relative to Silver.
Crypto Today: Bitcoin, Ethereum, XRP rebound amid risk-off, $2.6 billion liquidation wave
Bitcoin (BTC) edges up above $65,000 at the time of writing on Friday, as dust from the recent macro-triggered sell-off settles. The leading altcoin, Ethereum (ETH), hovers above $1,900, but resistance at $2,000 caps the upside. Meanwhile, Ripple (XRP) has recorded the largest intraday jump among the three assets, up over 10% to $1.35.
Macro headwinds and risk-off sentiment could limit Bitcoin, Ethereum and XRP recovery
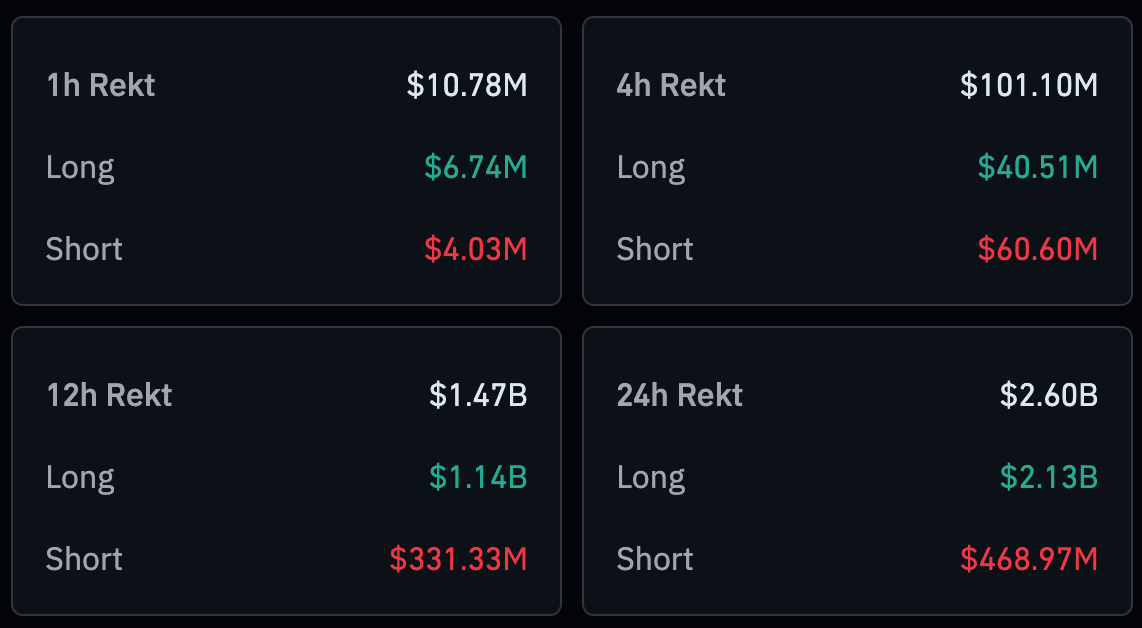
Bitcoin briefly hit $60,000 earlier in the day, as a persistent macro-triggered bearish wave criss-crossed the broader crypto market. The derivatives market reflected the drawdowns with total 24-hour liquidations reaching $2.6 billion on Friday.
Long position holders bore the biggest brunt of the sell-off, losing $2.13 billion compared to $469 million in short positions. Despite suffering massive liquidations, Bitcoin, Ethereum, and XRP are showing subtle signs of recovery, which may offer relief to investors who remain underwater.
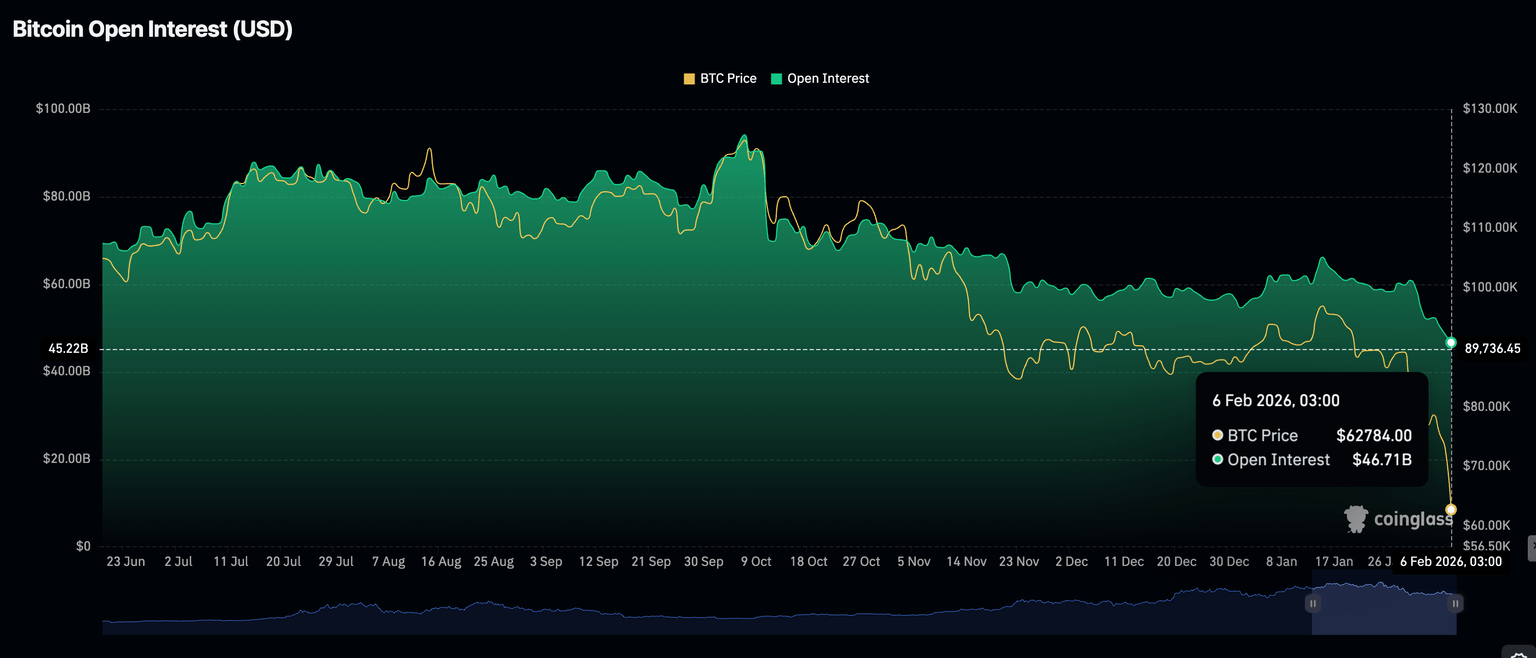
Bitcoin futures Open Interest (OI) extends its downtrend to approximately $47 billion, for the first time since mid-March, as retail investors aggressively closed open positions. The OI averaged $48.5 billion on Thursday, emphasizing the overextended price correction. If sentiment fails to improve, traders may refrain from increasing risk exposure, reducing the much-needed buying pressure to sustain an uptrend.
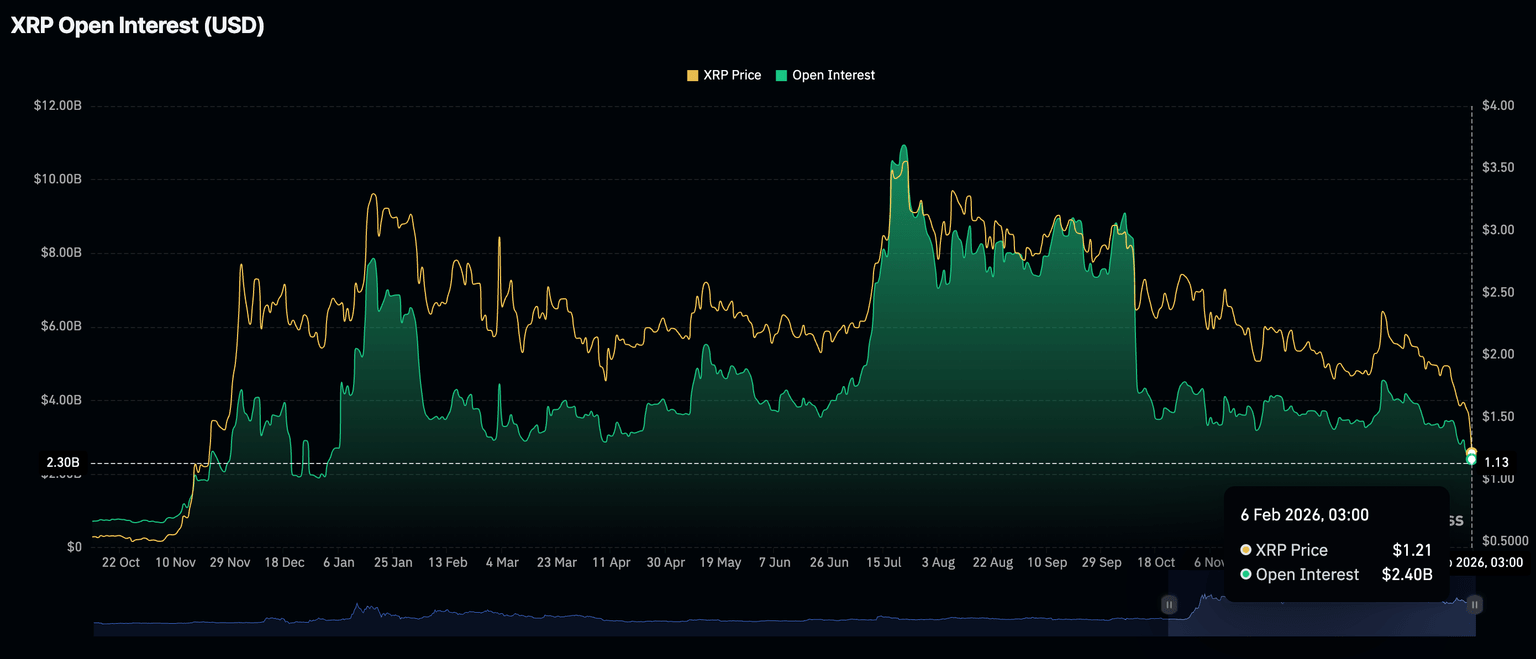
Similarly, the XRP derivatives market weakened further, as futures OI drops to $2.4 billion on Friday, for the first time in a year, from $2.57 billion the previous day. OI represents the notional value of outstanding futures contracts; hence, a persistent decline suggests that investors lack confidence in XRP’s ability to sustain an uptrend.
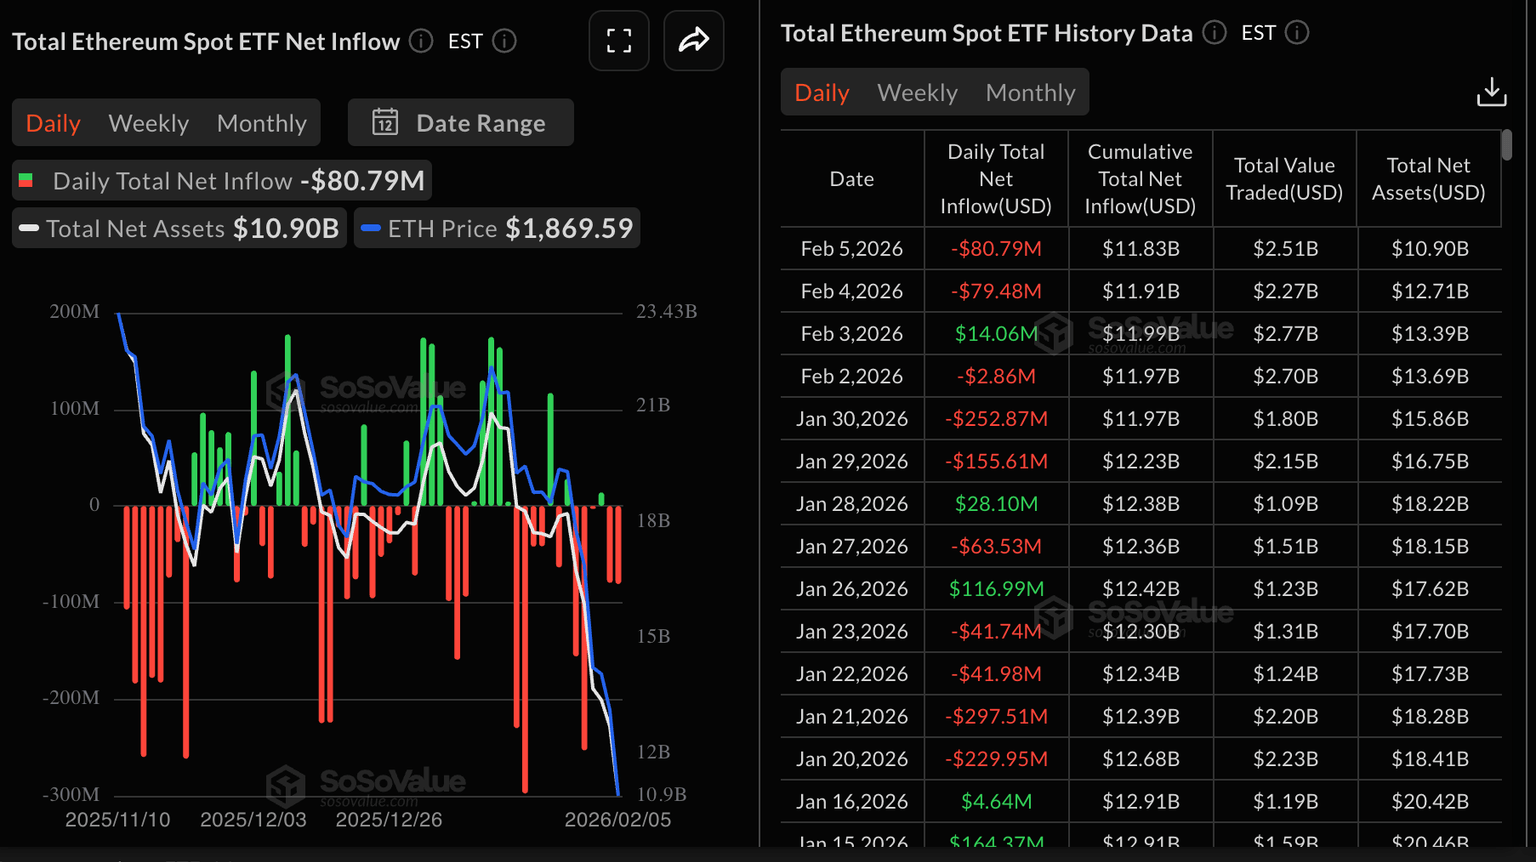
Ethereum, on the other hand, saw increased outflows from spot Exchange-Traded Funds (ETFs). According to SoSoValue data, institutional investors withdrew nearly $81 million on Thursday, marking the second consecutive day of outflows. As a result, cumulative inflows have declined to $11.83 billion, while net assets under management stand at $10.9 billion.
Meanwhile, XRP ETFs recorded modest inflows of $1.28 million on Thursday, down from $ 4.8 million the previous day. Although minor, this marks three consecutive days of inflows, bringing cumulative inflows to $1.21 billion and net assets under management to approximately $888 million.
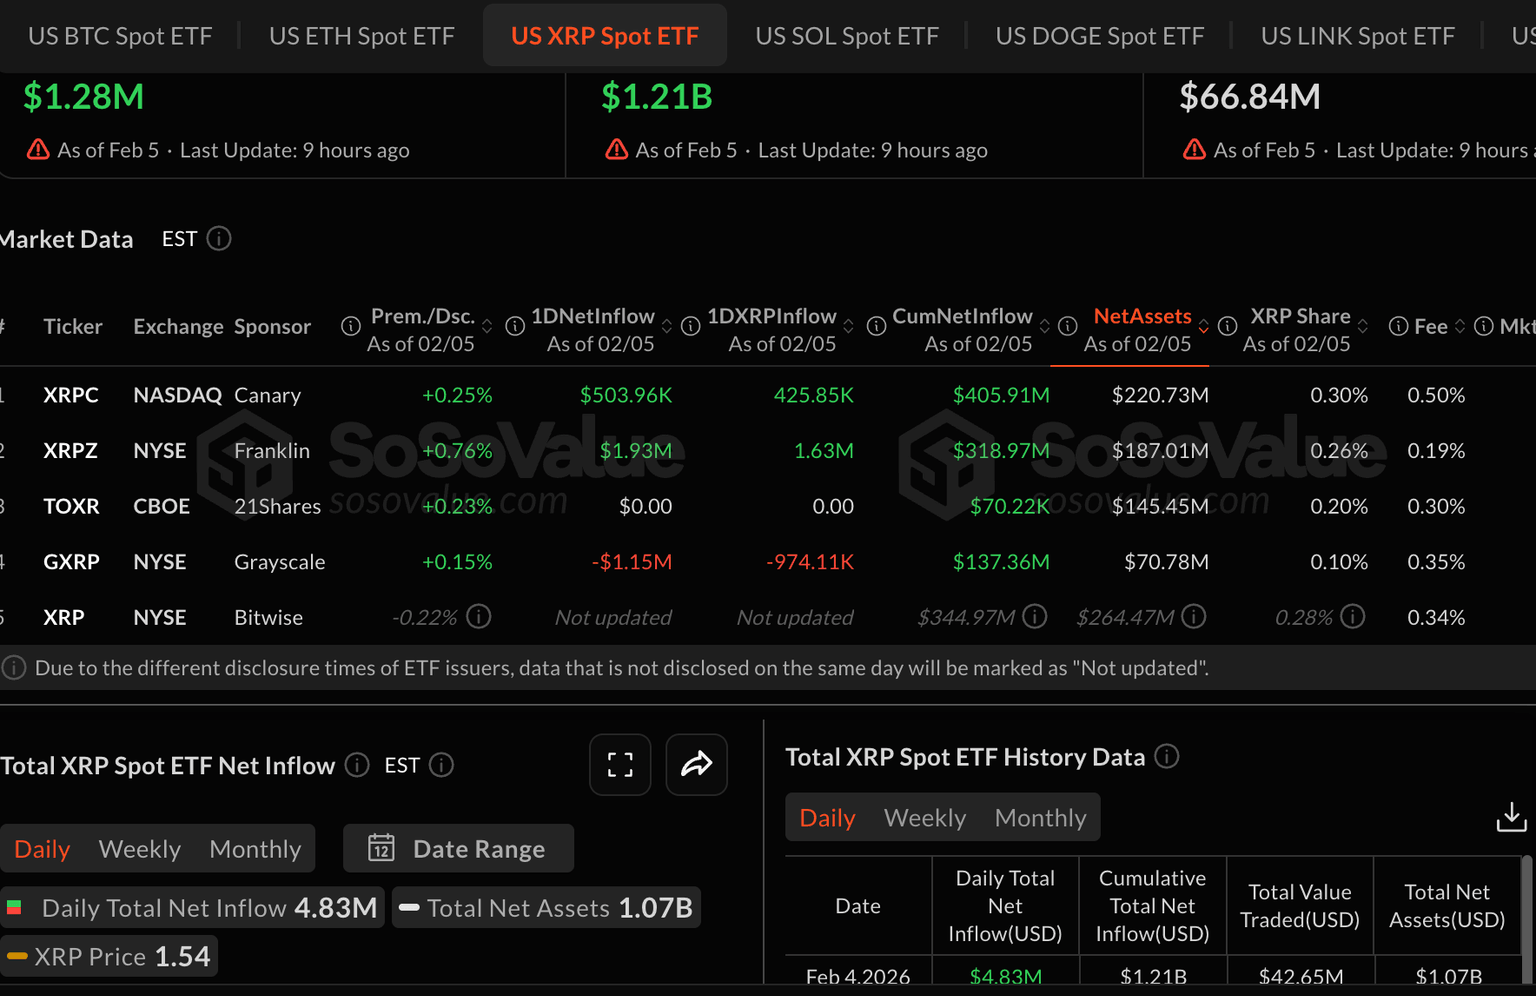
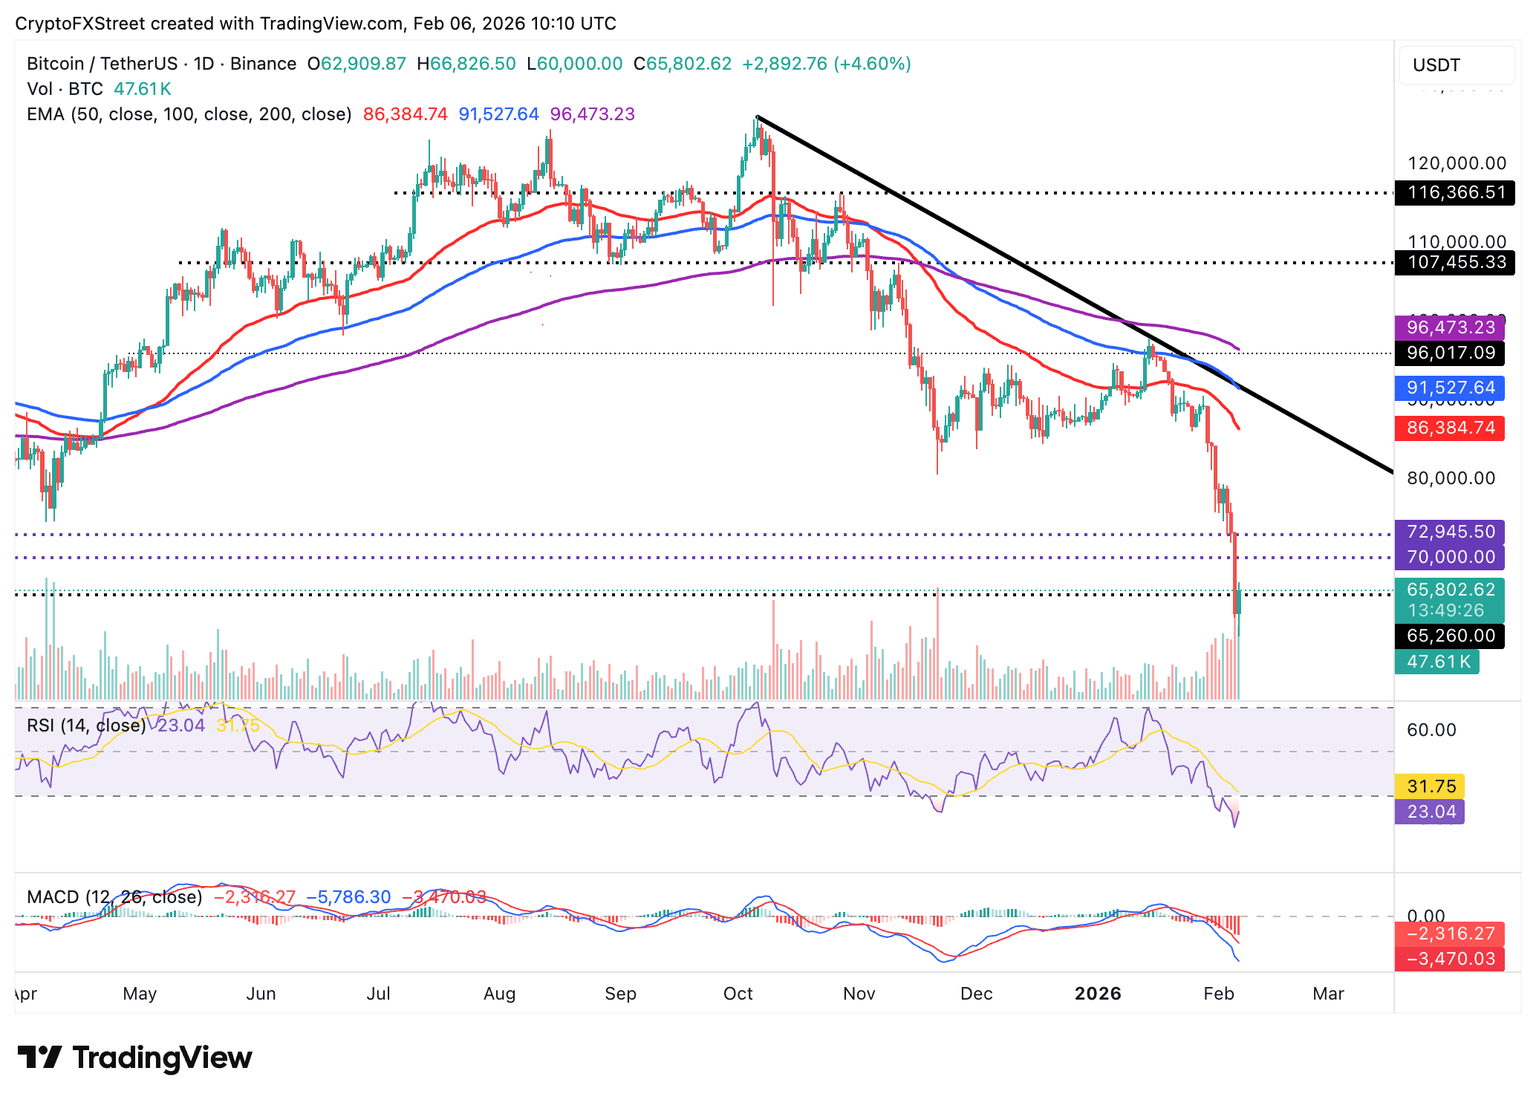
Chart of the day: Can Bitcoin sustain its recovery?
Bitcoin has bounced from the $60,000 intraday low and is currently trading above $65,000 at the time of writing on Friday. The Relative Strength Index (RSI) at 23 on the daily chart points upward, suggesting bearish momentum may be easing, opening the door to an extended rebound.
Meanwhile, the Moving Average Convergence Divergence (MACD) indicator remains overextended below its signal line, confirming the overall bearish outlook.
Still, traders should be on the lookout for the red histogram bars contracting, which may boost bullish bets and lead to a lasting recovery. Key milestones include the supply zone at $70,000 on the upside, but if volatility spikes, the $60,000 level on the downside.
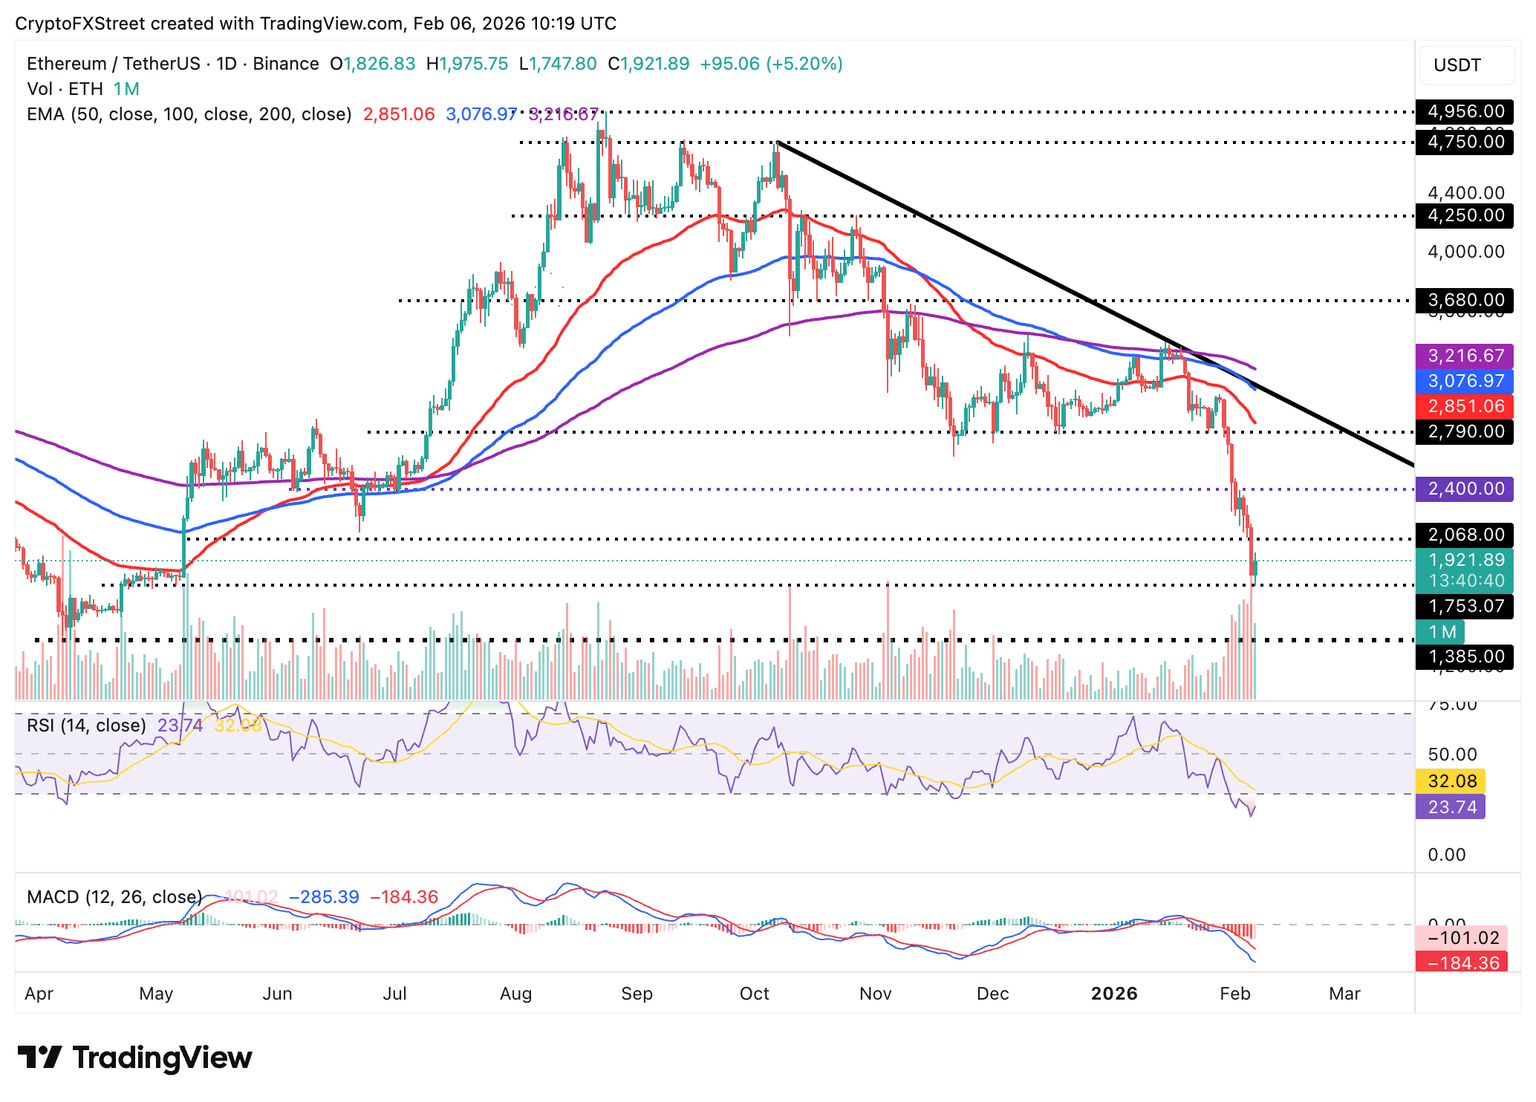
Altcoins technical outlook: Ethereum, XRP poised to tighten grip
Ethereum rises above $1,900, signaling growing investor interest amid the crash. The leading smart contracts token by market capitalization has the RSI rising to 24 on the daily chart. A further increase in the RSI would boost Ethereum’s recovery potential above the next key resistance at $2,000.
However, since the MACD indicator sits below the signal line on the same chart, bearish momentum remains apparent and may cap gains. The red histogram bars should continue to contract, encouraging investors to lean into risk and support Ethereum’s recovery outlook.
Overall, the dominant momentum is bearish as shown by the downtrending 50-day Exponential Moving Average (EMA) at $2,851, the 100-day EMA at $3,077 and the 200-day EMA at $3,217. Therefore, traders should not lose sight of the intraday low at $1,748, which is poised to provide support and prevent losses toward the April 9 low at $1,385.
As for XRP, bulls continue to push the price above $1.35, supported by the RSI, which is rising to 28 in oversold territory. This knee-jerk recovery follows an intraday low tested at $1.12, relieving battered traders from losses incurred during Thursday’s aggressive sell-off from $1.51.
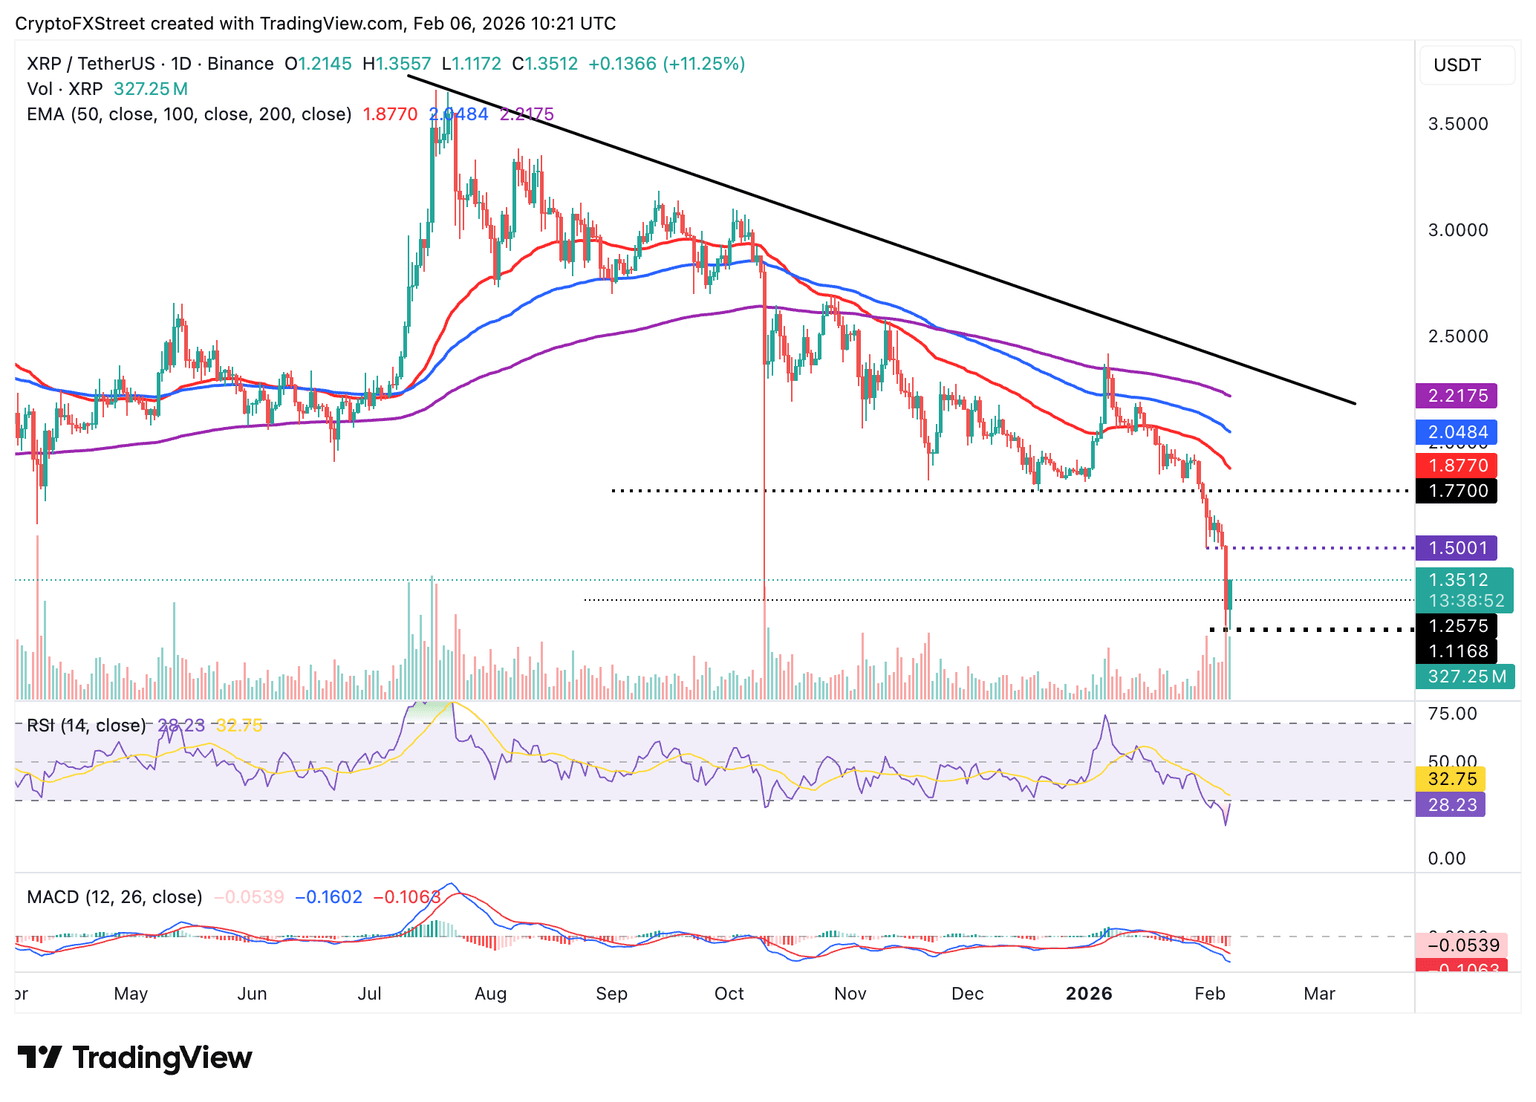
Despite the intraday gains, the MACD indicator remains bearish below its signal line. A bullish crossover of the blue MACD line above the red signal line would reinforce the bullish grip. A reversal above $1.51 would erase Thursday’s drawdown and set XRP on a recovery path toward $1.77 and the $2.00 round level.
Open Interest, funding rate FAQs
Spain Industrial Output Cal Adjusted (YoY): -0.3% (December) vs previous 4.5%
Bitcoin, Ethereum and Ripple slip to multi-month lows, erasing all gains since crypto-friendly candidate Donald Trump won the US presidential election in November 2024. BTC hits a low of $60,000 on Friday, while ETH nosedives to $1,750 and XRP to $1.11.
Silver Price Forecast: XAG/USD tumbles below $72.00 as safe-haven appeal fades
Silver price (XAG/USD) slumps to around $71.90, the lowest since January 2, during the Asian trading hours on Friday. The white metal extends the decline amid easing geopolitical tensions and profit-taking. Traders will closely monitor the upcoming US-Iran talks later on Friday.
A reduction in tensions between the United States (US) and Iran weakens the safe-haven demand for precious metals. Iran aims to focus talks on its long-standing nuclear dispute with Western powers, while the US wants the agenda to include Tehran’s ballistic missile program, its alleged backing of armed groups across the Middle East, and its domestic human rights record.
Analysts believe that speculative flows, leveraged positioning, and options-driven trading, rather than physical demand, are the primary drivers of recent price movements. “You’d seen a lot of speculator positions build up … I don’t think it’s been fully flushed out,” said Sunil Garg, managing director of Lighthouse Canton.
On the other hand, signs of a weakening US labor market could undermine the US Dollar (USD) and support the USD-denominated commodity price in the near term. The US Bureau of Labor Statistics revealed on Wednesday that US job openings unexpectedly fell in December to the lowest level since 2020, and layoffs rose. Furthermore, applications for US unemployment benefits rose by more than forecast last week.
Silver FAQs
Silver is a precious metal highly traded among investors. It has been historically used as a store of value and a medium of exchange. Although less popular than Gold, traders may turn to Silver to diversify their investment portfolio, for its intrinsic value or as a potential hedge during high-inflation periods. Investors can buy physical Silver, in coins or in bars, or trade it through vehicles such as Exchange Traded Funds, which track its price on international markets.
Silver prices can move due to a wide range of factors. Geopolitical instability or fears of a deep recession can make Silver price escalate due to its safe-haven status, although to a lesser extent than Gold’s. As a yieldless asset, Silver tends to rise with lower interest rates. Its moves also depend on how the US Dollar (USD) behaves as the asset is priced in dollars (XAG/USD). A strong Dollar tends to keep the price of Silver at bay, whereas a weaker Dollar is likely to propel prices up. Other factors such as investment demand, mining supply – Silver is much more abundant than Gold – and recycling rates can also affect prices.
Silver is widely used in industry, particularly in sectors such as electronics or solar energy, as it has one of the highest electric conductivity of all metals – more than Copper and Gold. A surge in demand can increase prices, while a decline tends to lower them. Dynamics in the US, Chinese and Indian economies can also contribute to price swings: for the US and particularly China, their big industrial sectors use Silver in various processes; in India, consumers’ demand for the precious metal for jewellery also plays a key role in setting prices.
Silver prices tend to follow Gold’s moves. When Gold prices rise, Silver typically follows suit, as their status as safe-haven assets is similar. The Gold/Silver ratio, which shows the number of ounces of Silver needed to equal the value of one ounce of Gold, may help to determine the relative valuation between both metals. Some investors may consider a high ratio as an indicator that Silver is undervalued, or Gold is overvalued. On the contrary, a low ratio might suggest that Gold is undervalued relative to Silver.
South Korea Current Account Balance up to 18.7B in December from previous 12.24B
Gold is back under pressure on Thursday, slipping back towards the $4,800 region per troy ounce. A firmer US Dollar is weighing on the yellow metal, even as the broader mood remains risk off. That said, falling US Treasury yields across the curve are helping to cushion the downside and, for now at least, are limiting the depth of the pullback.
Gold slides nearly 2% as US Dollar strength triggers fresh liquidation
Gold price (XAU/USD) tumbles during the North American session on Thursday as precious metals continue their liquidation mode, while the Greenback recovers some ground amid worse-than-expected economic data in the US. Two major central banks held rates unchanged, yet the Bank of England (BoE) signals that further easing is coming. At the time of writing, XAU/USD trades at $4,880, down 1.75%.
XAU/USD extends losses despite weak US labor data as profit-taking and central bank signals favor the Greenback
Broad US Dollar strength and traders booking profits sent the precious metals diving for the second consecutive day day. The European Central Bank (ECB) and the BoE maintained the status quo, with the former set to remain on hold, while the latter is poised to reduce rates twice in 2026.
Data in the United States (US) revealed weakness in the labor market. The Job Openings and Labor Turnover Survey (JOLTS) report for December revealed a low hiring environment. Jobless Claims for the previous week exceeded estimates, while the Challenger Job Cuts for January rose sharply, indicating companies are reducing their workforce.
Given the backdrop, Bullion prices should be higher, but the Greenback remains strong for the second straight day.
Recently, Atlanta Federal Reserve (Fed) President Raphael Bostic said that inflation is too high for too long, and that the Fed is going to do its job well, as it has to think about issues over the long run.
Aside from this, the US Treasury Secretary Scott Bessent said that whether to sue Kevin Warsh over Fed rates policy is up to US President Trump, and added that he does not favor 0% tariffs on Canada, following their deal with China.
Daily market movers: US Dollar advances amid soft US jobs data
- The US Challenger, Gray & Christmas report showed that companies announced 108.435K layoffs in January, marking a 118% increase from a year earlier, while hiring intentions fell by 13%.
- Initial Jobless Claims released by the Department of Labor rose sharply to 231K in the week ending January 31, missing expectations of 212K.
- The Job Openings and Labor Turnover Survey (JOLTS) for December underscored growing caution among employers, with job openings dropping to 6.542 million from 6.928 million in November, well below forecasts of 7.2 million.
- Despite this, the US Dollar Index (DXY), which measures the buck’s performance against six currencies, is up 0.11% at 97.75, a headwind for Gold and Silver prices.
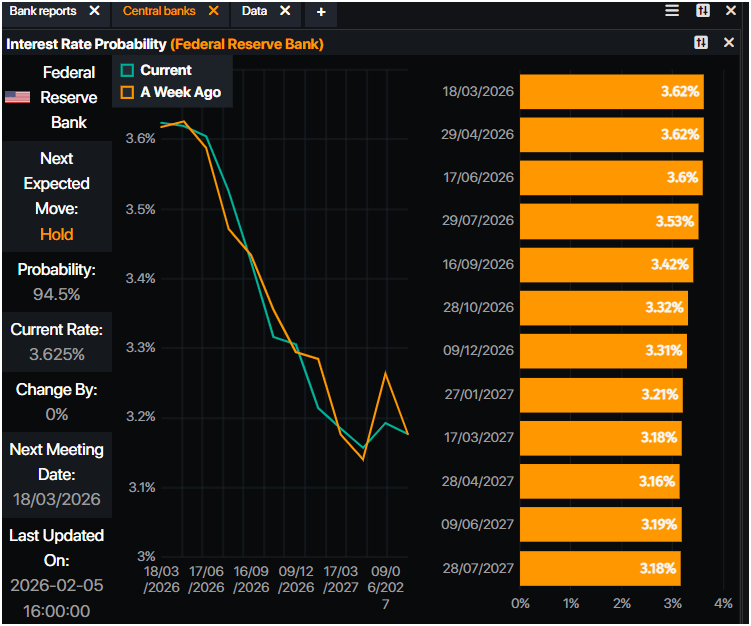
- Contrarily, US Treasury bond yields are plunging. The US 10-year Treasury note yield is dropping six basis points to 4.183% as investors grow confident that the Federal Reserve will ease at least twice in 2025.
- Money markets ramped up expectations from 50 to 56 basis points of Fed easing towards the year-end, according to Prime Market Terminal data.
- Easing geopolitical tensions weighed on Gold prices. Russia and Ukraine agreed to a major prisoner swap after sustaining talks between both countries and the US. On Wednesday, US President Donald Trump revealed that he had a good call with the Chinese President Xi Jinping.
- Eyes are also on the resumption of US-Iran talks in Oman, on Friday.
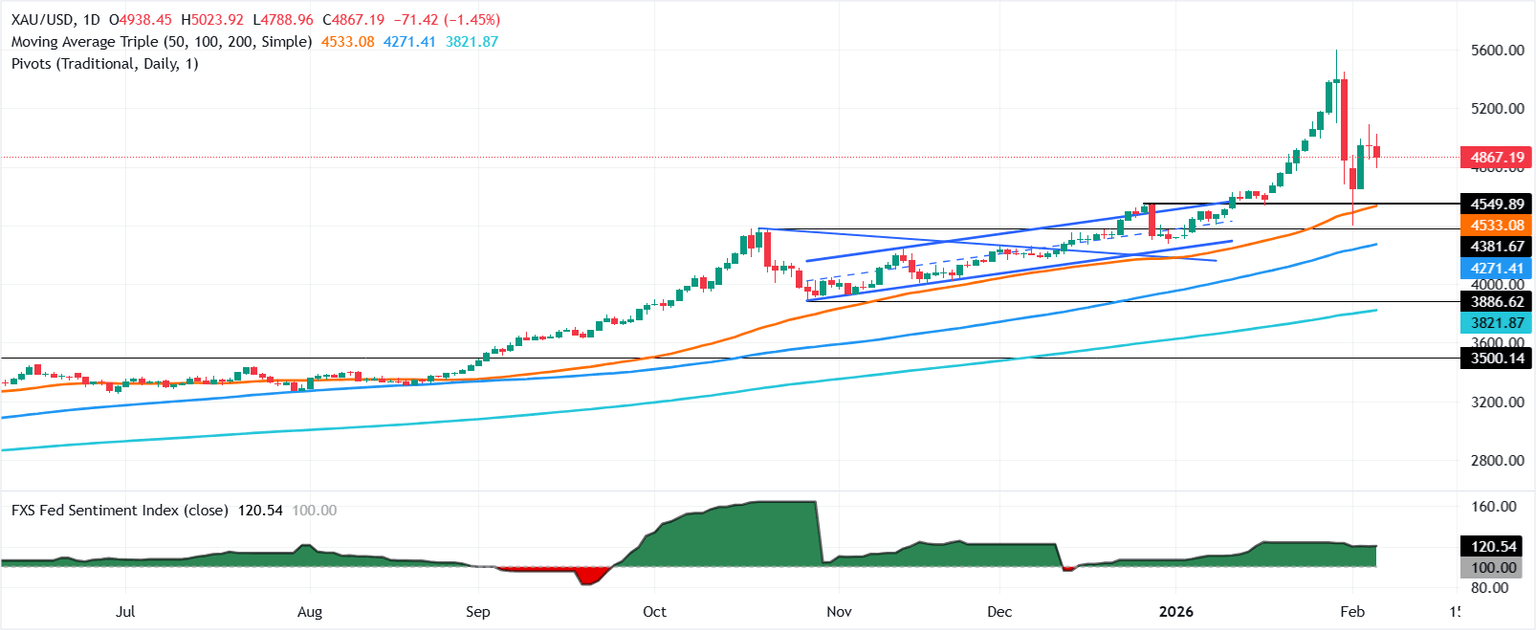
Technical outlook: Gold retreats towards $4,800 as buyers take a breather
Gold’s uptrend continues on the daily chart, but recent volatility calls for caution in the short term. Bulls seem to have lost momentum as depicted by the Relative Strength Index (RSI), which exited from extreme overbought territory, plummeting below its neutral level. However, during the last four days, it turned bullish.
For a bullish continuation, buyers must reclaim $4,900. A breach of the latter will expose the $4,950, followed by $5,000. Conversely, if Gold closes on a daily basis below the 20-day Simple Moving Average (SMA) of $4,842, it could exacerbate a drop towards $4,800. Once cleared, the next stop is $4,666, the February 3 daily low.
Gold FAQs
Gold has played a key role in human’s history as it has been widely used as a store of value and medium of exchange. Currently, apart from its shine and usage for jewelry, the precious metal is widely seen as a safe-haven asset, meaning that it is considered a good investment during turbulent times. Gold is also widely seen as a hedge against inflation and against depreciating currencies as it doesn’t rely on any specific issuer or government.
Central banks are the biggest Gold holders. In their aim to support their currencies in turbulent times, central banks tend to diversify their reserves and buy Gold to improve the perceived strength of the economy and the currency. High Gold reserves can be a source of trust for a country’s solvency. Central banks added 1,136 tonnes of Gold worth around $70 billion to their reserves in 2022, according to data from the World Gold Council. This is the highest yearly purchase since records began. Central banks from emerging economies such as China, India and Turkey are quickly increasing their Gold reserves.
Gold has an inverse correlation with the US Dollar and US Treasuries, which are both major reserve and safe-haven assets. When the Dollar depreciates, Gold tends to rise, enabling investors and central banks to diversify their assets in turbulent times. Gold is also inversely correlated with risk assets. A rally in the stock market tends to weaken Gold price, while sell-offs in riskier markets tend to favor the precious metal.
The price can move due to a wide range of factors. Geopolitical instability or fears of a deep recession can quickly make Gold price escalate due to its safe-haven status. As a yield-less asset, Gold tends to rise with lower interest rates, while higher cost of money usually weighs down on the yellow metal. Still, most moves depend on how the US Dollar (USD) behaves as the asset is priced in dollars (XAU/USD). A strong Dollar tends to keep the price of Gold controlled, whereas a weaker Dollar is likely to push Gold prices up.
ECB Press Conference: Lagarde speaks on policy outlook after holding rates unchanged in February
Christine Lagarde, President of the European Central Bank (ECB), explains the ECB’s decision to leave key rates unchanged at the February policy meeting and responds to questions from the press.
Follow FXStreet’s ECB Live Coverage here

ECB press conference key takeaways
“Growth is driven by services, notably in IT.”
“Manufacturing is resilient.”
“Construction momentum is picking up.”
“Government spending should contribute to domestic demand.”
“Business investment should strengthen further.”
“Firms increasingly investing in digital tech.”
“Indicators of underlying inflaiton have changed little.”
“Forward looking indicators and surveys point to continued moderation in labour costs.”
“Most measures of longer term inflation expectations stand around 2%.”
“Euro area faces volatile policy environment.”
“Uncertainty could weigh on demand.”
“Friction in international trade could disrupt supply chains, weaken exports.”
“Planned fiscal spending boost could drive up growth by more than expected.”
“Outlook for inflation more uncertain than usual.”
“Stronger Euro could bring inflation down more than now expected.”
“Inflation could turn out to be higher if there is a persistent upward shift in energy prices.”
This section below was published at 13:15 GMT to cover the European Central Bank’s (ECB) monetary policy announcements and the immediate market reaction.
The European Central Bank (ECB) announced on Thursday that it left key rates unchanged following the February policy meeting, as expected. With this decision, the interest rate on the main refinancing operations, the interest rates on the marginal lending facility and the deposit facility stood at 2.15%, 2.4% and 2%, respectively.
ECB policy statement key takeaways
“Economy remains resilient in a challenging global environment.”
“Low unemployment, solid private sector balance sheets, gradual rollout of public spending on defence and infrastructure and supportive effects of past interest rate cuts are underpinning growth.”
“At the same time, outlook is still uncertain, owing particularly to ongoing global trade policy uncertainty and geopolitical tensions.”
“ECB is determined to ensure that inflation stabilises at its 2% target in medium term.”
“Will follow a data-dependent and meeting-by-meeting approach to determining appropriate monetary policy stance.”
“In particular, ECB’s interest rate decisions will be based on its assessment of inflation outlook and risks surrounding it, in light of incoming economic and financial data, as well as dynamics of underlying inflation and strength of monetary policy transmission.”
“ECB is not pre-committing to a particular rate path.”
“APP and Pandemic Emergency Purchase Programme (PEPP) portfolios are declining at a measured and predictable pace, as Eurosystem no longer reinvests principal payments from maturing securities.”
Market reaction to ECB policy decision
The ECB policy announcements don’t seem to be having a noticeable impact on the Euro’s performance. As of writing, EUR/USD was trading marginally lower on the day at 1.1795.
Euro Price This week
The table below shows the percentage change of Euro (EUR) against listed major currencies this week. Euro was the weakest against the Australian Dollar.
| USD | EUR | GBP | JPY | CAD | AUD | NZD | CHF | |
|---|---|---|---|---|---|---|---|---|
| USD | 0.45% | 0.87% | 1.22% | 0.57% | -0.24% | 0.33% | 0.56% | |
| EUR | -0.45% | 0.38% | 0.81% | 0.11% | -0.69% | -0.11% | 0.10% | |
| GBP | -0.87% | -0.38% | 0.30% | -0.27% | -1.06% | -0.49% | -0.28% | |
| JPY | -1.22% | -0.81% | -0.30% | -0.65% | -1.47% | -0.85% | -0.93% | |
| CAD | -0.57% | -0.11% | 0.27% | 0.65% | -0.77% | -0.21% | -0.01% | |
| AUD | 0.24% | 0.69% | 1.06% | 1.47% | 0.77% | 0.58% | 0.80% | |
| NZD | -0.33% | 0.11% | 0.49% | 0.85% | 0.21% | -0.58% | 0.22% | |
| CHF | -0.56% | -0.10% | 0.28% | 0.93% | 0.01% | -0.80% | -0.22% |
The heat map shows percentage changes of major currencies against each other. The base currency is picked from the left column, while the quote currency is picked from the top row. For example, if you pick the Euro from the left column and move along the horizontal line to the US Dollar, the percentage change displayed in the box will represent EUR (base)/USD (quote).
(This story was corrected at 13:24 GMT to note that the European Central Bank left key rates unchanged after the February meeting, not December).
This section below was published as a preview of the European Central Bank’s policy decisions at 05:00 GMT.
- The European Central Bank is widely anticipated to keep interest rates on hold.
- ECB President Lagarde is likely to reiterate the meeting-by-meeting approach.
- EUR/USD remains stable above 1.1800, with buyers looking to return.
The European Central Bank (ECB) is holding its two-day meeting and will announce its monetary policy decision on Thursday. The ECB is widely expected to keep interest rates on hold for the fifth consecutive meeting, leaving the main refinancing operations, the marginal lending facility, and the deposit facility at 2.15%, 2.4%, and 2%, respectively.
Additionally, ECB President Christine Lagarde will hold a press conference afterward to explain policymakers’ reasoning behind the decision.
Ahead of the announcement, the EUR/USD pair trades above the 1.1800 mark, stabilizing after retracing sharply from January’s peak at 1.2082.
What to expect from the ECB interest rate decision?
The ECB is in a good position and plans to remain there, refraining from any further monetary policy action. The ECB was among the first major central banks to cut rates after post-pandemic inflation peaks that drove multi-decade highs in rates. President Christine Lagarde’s latest mantra has been that monetary policy is in a “good place,” and is expected to repeat the message.
The Governing Council decided to keep rates unchanged at its December meeting, offering no fresh clues about future action. As ING noted, “The minutes of the ECB’s December meeting confirm the ECB’s wait-and-see stance in a macro environment, in which the base case looks very benign, but risks remain unusually high.”
In the meantime, macroeconomic data released in the last couple of months confirm officials’ stance. The Euro area economy has not only been resilient but is finally showing signs of improvement.
According to the latest Eurostat data, the European Union (EU) grew by 0.3% quarter-on-quarter in the three months to December, while the 2025 Gross Domestic Product (GDP) grew by 1.6% year-on-year.
In the meantime, inflation cooled down in January, as expected. Eurostat reported that the Harmonized Index of Consumer Prices (HICP) rose 1.7% in the year to January as expected, while easing from the 1.9% posted in December. The core HICP, which excludes volatile components such as food or energy, rose by 2.3% as anticipated, matching the previous month’s figure.
Finally, it is worth remembering that, speaking after the ECB’s final Governing Council meeting, President Lagarde made it clear that, given that monetary policy is in a “good place,” this does not imply a fixed or predictable path for rates. She also emphasised the ECB’s meeting-by-meeting approach.
In this scenario, the upcoming monetary policy decision is likely to be a non-event. The general consensus is that the ECB will maintain its hawkish stance and that President Lagarde will repeat the message that the ECB is in wait-and-see mode, attentive to economic developments without a pre-set monetary path.
How could the ECB meeting impact EUR/USD?
As previously noted, the EUR/USD pair is stable above 1.1800 ahead of the announcement, following volatile price action over the previous two weeks. The EUR/USD pair also trades roughly 300 pips below its recent peak, yet retains most of its 2025 gains.
Valeria Bednarik, FXStreet Chief Analyst, notes: “Technically speaking, the EUR/USD pair bearish case seems well-limited. In the daily chart, the pair holds well above all its moving averages, with a bullish 20-day Simple Moving Average (SMA) heading north above the 100 and 200 SMAs while providing support at around 1.1760. At the same time, technical indicators have picked up after nearing their midlines, presenting uneven upward strength at the time of writing.”
Bednarik adds: “The EUR/USD pair bottomed at around 1.1775 earlier in the week, making the 1.1760-1.1770 area the immediate downward barrier. A slide below the level exposes the 1.1700 threshold, en route to the 1.1640 price zone. Bulls will be looking for a recovery beyond 1.1920 to add longs, aiming for a test of the 1.2000 mark.”
Euro FAQs
The Euro is the currency for the 20 European Union countries that belong to the Eurozone. It is the second most heavily traded currency in the world behind the US Dollar. In 2022, it accounted for 31% of all foreign exchange transactions, with an average daily turnover of over $2.2 trillion a day.
EUR/USD is the most heavily traded currency pair in the world, accounting for an estimated 30% off all transactions, followed by EUR/JPY (4%), EUR/GBP (3%) and EUR/AUD (2%).
The European Central Bank (ECB) in Frankfurt, Germany, is the reserve bank for the Eurozone. The ECB sets interest rates and manages monetary policy.
The ECB’s primary mandate is to maintain price stability, which means either controlling inflation or stimulating growth. Its primary tool is the raising or lowering of interest rates. Relatively high interest rates – or the expectation of higher rates – will usually benefit the Euro and vice versa.
The ECB Governing Council makes monetary policy decisions at meetings held eight times a year. Decisions are made by heads of the Eurozone national banks and six permanent members, including the President of the ECB, Christine Lagarde.
Eurozone inflation data, measured by the Harmonized Index of Consumer Prices (HICP), is an important econometric for the Euro. If inflation rises more than expected, especially if above the ECB’s 2% target, it obliges the ECB to raise interest rates to bring it back under control.
Relatively high interest rates compared to its counterparts will usually benefit the Euro, as it makes the region more attractive as a place for global investors to park their money.
Data releases gauge the health of the economy and can impact on the Euro. Indicators such as GDP, Manufacturing and Services PMIs, employment, and consumer sentiment surveys can all influence the direction of the single currency.
A strong economy is good for the Euro. Not only does it attract more foreign investment but it may encourage the ECB to put up interest rates, which will directly strengthen the Euro. Otherwise, if economic data is weak, the Euro is likely to fall.
Economic data for the four largest economies in the euro area (Germany, France, Italy and Spain) are especially significant, as they account for 75% of the Eurozone’s economy.
Another significant data release for the Euro is the Trade Balance. This indicator measures the difference between what a country earns from its exports and what it spends on imports over a given period.
If a country produces highly sought after exports then its currency will gain in value purely from the extra demand created from foreign buyers seeking to purchase these goods. Therefore, a positive net Trade Balance strengthens a currency and vice versa for a negative balance.
United Kingdom S&P Global Construction PMI: 46.4 (January) vs 40.1
Zcash, Stacks, and BNB (formerly Binance Coin) are among the biggest losers over the last 24 hours as Bitcoin approaches $72,000. The correction is driven by multiple factors, including massive, steady outflows from institutions and large-wallet investors, broader-market risk-off sentiment, and the delay in the Digital Asset Clarity Act.
Singapore Retail Sales (MoM): -5.4% (December) vs previous 0%
Zcash, Stacks, and BNB are among the biggest losers over the last 24 hours as Bitcoin approaches $72,000 on Thursday. The correction is driven by multiple factors, including massive, steady outflows from institutions and large-wallet investors, broader-market risk-off sentiment, and the delay in the Digital Asset Clarity Act.