Gold stages a comeback in Asian trades on Tuesday, after having found brief support near $4,650. The US Dollar uptrend stalls amid US-Iran de-escalation, easing US-India trade tensions and data disruption. Gold fails to close Monday above the 21-day SMA, but RSI recaptures the midline on the daily chart.
South Korea Consumer Price Index Growth (YoY) registered at 2%, below expectations (2.1%) in January
GBP/USD adds to Friday’s losses, reaching six-day lows near 1.3620, although regaining some composure soon afterwards. Indeed, Cable’s pullback comes amid the ongoing solid performance of the Greenback, while traders also begin to turn their attention to the upcoming BoE meeting.
EUR/USD Price Forecast: Next on the downside comes 1.1700
EUR/USD comes under fresh selling pressure, breaking below the 1.1800 support and extending the leg lower following last week’s multi-year peaks in levels close to the 1.2100 barrier.
Indeed, Monday’s retracement in the pair comes amid the continuation of the strong bounce in the Greenback, at the time when investors keep assessing the recent appointment of Kevin Warsh to lead the Federal Reserve (Fed) from May. That said, the US Dollar Index (DXY) climbs to fresh six-day highs well past the 97.00 hurdle accompanied by rising US Treasury yields across the spectrum.
In addition, caution among traders is expected to kick in ahead of the ECB gathering on Thursday and key US data releases.
Fed: calm confidence, no hurry to move
The Federal Reserve (Fed) left the Fed Funds Target Range (FFTR) unchanged at 3.50%–3.75% at its January meeting, a decision that came as no surprise to markets.
Policymakers sounded a touch more comfortable with the growth outlook, noting that economic activity is still expanding at a solid pace. Inflation was again described as somewhat elevated, and uncertainty remains high, but a key shift was that the Federal Open Market Committee (FOMC) no longer sees downside risks to employment as increasing. The decision passed by a 10–2 vote, with Miran and Waller dissenting in favour of a quarter-point cut.
Chair Jerome Powell reaffirmed at a press conference that the US economy remains robust and that the current policy is appropriate. He noted indications of job market stabilisation, such as slower job growth, indicating weaker labour demand. Powell attributed much of the recent inflation rise to tariff-affected goods, while prices for services continue to decline. He stated that tariff effects will likely peak mid-year and emphasised that policy decisions will be made on a meeting-by-meeting basis, with no rate hikes anticipated as a baseline scenario, given that risks have balanced somewhat.
ECB: in wait-and-see mode, but alert
The European Central Bank (ECB) also held rates steady at its December 18 meeting, striking a calmer and more patient tone that has pushed expectations for near-term cuts further out. Small upgrades to growth and inflation forecasts helped reinforce that stance.
According to the ECB Accounts released last month, officials made it clear there is no urgency to change course. With inflation close to target, they feel they can afford to be patient, even as lingering risks mean flexibility remains essential.
Members of the Governing Council (GC) were keen to stress that patience should not be mistaken for complacency. Policy is seen as being in a “good place” for now, but not on autopilot.
Markets appear to have taken that message on board, as expectations are for rates to be left unchanged on February 5, with just under 5 basis points of easing pencilled in over the year ahead.
Positioning: confidence slowly rebuilding
Speculative positioning continues to lean in favour of the single currency, with signs that conviction may be starting to rebuild.
Indeed, Commodity Futures Trading Commission (CFTC) data for the week ending January 27 show non-commercial net long positions rising to two-week highs around 132.1K contracts. At the same time, institutional players added to their short exposure, now sitting near 181.6K contracts.
Open interest also increased meaningfully, climbing to around 929.3K contracts, the highest level in six weeks, suggesting that participation is picking up again, and with it, a tentative return of confidence.

Interestingly, last week’s daily open interest and volume figures appeared to foreshadow the corrective move seen toward the end of the week.

What could steer the next move
Near term: The spotlight is likely to stay firmly on the US Dollar, with markets refocusing on incoming US data, especially from the labour market. In Europe, attention will turn to advance inflation figures, while the upcoming ECB event is unlikely to generate much excitement in the FX galaxy.
Risks: A Fed that stays cautious for longer could quickly swing momentum back in favour of the US Dollar. From a technical perspective, a clean break below the 200-day Simple Moving Average (SMA) would also increase the risk of a deeper and more sustained correction.
Tech corner
The Greenback’s bounce continues to weigh on EUR/USD, which faces its next temporary support at the 1.1700–1.1680 range, where the 55-day and 100-day SMAs sit. South from here emerges the key 200-day SMA at 1.1608, while the loss of this region could open the door to a potential test of the November 2025 floor at 1.1468 (November 5) prior to the August base at 1.1391 (August 1).
On the flip side, immediate resistance comes at the 2026 ceiling at 1.2082 (January 28), followed by the May 2021 peak at 1.2266 (May 25) and then the 2021 high at 1.2349 (January 6).
Also, momentum indicators show that there could be more gains in the near term, although some caution should not be ruled out. That said, the Relative Strength Index (RSI) eases toward the 51 region, while the Average Directional Index (ADX) near 33 indicates a pretty solid trend.

Bottom line: the US is still calling the shots
For now, EUR/USD is being driven far more by developments in the US than by anything coming out of the euro area.
Until the Fed provides clearer guidance on its 2026 rate path, or the eurozone delivers a more convincing cyclical upswing, any upside is likely to be gradual rather than morph into a clean, decisive breakout.
Euro FAQs
The Euro is the currency for the 20 European Union countries that belong to the Eurozone. It is the second most heavily traded currency in the world behind the US Dollar. In 2022, it accounted for 31% of all foreign exchange transactions, with an average daily turnover of over $2.2 trillion a day.
EUR/USD is the most heavily traded currency pair in the world, accounting for an estimated 30% off all transactions, followed by EUR/JPY (4%), EUR/GBP (3%) and EUR/AUD (2%).
The European Central Bank (ECB) in Frankfurt, Germany, is the reserve bank for the Eurozone. The ECB sets interest rates and manages monetary policy.
The ECB’s primary mandate is to maintain price stability, which means either controlling inflation or stimulating growth. Its primary tool is the raising or lowering of interest rates. Relatively high interest rates – or the expectation of higher rates – will usually benefit the Euro and vice versa.
The ECB Governing Council makes monetary policy decisions at meetings held eight times a year. Decisions are made by heads of the Eurozone national banks and six permanent members, including the President of the ECB, Christine Lagarde.
Eurozone inflation data, measured by the Harmonized Index of Consumer Prices (HICP), is an important econometric for the Euro. If inflation rises more than expected, especially if above the ECB’s 2% target, it obliges the ECB to raise interest rates to bring it back under control.
Relatively high interest rates compared to its counterparts will usually benefit the Euro, as it makes the region more attractive as a place for global investors to park their money.
Data releases gauge the health of the economy and can impact on the Euro. Indicators such as GDP, Manufacturing and Services PMIs, employment, and consumer sentiment surveys can all influence the direction of the single currency.
A strong economy is good for the Euro. Not only does it attract more foreign investment but it may encourage the ECB to put up interest rates, which will directly strengthen the Euro. Otherwise, if economic data is weak, the Euro is likely to fall.
Economic data for the four largest economies in the euro area (Germany, France, Italy and Spain) are especially significant, as they account for 75% of the Eurozone’s economy.
Another significant data release for the Euro is the Trade Balance. This indicator measures the difference between what a country earns from its exports and what it spends on imports over a given period.
If a country produces highly sought after exports then its currency will gain in value purely from the extra demand created from foreign buyers seeking to purchase these goods. Therefore, a positive net Trade Balance strengthens a currency and vice versa for a negative balance.
JPY: 2026 could be year of Yen – HSBC

The HSBC report discusses the recent strengthening of the Yen against the US Dollar, which follows a surge in Japanese long-dated bond yields. Speculation of government intervention, combined with ongoing US Dollar weakness and Japanese fiscal stimulus, suggests that 2026 could be the ‘year of the Yen’. The report highlights the potential impact on carry trades and warns investors to be cautious of Japanese market volatility.
Yen shows potential for further strength
“Last week’s strengthening of the yen versus the US dollar comes hot on the heels of a surge in Japanese long-dated bond yields. The moves could just be bumps in the road towards BoJ policy normalisation.”
“But speculation of government intervention, combined with ongoing US dollar weakness, Fed easing, Japanese fiscal stimulus, and associated inflationary pressures could mean 2026 is finally the ‘year of the yen’.”
“Nonetheless, it’s a reminder that global investors should be wary of the impact of Japanese market volatility.”
(This article was created with the help of an Artificial Intelligence tool and reviewed by an editor.)
United Kingdom S&P Global Manufacturing PMI above expectations (51.6) in January: Actual (51.8)
Gold price extends correction to fresh monthly lows near $4,400 in European trading on Monday, pressured by some profit-taking. The precious metal continues its downtrend after reaching historic highs last week as Kevin Warsh’s nomination as the next Fed chair eases concerns over the US central bank’s independence, bolstering the US Dollar recovery. US ISM PMI Manufacturing PMI data is awaited.
Gold slides as Kevin Warsh announced as Fed chair
Gold price (XAU/USD) tumbles to a two-week low below $4,700 during the Asian trading hours on Monday, pressured by some profit-taking. The precious metal extends the decline after reaching historic highs last week amid signs of political stability in the United States (US) as Kevin Warsh was selected to be the next Fed chair, easing concerns over the US central bank’s independence.
On the other hand, ongoing geopolitical tensions, including US-Iran tensions, could underpin traditional safe-haven assets such as Gold. Traders will closely monitor the developments surrounding US-Iran negotiations, along with further clarity on Warsh’s policy direction. Additionally, rising demand from major central banks might contribute to the precious metal’s upside.
The US ISM Manufacturing Purchasing Managers Index (PMI) data will be released later on Monday. The figure is expected to improve to 48.3 in January from 47.9 in December. If the report shows surprise to the downside, this could drag the US Dollar (USD) lower and lift the USD-denominated commodity price, as a weaker USD makes greenback-priced gold more attractive for foreign buyers.
Daily Digest Market Movers: Gold remains under pressure after historic plunge
- Trump said over the weekend that the US will “hopefully” make a deal with Iran. Meanwhile, Iranian Supreme Leader Ayatollah Ali Khamenei warned that any attack on his country would spark a regional conflict, as the US continues to build up its forces nearby.
- “Investors and global central banks have… favored gold as their reserve currency of choice, which they believe insulates them from US policy dependence,” said Emma Wall, chief investment strategist at Hargreaves Lansdown. “Certain nations will have observed the threat of Russia having its US dollar assets seized by global players supportive of Ukraine, and subsequently considered the metal a more attractive neutral reserve,” she added.
- US President Donald Trump nominated Kevin Warsh to succeed Jerome Powell as the next Fed Chair. He is scheduled to take office in May 2026.
- The US Producer Price Index (PPI) climbed 3.0% year-over-year (YoY) in December, beating estimates of 2.7%, according to the Bureau of Labor Statistics on Friday. The PPI rose 0.5% month-over-month (MoM) in December, above the market consensus and the previous reading of 0.2%.
- Hotter-than-expected US producer price inflation could further strengthen the case for the Fed to hold rates steady while policymakers monitor how inflation trends.
- Markets see nearly an 87% chance of interest rates staying at the current 3.50%–3.75% range, with the first 25-basis-point (bps) reduction likely in June.
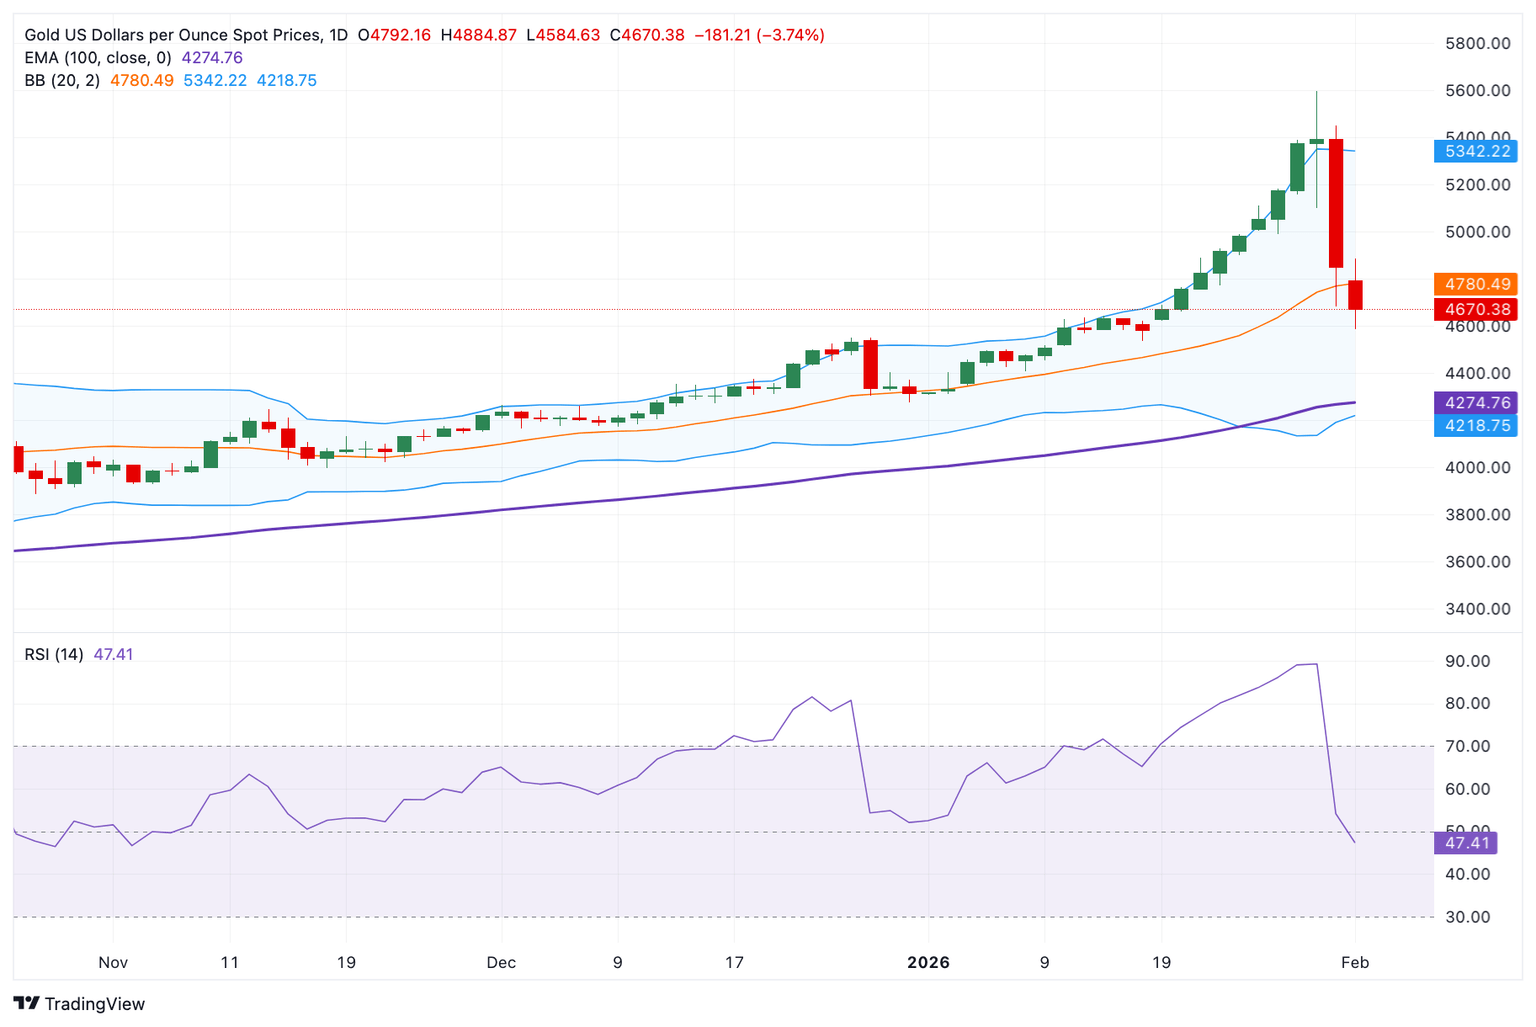
Gold keeps a bullish vibe in the longer term, but a neutral RSI warrants caution for bulls
Gold trades in negative territory on the day. However, in the longer term, the path of least resistance is to the upside, as the yellow metal is well-supported above the key 100-day Exponential Moving Average (EMA) on the daily chart. The Bollinger Bands widen, suggesting a strong trend continuation.
Despite the bullish trend, the 14-day Relative Strength Index (RSI) hovers around the midline, indicating that further consolidation or a temporary sell-off cannot be ruled out.
Green candlesticks and sustained trading above the February 2 high of $4,885 could make another run toward the $5,000 psychological level. The next upside barrier to watch is the January 27 high of $5,182.
On the flip side, the first downside target for Gold is seen at the January 19 low of $4,620. Any follow-through selling below the mentioned level could expose the January 12 low of $4,513. The key contention level emerges at the 100-day EMA of $4,275.
Gold FAQs
Gold has played a key role in human’s history as it has been widely used as a store of value and medium of exchange. Currently, apart from its shine and usage for jewelry, the precious metal is widely seen as a safe-haven asset, meaning that it is considered a good investment during turbulent times. Gold is also widely seen as a hedge against inflation and against depreciating currencies as it doesn’t rely on any specific issuer or government.
Central banks are the biggest Gold holders. In their aim to support their currencies in turbulent times, central banks tend to diversify their reserves and buy Gold to improve the perceived strength of the economy and the currency. High Gold reserves can be a source of trust for a country’s solvency. Central banks added 1,136 tonnes of Gold worth around $70 billion to their reserves in 2022, according to data from the World Gold Council. This is the highest yearly purchase since records began. Central banks from emerging economies such as China, India and Turkey are quickly increasing their Gold reserves.
Gold has an inverse correlation with the US Dollar and US Treasuries, which are both major reserve and safe-haven assets. When the Dollar depreciates, Gold tends to rise, enabling investors and central banks to diversify their assets in turbulent times. Gold is also inversely correlated with risk assets. A rally in the stock market tends to weaken Gold price, while sell-offs in riskier markets tend to favor the precious metal.
The price can move due to a wide range of factors. Geopolitical instability or fears of a deep recession can quickly make Gold price escalate due to its safe-haven status. As a yield-less asset, Gold tends to rise with lower interest rates, while higher cost of money usually weighs down on the yellow metal. Still, most moves depend on how the US Dollar (USD) behaves as the asset is priced in dollars (XAU/USD). A strong Dollar tends to keep the price of Gold controlled, whereas a weaker Dollar is likely to push Gold prices up.
South Korea S&P Global Manufacturing PMI climbed from previous 50.1 to 51.2 in January
Information on these pages contains forward-looking statements that involve risks and uncertainties. Markets and instruments profiled on this page are for informational purposes only and should not in any way come across as a recommendation to buy or sell in these assets. You should do your own thorough research before making any investment decisions. FXStreet does not in any way guarantee that this information is free from mistakes, errors, or material misstatements. It also does not guarantee that this information is of a timely nature. Investing in Open Markets involves a great deal of risk, including the loss of all or a portion of your investment, as well as emotional distress. All risks, losses and costs associated with investing, including total loss of principal, are your responsibility. The views and opinions expressed in this article are those of the authors and do not necessarily reflect the official policy or position of FXStreet nor its advertisers. The author will not be held responsible for information that is found at the end of links posted on this page.
If not otherwise explicitly mentioned in the body of the article, at the time of writing, the author has no position in any stock mentioned in this article and no business relationship with any company mentioned. The author has not received compensation for writing this article, other than from FXStreet.
FXStreet and the author do not provide personalized recommendations. The author makes no representations as to the accuracy, completeness, or suitability of this information. FXStreet and the author will not be liable for any errors, omissions or any losses, injuries or damages arising from this information and its display or use. Errors and omissions excepted.
The author and FXStreet are not registered investment advisors and nothing in this article is intended to be investment advice.
Are you (hazel) nuts?
I’m convinced that Nutella is the second most important invention after the wheel. So yes, I’m an unapologetic hazelnut fan.
That said, a few months ago I started to notice something odd. The price of natural hazelnuts had more or less doubled. Shortly after, they became surprisingly hard to find, at least in supermarkets where they had always been readily available.
That caught my attention. And it made me wonder whether something unusual had happened, or was still unfolding, in the hazelnut market.
Hazelnuts: a commodity shock without a market
Hazelnuts are a small commodity with an unusually concentrated supply chain. Around 70% of global production comes from Turkey, with output overwhelmingly concentrated in the Black Sea region, where soil, rainfall and climate conditions are uniquely well suited to hazelnut trees. Few agricultural commodities display such geographic dependence.
That concentration extends beyond geography into labour. Roughly 600,000 farmers grow hazelnuts in Turkey, mostly on small, family-owned plots. Including processing, logistics and trade, an estimated five million people are directly or indirectly involved in the hazelnut economy. Production is fragmented, local and labour-intensive, a structure that shapes how the market functions in times of stress.
An opaque market by design
Hazelnuts do not trade on any major agricultural exchange. There are no futures contracts, no central clearing, and no benchmark price. Transactions are negotiated directly, often verbally, between farmers, wholesalers and exporters. Prices are quite literally “called on the phone”.
This makes the market largely inaccessible to non-commercial participants and almost invisible from a traditional commodity-market perspective. Yet physical supply and demand still clear, and when supply is disrupted, prices can move violently.
A rare but severe supply shock
In April 2025, hazelnut growers along Turkey’s Black Sea coast woke up to the worst possible surprise: a late frost sweeping through the region. Frosts like this are rare, maybe once a decade, but this one landed at exactly the wrong moment.
The spring had been unusually warm, pushing hazelnut trees to bud and flower earlier than normal. When temperatures suddenly dropped, the trees were completely exposed. The damage was immediate and widespread. Early estimates suggest around one-third of Turkey’s hazelnut crop was wiped out in a matter of days.
And the frost was only part of the story. Turkish growers had already been dealing with mounting pressures. The brown marmorated stink bug, which arrived in the country around 2017, has become a persistent threat, capable of destroying 10–20% of output in bad years. On top of that, the summer of 2024 was the hottest and driest in more than 60 years, leaving trees stressed and less resilient going into the 2025 season.
By the time the frost hit, the crop had little margin for error, and the market has been paying the price ever since.
Taken together, the result is a severe imbalance: available supply in 2025 is likely to meet only about half of global demand.
How prices behave without a benchmark
History provides a guide to what happens next. Following similar frost events in 2004 and 2014, hazelnut prices more than tripled. In the 2014 episode, prices began rising immediately after the frost in March, peaked in late April to early May 2015, and then fell by roughly 50% within one to two months as demand adjusted and inventories were released.
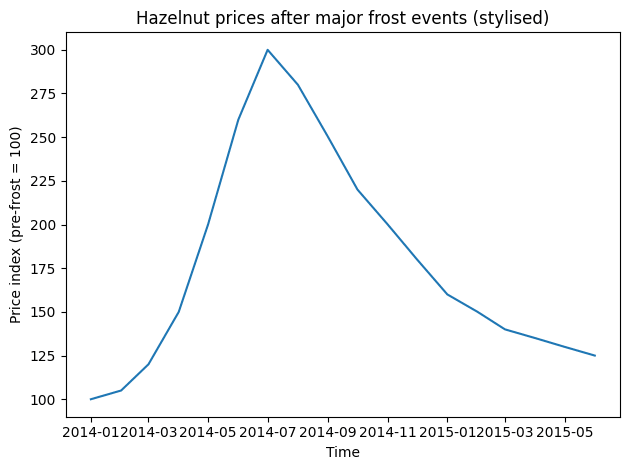
Chart 1 illustrates this typical pattern by using a stylised price index. The spike is sharp, front-loaded and driven by physical scarcity rather than speculative positioning. The subsequent correction reflects demand rationing rather than a recovery in supply.
A problem with the structure of the supply
When the price of hazelnuts goes up, supply doesn’t rush in to meet it. There is no easy answer. It takes years for hazelnut trees to grow up, you can’t plant new orchards overnight, and there aren’t many other countries that can grow them. Most of the production still comes from small, family-run farms that don’t have much access to capital and can’t grow even when prices are high.
Because of this rigidity, shocks in the hazelnut market tend to look awful. The market doesn’t make small changes; instead, it swings suddenly: prices go up, volumes go down, and buyers have to adapt on the fly.

Chart 2 captures the core of the current problem: demand remains broadly intact, but supply has been structurally impaired.
A market that matters, even though it’s hard to see
Hazelnuts may not be in the world of futures contracts and electronic trading screens, but they are an important part of the global food supply chain. There is steady demand for spreads, chocolates, biscuits, and baked goods, and it will be hard to find something else to fill the gap in the short term.
Combine that demand with a highly concentrated production base, rising climate volatility and biological risks, and the result is a market that is unusually fragile. When something goes wrong, there are few buffers, and the adjustment is sudden, not smooth.
The lesson from 2025 is not just about hazelnuts. It is about how physical commodities behave when there is no buffer of inventories, no financial market to absorb shocks, and no rapid supply response. In such markets, scarcity does not emerge gradually; it arrives all at once.
Binance set to convert $1 billion stablecoin reserve to Bitcoin to support ecosystem growth

Crypto exchange Binance announced plans to convert assets in its Secure Asset Fund for Users (SAFU) reserve, consisting mainly of stablecoins, into Bitcoin (BTC) to support ecosystem growth and development.
Binance plans to replace $1 billion stablecoin holdings in SAFU Fund with Bitcoin
Binance is set to adjust the asset structure of its SAFU Fund from stablecoins to Bitcoin, according to a statement on Friday.
The conversion, scheduled to be completed 30 days after the announcement, will fully shift $1 billion in reserves into BTC. “By making this move, we’re embracing market cycles and standing shoulder-to-shoulder with the industry, just as we always have,” the exchange noted.
Binance stated that it will regularly review the SAFU Fund’s asset value and will restore the fund to $1 billion if it falls below $800 million due to Bitcoin’s price swings.
The exchange said the move is part of its broader plan to support the crypto ecosystem, highlighting that it considers Bitcoin as the crypto industry’s top store of value asset for long-term investment.
“Guided by our belief that BTC serves as the core asset in the crypto ecosystem and represents long-term value, Binance will continue to stand alongside our industry through market cycles and uncertainty,” the firm added.
Binance established the Secure Asset Fund for Users (SAFU) in 2018 as a protective mechanism designed to safeguard customer assets in the event of unexpected incidents. At inception, the exchange committed a portion of its trading fee revenue to systematically build the fund into a substantial reserve.
As of January 2026, the SAFU wallet holds approximately $1 billion in USDC, according to the Binance website. A share of these assets now serves as regulatory capital reserves in line with Binance’s compliance requirements within the Abu Dhabi Global Market (ADGM).
The fund is currently held and administered by Nest Clearing and Custody Limited, a clearing house authorized to provide custody services under the oversight of the ADGM Financial Services Regulatory Authority.
The move comes as the crypto community has expressed displeasure with Binance, urging the exchange to build a Bitcoin reserve using its profits.
Several market participants also recently blamed the exchange for the October 10 leverage flush.
Meanwhile, Bitcoin has been under sustained bearish pressure, trading below $85,000 at the time of publication. Over the past two weeks, the top crypto is down about 12%.
China NBS Non-Manufacturing PMI came in at 49.4 below forecasts (50.3) in January
Information on these pages contains forward-looking statements that involve risks and uncertainties. Markets and instruments profiled on this page are for informational purposes only and should not in any way come across as a recommendation to buy or sell in these assets. You should do your own thorough research before making any investment decisions. FXStreet does not in any way guarantee that this information is free from mistakes, errors, or material misstatements. It also does not guarantee that this information is of a timely nature. Investing in Open Markets involves a great deal of risk, including the loss of all or a portion of your investment, as well as emotional distress. All risks, losses and costs associated with investing, including total loss of principal, are your responsibility. The views and opinions expressed in this article are those of the authors and do not necessarily reflect the official policy or position of FXStreet nor its advertisers. The author will not be held responsible for information that is found at the end of links posted on this page.
If not otherwise explicitly mentioned in the body of the article, at the time of writing, the author has no position in any stock mentioned in this article and no business relationship with any company mentioned. The author has not received compensation for writing this article, other than from FXStreet.
FXStreet and the author do not provide personalized recommendations. The author makes no representations as to the accuracy, completeness, or suitability of this information. FXStreet and the author will not be liable for any errors, omissions or any losses, injuries or damages arising from this information and its display or use. Errors and omissions excepted.
The author and FXStreet are not registered investment advisors and nothing in this article is intended to be investment advice.