Fundamentals in the crypto market remain strong despite the recent correction, Standard Chartered’s global head of digital assets Research Geoffrey Kendrick says. Institutional adoption is still in its early stages and will continue to grow, bringing more stability but also shifting market dynamics.
Dow Jones Industrial Average rises on key tech rally stocks, government shutdown hopes
The Dow Jones Industrial Average (DJIA) caught a bullish tailwind on Monday, rising over 450 points to kick off the new trading week. Apple (AAPL) shares rose strongly, leading the charge into the high end as the tech rally gives fresh signs of life, and investors are hoping that rumors of a potential end of the US federal government shutdown will result in an end to the federal closure.
Apple shares rallied on Monday, dragging the rest of the tech-dependent bull market along with it. Analysts from Loop Capital raised Apple’s stock outlook from ‘hold’ to a ‘buy’, prompting loose market cash to pile into the iPhone maker.
Shutdown drags on, but hope for a near-term solution exists
The US federal government shutdown has entered its twentieth day and shows no signs of coming to a quick end. However, according to key White House officials, there may be a chance to pass a near-term funding agreement while the federal government works out a more meaningful budget resolution. The US government failed to reach an agreement on a funding bill at the start of the US government’s fiscal year on October 20, and House Republicans sent Congress into recess for this week after two weeks of little movement on budget proposals.
Q3 earnings season is in full swing, and the overwhelming majority of companies have beat analyst expectations heading into the fourth quarter. 76% of S&P-listed companies have beat forecasts on third quarter earnings, bolstering the general market’s upward momentum.
Dow Jones daily chart

Dow Jones FAQs
The Dow Jones Industrial Average, one of the oldest stock market indices in the world, is compiled of the 30 most traded stocks in the US. The index is price-weighted rather than weighted by capitalization. It is calculated by summing the prices of the constituent stocks and dividing them by a factor, currently 0.152. The index was founded by Charles Dow, who also founded the Wall Street Journal. In later years it has been criticized for not being broadly representative enough because it only tracks 30 conglomerates, unlike broader indices such as the S&P 500.
Many different factors drive the Dow Jones Industrial Average (DJIA). The aggregate performance of the component companies revealed in quarterly company earnings reports is the main one. US and global macroeconomic data also contributes as it impacts on investor sentiment. The level of interest rates, set by the Federal Reserve (Fed), also influences the DJIA as it affects the cost of credit, on which many corporations are heavily reliant. Therefore, inflation can be a major driver as well as other metrics which impact the Fed decisions.
Dow Theory is a method for identifying the primary trend of the stock market developed by Charles Dow. A key step is to compare the direction of the Dow Jones Industrial Average (DJIA) and the Dow Jones Transportation Average (DJTA) and only follow trends where both are moving in the same direction. Volume is a confirmatory criteria. The theory uses elements of peak and trough analysis. Dow’s theory posits three trend phases: accumulation, when smart money starts buying or selling; public participation, when the wider public joins in; and distribution, when the smart money exits.
There are a number of ways to trade the DJIA. One is to use ETFs which allow investors to trade the DJIA as a single security, rather than having to buy shares in all 30 constituent companies. A leading example is the SPDR Dow Jones Industrial Average ETF (DIA). DJIA futures contracts enable traders to speculate on the future value of the index and Options provide the right, but not the obligation, to buy or sell the index at a predetermined price in the future. Mutual funds enable investors to buy a share of a diversified portfolio of DJIA stocks thus providing exposure to the overall index.
Canada Raw Material Price Index: 1.7% (September) vs -0.6%
Cardano (ADA) hovers around $0.64 at the time of writing on Monday, having corrected nearly 7% in the previous week. Derivatives data signal waning trader confidence and growing expectations of further downside as Open Interest (OI) drops to a yearly low, coupled with a surge in short bets.
Eurozone Current Account s.a came in at €11.9B below forecasts (€22.5B) in August
Markets are bracing for a summit that feels less like diplomacy and more like a staring contest between tectonic plates. The Trump–Xi meeting at the upcoming APEC summit is being billed as a chance to “defuse” tensions — but traders know better. This isn’t détente; it’s leverage theatre at the edge of a resource war, where the currency isn’t dollars or data, but elements pulled from the earth’s crust itself.
WTI holds losses near $57.00 due to OPEC+ oversupply concerns

West Texas Intermediate (WTI) Oil price trims its recent gains from the previous session, trading around $57.00 per barrel during the Asian hours on Monday. Crude Oil prices face challenges amid concerns over rising global supply.
Last week’s International Energy Agency (IEA) report revealed expectations that the members of the Organization of the Petroleum Exporting Countries and its allies, including Russia, popularly known as OPEC+, may increase their production, citing its increase in projections for a market surplus.
Traders pay attention to further development on India’s decision to buy Russian Oil. US President Donald Trump reiterated on Sunday that Indian Prime Minister Narendra Modi assured him India would stop purchasing Russian Oil, while warning that New Delhi would face “massive” tariffs if it failed to comply, per Reuters.
On Thursday, a White House official said that India has cut its Russian Oil imports by half, but Indian sources have not witnessed any immediate reduction. Reuters also cited sources saying that Indian refiners have already placed orders for November loadings, including some scheduled for December arrival, suggesting that any reduction may only be reflected in import data from December or January.
The commodities data firm Kpler suggests that India’s imports of Russian Oil are set to rise about 20% this month to 1.9 million barrels per day, as Russia ramps up exports after Ukrainian drones hit its refineries.
WTI Oil FAQs
WTI Oil is a type of Crude Oil sold on international markets. The WTI stands for West Texas Intermediate, one of three major types including Brent and Dubai Crude. WTI is also referred to as “light” and “sweet” because of its relatively low gravity and sulfur content respectively. It is considered a high quality Oil that is easily refined. It is sourced in the United States and distributed via the Cushing hub, which is considered “The Pipeline Crossroads of the World”. It is a benchmark for the Oil market and WTI price is frequently quoted in the media.
Like all assets, supply and demand are the key drivers of WTI Oil price. As such, global growth can be a driver of increased demand and vice versa for weak global growth. Political instability, wars, and sanctions can disrupt supply and impact prices. The decisions of OPEC, a group of major Oil-producing countries, is another key driver of price. The value of the US Dollar influences the price of WTI Crude Oil, since Oil is predominantly traded in US Dollars, thus a weaker US Dollar can make Oil more affordable and vice versa.
The weekly Oil inventory reports published by the American Petroleum Institute (API) and the Energy Information Agency (EIA) impact the price of WTI Oil. Changes in inventories reflect fluctuating supply and demand. If the data shows a drop in inventories it can indicate increased demand, pushing up Oil price. Higher inventories can reflect increased supply, pushing down prices. API’s report is published every Tuesday and EIA’s the day after. Their results are usually similar, falling within 1% of each other 75% of the time. The EIA data is considered more reliable, since it is a government agency.
OPEC (Organization of the Petroleum Exporting Countries) is a group of 12 Oil-producing nations who collectively decide production quotas for member countries at twice-yearly meetings. Their decisions often impact WTI Oil prices. When OPEC decides to lower quotas, it can tighten supply, pushing up Oil prices. When OPEC increases production, it has the opposite effect. OPEC+ refers to an expanded group that includes ten extra non-OPEC members, the most notable of which is Russia.
NZD/USD gathers strength above 0.5700 after New Zealand’s CPI inflation data

The NZD/USD pair gathers strength to near 0.5730 during the early Asian session on Monday. The New Zealand Dollar (NZD) edges higher against the US Dollar (USD) after the release of consumer price inflation data. Later on Monday, traders will closely monitor China’s Q3 Gross Domestic Product (GDP), along with Industrial Production and Retail Sales reports for September.
Data released by Statistics New Zealand on Monday showed that New Zealand’s Consumer Price Index (CPI) climbed 3.0% YoY in the third quarter (Q3) of 2025, versus 2.7% in Q2. This figure came in line with the expectation. The quarterly CPI inflation rose to 1.0% in Q3 from the previous print of 0.5%.
The hotter New Zealand CPI inflation data provide some support to the NZD against the USD. Nonetheless, traders will take more cues from China’s economic data later on Monday. The Chinese economy is estimated to grow 4.8% YoY in Q3. China’s Industrial Production is expected to rise 5.0% YoY in September, while the Retail Sales are projected to increase 2.9% YoY during the same period. In case of a weaker-than-expected outcome, this could weigh on the China-proxy Kiwi, as China is a major trading partner for New Zealand.
On the USD’s front, the ongoing US federal government shutdown might exert some selling pressure on the Greenback and act as a tailwind to the pair. The government shutdown has entered its 19th day with no end in sight, after senators failed for the 10th time to resolve the impasse in votes on Thursday. The shutdown is now the third-longest funding lapse in modern history.
New Zealand Dollar FAQs
The New Zealand Dollar (NZD), also known as the Kiwi, is a well-known traded currency among investors. Its value is broadly determined by the health of the New Zealand economy and the country’s central bank policy. Still, there are some unique particularities that also can make NZD move. The performance of the Chinese economy tends to move the Kiwi because China is New Zealand’s biggest trading partner. Bad news for the Chinese economy likely means less New Zealand exports to the country, hitting the economy and thus its currency. Another factor moving NZD is dairy prices as the dairy industry is New Zealand’s main export. High dairy prices boost export income, contributing positively to the economy and thus to the NZD.
The Reserve Bank of New Zealand (RBNZ) aims to achieve and maintain an inflation rate between 1% and 3% over the medium term, with a focus to keep it near the 2% mid-point. To this end, the bank sets an appropriate level of interest rates. When inflation is too high, the RBNZ will increase interest rates to cool the economy, but the move will also make bond yields higher, increasing investors’ appeal to invest in the country and thus boosting NZD. On the contrary, lower interest rates tend to weaken NZD. The so-called rate differential, or how rates in New Zealand are or are expected to be compared to the ones set by the US Federal Reserve, can also play a key role in moving the NZD/USD pair.
Macroeconomic data releases in New Zealand are key to assess the state of the economy and can impact the New Zealand Dollar’s (NZD) valuation. A strong economy, based on high economic growth, low unemployment and high confidence is good for NZD. High economic growth attracts foreign investment and may encourage the Reserve Bank of New Zealand to increase interest rates, if this economic strength comes together with elevated inflation. Conversely, if economic data is weak, NZD is likely to depreciate.
The New Zealand Dollar (NZD) tends to strengthen during risk-on periods, or when investors perceive that broader market risks are low and are optimistic about growth. This tends to lead to a more favorable outlook for commodities and so-called ‘commodity currencies’ such as the Kiwi. Conversely, NZD tends to weaken at times of market turbulence or economic uncertainty as investors tend to sell higher-risk assets and flee to the more-stable safe havens.
Ethereum Price Forecast: Asia backers to join forces to launch $1 billion ETH treasury
Ethereum (ETH) declined by 2% on Friday despite reports of key crypto investors in Asia collaborating in an effort to launch a $1 billion ETH treasury, according to Bloomberg.
Key Asia crypto backers set to launch $1 billion Ethereum treasury
Several crypto leaders in Asia have begun plans to enter the Ethereum treasury race, with Li Lin, founder of crypto exchange Huobi and chairman of investment firm Avenir Capital, joining forces with a group of investors in an effort to launch a $1 billion ETH treasury.
The cohort includes HashKey Group CEO and Chairman Xiao Feng, Fenbushi Capital co-founder Shen Bo and Meitu Inc. founder Cai Wensheng.
The initiative has already seen investors pledge about $1 billion, including a $500 million investment from institutional investors, including HongShan Capital Group (formerly Sequoia China) and $200 million from Lin’s Avenir Capital, Bloomberg reported, citing people familiar with the matter.
An official announcement regarding the treasury’s launch is expected within the next two to three weeks. However, Bloomberg reported that discussions are still underway, and the details of the plan may yet be revised.
The move adds to the list of digital asset treasuries focused on acquiring ETH as a reserve asset. Ethereum treasury companies currently hold 3.6 million ETH, led by BitMine Immersion (BMNR), with 1.7 million ETH. SharpLink Gaming follows behind with over 797,000 ETH worth roughly $3 billion.
With more firms pivoting to an Ethereum treasury, experts are predicting a bubble. BitMine Chairman Thomas Lee stated that the ‘bubble has burst’ in digital asset treasury companies, as many trade below net asset value.
Ethereum Price Forecast: ETH tests $3,800 support
Ethereum experienced $215.9 million in futures liquidations over the past 24 hours, spearheaded by $146.1 million in long liquidations.
ETH briefly declined below the key support at $3,815, but bulls quickly recovered the level. However, the top altcoin still faces pressure at the level with a descending trendline resistance standing above it.

ETH/USDT daily chart
A failure to hold $3,800 could send ETH toward the support just below $3,500.
The Relative Strength Index (RSI) and Moving Average Convergence Divergence (MACD) are below their neutral levels, indicating a dominant bearish momentum.
Jupiter unveils Ultra v3 trading engine to boost performance

Jupiter (JUP) fell 2% on Friday despite revealing the launch of its new trading engine, Ultra V3, aiming to improve the platform’s performance and lower trading fees.
JUP declines despite Jupiter launching V3 trading engine
Solana-based decentralized exchange (DEX) Jupiter has introduced a new trading engine, Ultra v3, to improve how users get prices and execute swaps, the exchange stated in a Friday X post.
The upgrade features new routing systems and execution tools aimed at securing better prices, stronger protection for traders and improved overall trading experience.
The engine aggregates routes from platforms including Iris, DFlow, Hashflow, OKX and Jupiter’s own JupiterZ.
At the center of the upgrade is Iris, Jupiter’s new router built to replace its previous system, Metis. Iris can allegedly split trades and employs refined routing algorithms such as Golden-section and Brent’s method, which Jupiter claims have led to 100x performance improvements.
JupiterZ, the exchange’s in-house request-for-quote system that handles roughly $100 million in daily volume, has also been integrated into Ultra v3, offering “zero-slippage” execution for private transactions.
Jupiter also introduced a new transaction landing system called ShadowLane, designed to improve how trades are finalized on-chain. The in-house engine is built for sub-second precision, leveraging real-time data to ensure transactions are executed faster and more securely.
Jupiter stated that ShadowLane lands up to three times more trades than comparable premium methods while cutting latency from 1–3 blocks (around 400ms–1.2s) to just 0–1 block (50–400ms).
Jupiter claims that Ultra v3 delivers 34 times better sandwich protection, 8–10 times lower execution fees, and a +0.6 basis point positive slippage, stating that these figures compare favorably against competing DEX aggregators.
Ultra v3 is now available across all of Jupiter’s products, including its web and mobile platforms, API, and professional trading tools.
JUP declined nearly 2% despite the announcement, with its weekly loss stretching over 17%.
EUR/USD slips as Trump softens China tariff stance, US Dollar recovers
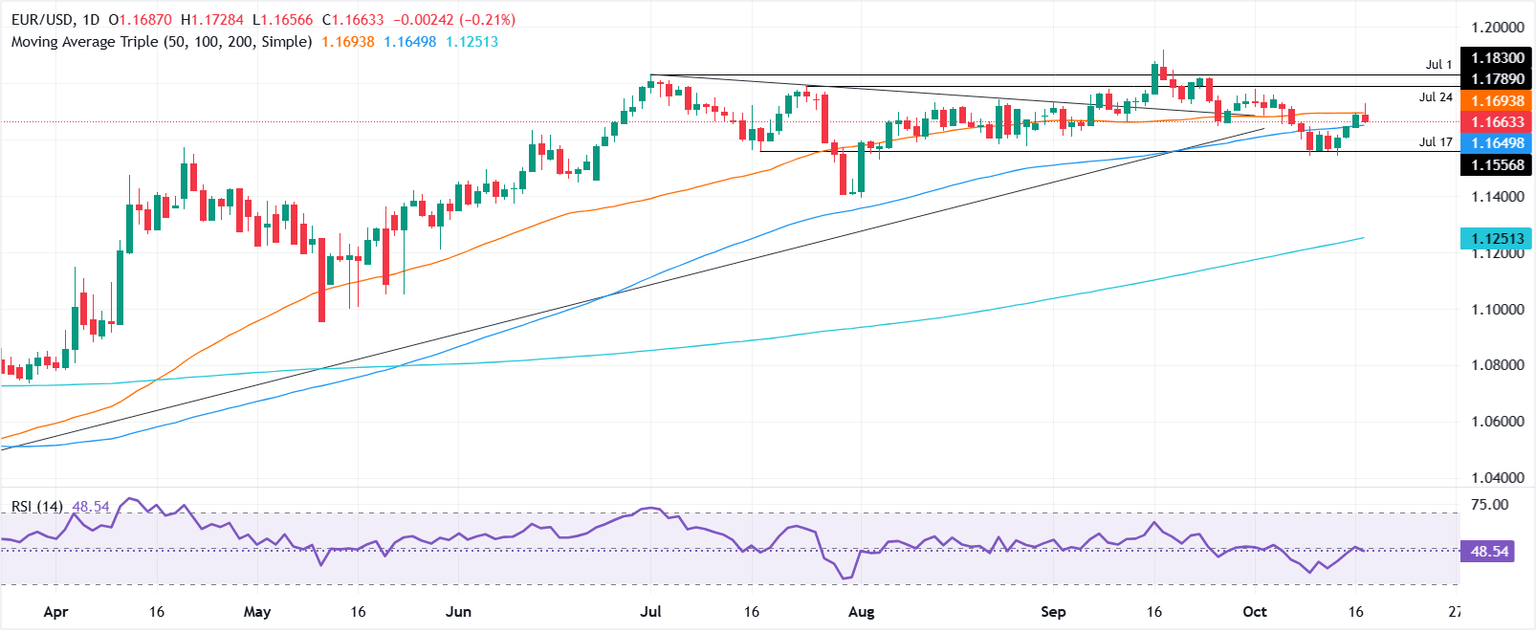
EUR/USD dives 0.17% during the North American session on Friday as the Greenback trims its earlier losses as US President Donald Trump tempered his trade rhetoric on China. The pair trades at around 1.1666 after hitting a daily high of 1.1728.
Euro retreats from daily highs as risk appetite improves and Fed remarks stay cautiously dovish
Risk appetite improved ahead of Wall Street open as US President Donald Trump said that high tariffs on China were not sustainable and most likely increase tensions between the two countries. He added that he plans to meet Xi Jinping at the Asian Pacific reunion in South Korea.
After the headlines, the Greenback erased its earlier losses and rose. The US Dollar Index (DXY), which tracks the performance of the buck’s value against a basket of peers, is up 0.09% at 98.42.
The lack of economic data keeps traders leaning on Federal Reserve (Fed) officials crossing the wires. Most of the remarks were slightly dovish, led by Governor Christopher Waller. Meanwhile, St. Louis Fed President Alberto Musalem and Minneapolis Fed Neel Kashkari, although favoring further cuts, stressed that inflation remains hot.
In Europe, the Harmonized Index of Consumer Prices (HICP) was broadly aligned with estimates in September.
Next week, the US economic docket remains empty, but the release of the Consumer Price Index (CPI) figures on Friday is widely awaited by market participants.
Euro Price This week
The table below shows the percentage change of Euro (EUR) against listed major currencies this week. Euro was the strongest against the Australian Dollar.
| USD | EUR | GBP | JPY | CAD | AUD | NZD | CHF | |
|---|---|---|---|---|---|---|---|---|
| USD | -0.38% | -0.57% | -0.92% | 0.14% | 0.20% | 0.10% | -1.03% | |
| EUR | 0.38% | -0.19% | -0.49% | 0.51% | 0.67% | 0.51% | -0.66% | |
| GBP | 0.57% | 0.19% | -0.26% | 0.70% | 0.85% | 0.70% | -0.50% | |
| JPY | 0.92% | 0.49% | 0.26% | 1.00% | 1.07% | 1.08% | -0.17% | |
| CAD | -0.14% | -0.51% | -0.70% | -1.00% | 0.03% | 0.00% | -1.19% | |
| AUD | -0.20% | -0.67% | -0.85% | -1.07% | -0.03% | -0.14% | -1.33% | |
| NZD | -0.10% | -0.51% | -0.70% | -1.08% | -0.00% | 0.14% | -1.19% | |
| CHF | 1.03% | 0.66% | 0.50% | 0.17% | 1.19% | 1.33% | 1.19% |
The heat map shows percentage changes of major currencies against each other. The base currency is picked from the left column, while the quote currency is picked from the top row. For example, if you pick the Euro from the left column and move along the horizontal line to the US Dollar, the percentage change displayed in the box will represent EUR (base)/USD (quote).
Daily market movers: The Dollar appreciates, despite Fed’s dovish comments
- Several Federal Reserve officials spoke on Friday, offering a cautiously dovish tone. St. Louis Fed President Alberto Musalem said he supports a rate cut at the October meeting but reaffirmed his full commitment to returning inflation to the 2% target.
- Fed Governor Christopher Waller echoed Musalem’s remarks, while Minneapolis Fed President Neel Kashkari noted that the economy “is not slowing as much as we think,” suggesting resilience despite recent data softening.
- Eurozone inflation data came broadly in line with expectations in September, signaling stable price dynamics. Core HICP rose 0.1% MoM and 2.4% YoY, slightly above the 2.3% forecast. Headline HICP also climbed 0.1% on the month and 2.2% on the year, matching both projections and August’s readings.
- European Central Bank (ECB) officials maintained a cautious tone on Friday. ECB’s Olaf Sleijpen said that policy being “in a good place” does not mean it will stay there, noting that the economy has been more resilient than expected. ECB’s Joachim Nagel added that there is no need to act on interest rates for now.
- On Tuesday, Fed Chair Jerome Powell was dovish, acknowledged the weakness of the labor market and added that the central bank should move to more “neutral” interest rates.
- Money markets are fully pricing in a 25-basis-point rate cut at the Fed’s October 29 meeting, with odds at 97%, according to the Prime Market Terminal probability tool.
Technical outlook: EUR/USD slips below 100-day SMA, further downside eyed
EUR/USD’s technical outlook remains bearishly biased, despite improving somewhat in the week. After reaching a weekly high of 1.1728, the shared currency tumbled below 1.1700, opening the door for further downside.
The EUR/USD first support would be the 100-day Simple Moving Average (SMA) at 1.1648. Once cleared, the next stop would be the 1.1600 figure, followed by 1.1550 and 1.1500.
On the flip side, resistance is seen at the 50-day SMA at 1.1691, 1.1700 and the daily high of 1.1728. A breach of the latter will expose 1.1800 and the July 1 high at 1.1830.
Euro FAQs
The Euro is the currency for the 19 European Union countries that belong to the Eurozone. It is the second most heavily traded currency in the world behind the US Dollar. In 2022, it accounted for 31% of all foreign exchange transactions, with an average daily turnover of over $2.2 trillion a day.
EUR/USD is the most heavily traded currency pair in the world, accounting for an estimated 30% off all transactions, followed by EUR/JPY (4%), EUR/GBP (3%) and EUR/AUD (2%).
The European Central Bank (ECB) in Frankfurt, Germany, is the reserve bank for the Eurozone. The ECB sets interest rates and manages monetary policy.
The ECB’s primary mandate is to maintain price stability, which means either controlling inflation or stimulating growth. Its primary tool is the raising or lowering of interest rates. Relatively high interest rates – or the expectation of higher rates – will usually benefit the Euro and vice versa.
The ECB Governing Council makes monetary policy decisions at meetings held eight times a year. Decisions are made by heads of the Eurozone national banks and six permanent members, including the President of the ECB, Christine Lagarde.
Eurozone inflation data, measured by the Harmonized Index of Consumer Prices (HICP), is an important econometric for the Euro. If inflation rises more than expected, especially if above the ECB’s 2% target, it obliges the ECB to raise interest rates to bring it back under control.
Relatively high interest rates compared to its counterparts will usually benefit the Euro, as it makes the region more attractive as a place for global investors to park their money.
Data releases gauge the health of the economy and can impact on the Euro. Indicators such as GDP, Manufacturing and Services PMIs, employment, and consumer sentiment surveys can all influence the direction of the single currency.
A strong economy is good for the Euro. Not only does it attract more foreign investment but it may encourage the ECB to put up interest rates, which will directly strengthen the Euro. Otherwise, if economic data is weak, the Euro is likely to fall.
Economic data for the four largest economies in the euro area (Germany, France, Italy and Spain) are especially significant, as they account for 75% of the Eurozone’s economy.
Another significant data release for the Euro is the Trade Balance. This indicator measures the difference between what a country earns from its exports and what it spends on imports over a given period.
If a country produces highly sought after exports then its currency will gain in value purely from the extra demand created from foreign buyers seeking to purchase these goods. Therefore, a positive net Trade Balance strengthens a currency and vice versa for a negative balance.
Dow Jones Industrial Average takes one last bullish swing for the week
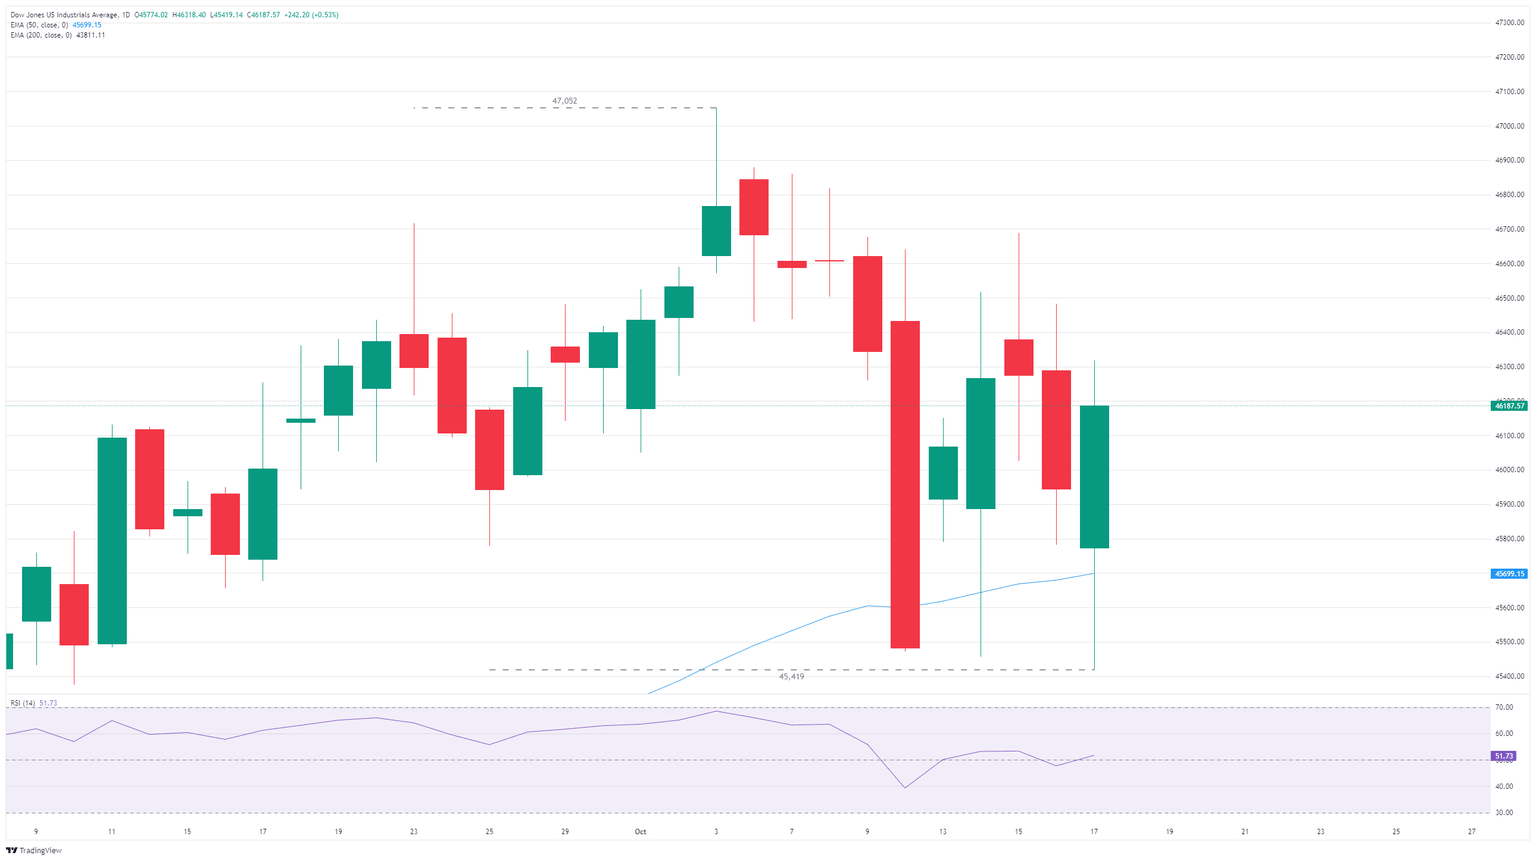
The Dow Jones Industrial Average (DJIA) found a near-term foothold to wrap up the trading week, rebounding around 240 points from recent lows and fighting to stay on the high side of key moving averages. Equities took a hit this week after multiple entities in the lending and banking sectors went bankrupt or flashed warnings about debt quality, sparking a brief period of wobbly sentiment. Investors recovered their footing to end the week.
Friday rebound takes Dow back from the brink
Friday’s equity market recovery was partly driven by hope of an easing in trade tensions after US President Donald Trump soft-balled the idea that his administration could eventually explore reducing tariffs on China. The Trump administration continues to appear more apprehensive about following through on its own threats to ramp up retaliatory tariffs on China, and investors are continuing to bank on a protracted cooling period in sweeping tariffs threatened or imposed by the Trump administration throughout 2025.
After a brief spat of angry social media posts and pulling out of planned sideline talks with China’s President Xi Jinping, President Trump has dragged himself back to the negotiating table. Fresh trade talks between Donald Trump and Xi Jinping are now expected in the coming weeks, along with meetings between US Treasury Secretary Scott Bessent and Chinese Vice Premier He Lifeng.
The US government shutdown continues to roll onward with little sign of a quick resolution. Official datasets remain suspended or delayed, but this can only be good news for markets that remain hinged largely on impending interest rate cuts from the Federal Reserve (Fed). With official data running dark amid a federal funding freeze, Fed officials will have very limited access to data that could knock the US central bank off its path toward two quarter-point interest rate cuts before the end of the year.
Dow Jones daily chart
Dow Jones FAQs
The Dow Jones Industrial Average, one of the oldest stock market indices in the world, is compiled of the 30 most traded stocks in the US. The index is price-weighted rather than weighted by capitalization. It is calculated by summing the prices of the constituent stocks and dividing them by a factor, currently 0.152. The index was founded by Charles Dow, who also founded the Wall Street Journal. In later years it has been criticized for not being broadly representative enough because it only tracks 30 conglomerates, unlike broader indices such as the S&P 500.
Many different factors drive the Dow Jones Industrial Average (DJIA). The aggregate performance of the component companies revealed in quarterly company earnings reports is the main one. US and global macroeconomic data also contributes as it impacts on investor sentiment. The level of interest rates, set by the Federal Reserve (Fed), also influences the DJIA as it affects the cost of credit, on which many corporations are heavily reliant. Therefore, inflation can be a major driver as well as other metrics which impact the Fed decisions.
Dow Theory is a method for identifying the primary trend of the stock market developed by Charles Dow. A key step is to compare the direction of the Dow Jones Industrial Average (DJIA) and the Dow Jones Transportation Average (DJTA) and only follow trends where both are moving in the same direction. Volume is a confirmatory criteria. The theory uses elements of peak and trough analysis. Dow’s theory posits three trend phases: accumulation, when smart money starts buying or selling; public participation, when the wider public joins in; and distribution, when the smart money exits.
There are a number of ways to trade the DJIA. One is to use ETFs which allow investors to trade the DJIA as a single security, rather than having to buy shares in all 30 constituent companies. A leading example is the SPDR Dow Jones Industrial Average ETF (DIA). DJIA futures contracts enable traders to speculate on the future value of the index and Options provide the right, but not the obligation, to buy or sell the index at a predetermined price in the future. Mutual funds enable investors to buy a share of a diversified portfolio of DJIA stocks thus providing exposure to the overall index.