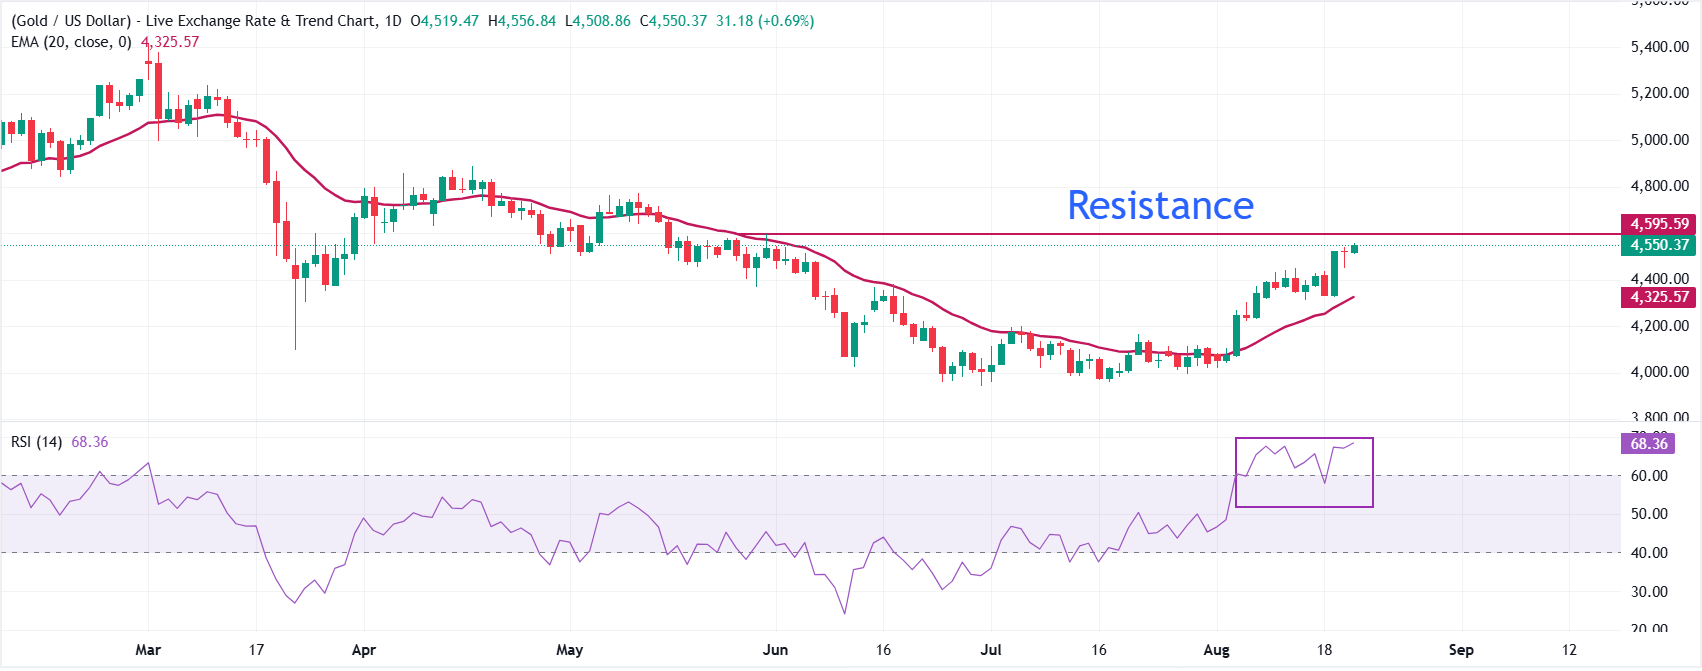
Gold accelerates its decline and gyrates around the key $4,000 mark per troy ounce on Wednesday, its lowest level since November 2025. In the meantime, tighter-for-longer Fed expectations and a broadly firmer US Dollar continue to weigh on the yellow metal, while uncertainty surrounding a potential US-Iran peace agreement has done little to revive demand for the safe haven space.
XRP nears key support as Fed hike risks suppress demand
Ripple (XRP) continues to face significant selling pressure, trading around $1.05 at the time of writing on Wednesday. This decline mirrors the broader weakness in the crypto market, exacerbated by mounting macroeconomic headwinds and persistent geopolitical uncertainties.
Should the current correction persist, XRP is at risk of revisiting the critical $1.00 support level, a threshold not tested since November 2024.
Fed rate-hike odds tick up amid geopolitical uncertainty
Market participants are pricing in a higher probability that the Federal Reserve (Fed) will raise interest rates at its September review cycle. According to the CME FedWatch tool, the odds of interest rates being higher than current levels in September spiked to 70%, up from 44% one week ago. The probability has moderated to above 50% as of writing.

Headline inflation surged to 4.2% year-over-year in May, according to the latest Consumer Price Index (CPI) data, up from 3.8% in April, a level not seen in more than three years.
At a June 17 post-meeting press conference, Fed Chairman Kevin Warsh reaffirmed the central bank’s commitment to its 2% inflation target and price stability mandate. This increasingly hawkish tone has fueled expectations for a rate hike, which had previously remained subdued throughout the first quarter.
Meanwhile, the United States and Iran remain at odds over the narrative surrounding nuclear talks. President Donald Trump maintains that Iran has consented to the most stringent inspections, while Iranian officials contend that nuclear issues were not addressed in detail during the latest negotiation round.
The broader crypto market remains under intense pressure and low risk appetite. According to the Fear & Greed Index, sentiment stands in the Extreme Fear territory at 17 on Wednesday, down from 23 the previous day. This sustained risk-off mood may continue to limit recovery potential.

XRP retail demand is suppressed, as reflected in perpetual futures Open Interest (OI) falling to $2.58 billion on Wednesday, from $2.69 billion the day before. The current OI level pales in comparison to the record high of $10.94 billion in July, which coincided with XRP hitting a new all-time high of $3.66. Persistent weakness in the derivatives market means low liquidity and capped tailwinds.

Price analysis: XRP sellers tighten grip toward $1.00 key support
XRP trades at $1.09 keeping a bearish near-term tone as price holds well beneath the 50-day, 100-day and 200-day Exponential Moving Averages (EMAs) at $1.24, $1.34 and $1.55 respectively. The pair is also trading under the Bollinger Bands’ middle line at $1.14, underscoring persistent overhead supply, while the lower band at $1.07 offers the nearest volatility-based floor.
Meanwhile, momentum appears mixed, with the Moving Average Convergence Divergence (MACD) histogram in marginal positive territory on the daily chart, while the Relative Strength Index (RSI) hovering around 35, hints at weak demand rather than a robust recovery.

Initial resistance lies at the Bollinger middle band near $1.14, followed by the upper band around $1.22. A sustained break above these would open the door to the 50-day EMA at $1.24, with the 100-day EMA at $1.34 and the 200-day EMA at $1.55 acting as more distant caps.
Conversely, the Bollinger lower band at $1.07 is the first notable support, followed by the recent low around $1.05 and the critical $1.00 psychological demand area. A daily close below this latter level would expose further downside and reinforce the prevailing bearish bias.
(The technical analysis of this story was written with the help of an AI tool.)
Ripple FAQs
United States Current Account came in at $-226.8B below forecasts ($-217.5B) in 1Q
Gold remains under persistent selling pressure and trades below $4,050 on Wednesday, losing more than 1.5% on the day. Hawkish Fed prising, broad-based US Dollar strength and the uncertainty surrounding the US-Iran peace agreement make it difficult for the precious metal to find a foothold.
Germany IFO – Expectations registered at 84.1, below expectations (85) in June
Gold rebounds from a nearly two-week low of $4,050 in the early European session on Wednesday. Despite easing inflationary concerns in the face of the recent fall in Crude Oil prices, traders have been pricing in a greater chance of a rate hike by the US Federal Reserve, which will continue to limit the bullion’s recovery.
Swiss Franc slips to seven-month lows ahead of ZEW Survey Expectations

USD/CHF extends its gains for the sixth successive day, reaching a seven-month high of 0.8107 during the Asian hours on Wednesday. The pair rises as the Greenback strengthens on the complex Middle East situation. Traders will likely observe the Swiss ZEW Survey – Expectations for June and the Q2 SNB Quarterly Bulletin due later in the day.
US President Donald Trump stated that Iran had “fully and completely” agreed to open its facilities to nuclear inspections, while Iranian Foreign Minister Abbas Araghchi quickly tempered expectations by clarifying that substantive nuclear negotiations have not actually begun.
Additionally, Iran’s chief negotiator issued a stern warning that the strategic Strait of Hormuz will never return to its pre-war status and will remain firmly under Iranian oversight. Meanwhile, diplomatic efforts showed signs of progress elsewhere as Washington hosted a fresh round of talks between Israel and Lebanon, aimed at securing a ceasefire with Iran-backed Hezbollah.
June’s flash estimate for the US S&P Global Composite Purchasing Managers’ Index (PMI) climbed to 52.2, comfortably beating May’s reading of 51.5 and signaling healthy business expansion. The US manufacturing sector showed remarkable resilience, with output jumping to 55.7 from the previous month’s 55.1, easily outperforming forecasts of 54.8. Simultaneously, the Services PMI printed at 51.3, ticking up from May’s 50.7 and clearing the consensus estimate of 51.0, proving that demand in the broader service economy remains incredibly sticky.
The CME FedWatch tool indicates that the markets adjusted expectations for a more hawkish stance from the Federal Reserve (Fed). Traders are now pricing in a nearly 86.1% chance of a Fed hike in December, up from 61% before last week’s FOMC meeting.
The Swiss National Bank (SNB) kept its policy rate at 0% for the fourth straight meeting in June, maintaining its current stance, which continues to support both price stability and economic growth. However, the central bank raised its inflation forecast and reaffirmed its readiness to intervene in the foreign exchange markets to curb the Franc’s strength.
Swiss Franc FAQs
The Swiss Franc (CHF) is Switzerland’s official currency. It is among the top ten most traded currencies globally, reaching volumes that well exceed the size of the Swiss economy. Its value is determined by the broad market sentiment, the country’s economic health or action taken by the Swiss National Bank (SNB), among other factors. Between 2011 and 2015, the Swiss Franc was pegged to the Euro (EUR). The peg was abruptly removed, resulting in a more than 20% increase in the Franc’s value, causing a turmoil in markets. Even though the peg isn’t in force anymore, CHF fortunes tend to be highly correlated with the Euro ones due to the high dependency of the Swiss economy on the neighboring Eurozone.
The Swiss Franc (CHF) is considered a safe-haven asset, or a currency that investors tend to buy in times of market stress. This is due to the perceived status of Switzerland in the world: a stable economy, a strong export sector, big central bank reserves or a longstanding political stance towards neutrality in global conflicts make the country’s currency a good choice for investors fleeing from risks. Turbulent times are likely to strengthen CHF value against other currencies that are seen as more risky to invest in.
The Swiss National Bank (SNB) meets four times a year – once every quarter, less than other major central banks – to decide on monetary policy. The bank aims for an annual inflation rate of less than 2%. When inflation is above target or forecasted to be above target in the foreseeable future, the bank will attempt to tame price growth by raising its policy rate. Higher interest rates are generally positive for the Swiss Franc (CHF) as they lead to higher yields, making the country a more attractive place for investors. On the contrary, lower interest rates tend to weaken CHF.
Macroeconomic data releases in Switzerland are key to assessing the state of the economy and can impact the Swiss Franc’s (CHF) valuation. The Swiss economy is broadly stable, but any sudden change in economic growth, inflation, current account or the central bank’s currency reserves have the potential to trigger moves in CHF. Generally, high economic growth, low unemployment and high confidence are good for CHF. Conversely, if economic data points to weakening momentum, CHF is likely to depreciate.
As a small and open economy, Switzerland is heavily dependent on the health of the neighboring Eurozone economies. The broader European Union is Switzerland’s main economic partner and a key political ally, so macroeconomic and monetary policy stability in the Eurozone is essential for Switzerland and, thus, for the Swiss Franc (CHF). With such dependency, some models suggest that the correlation between the fortunes of the Euro (EUR) and the CHF is more than 90%, or close to perfect.
Australia CPI set to show inflation accelerated again in May

The Australian Bureau of Statistics (ABS) will publish the high-impact Consumer Price Index (CPI) for May on Wednesday at 01:30 GMT.
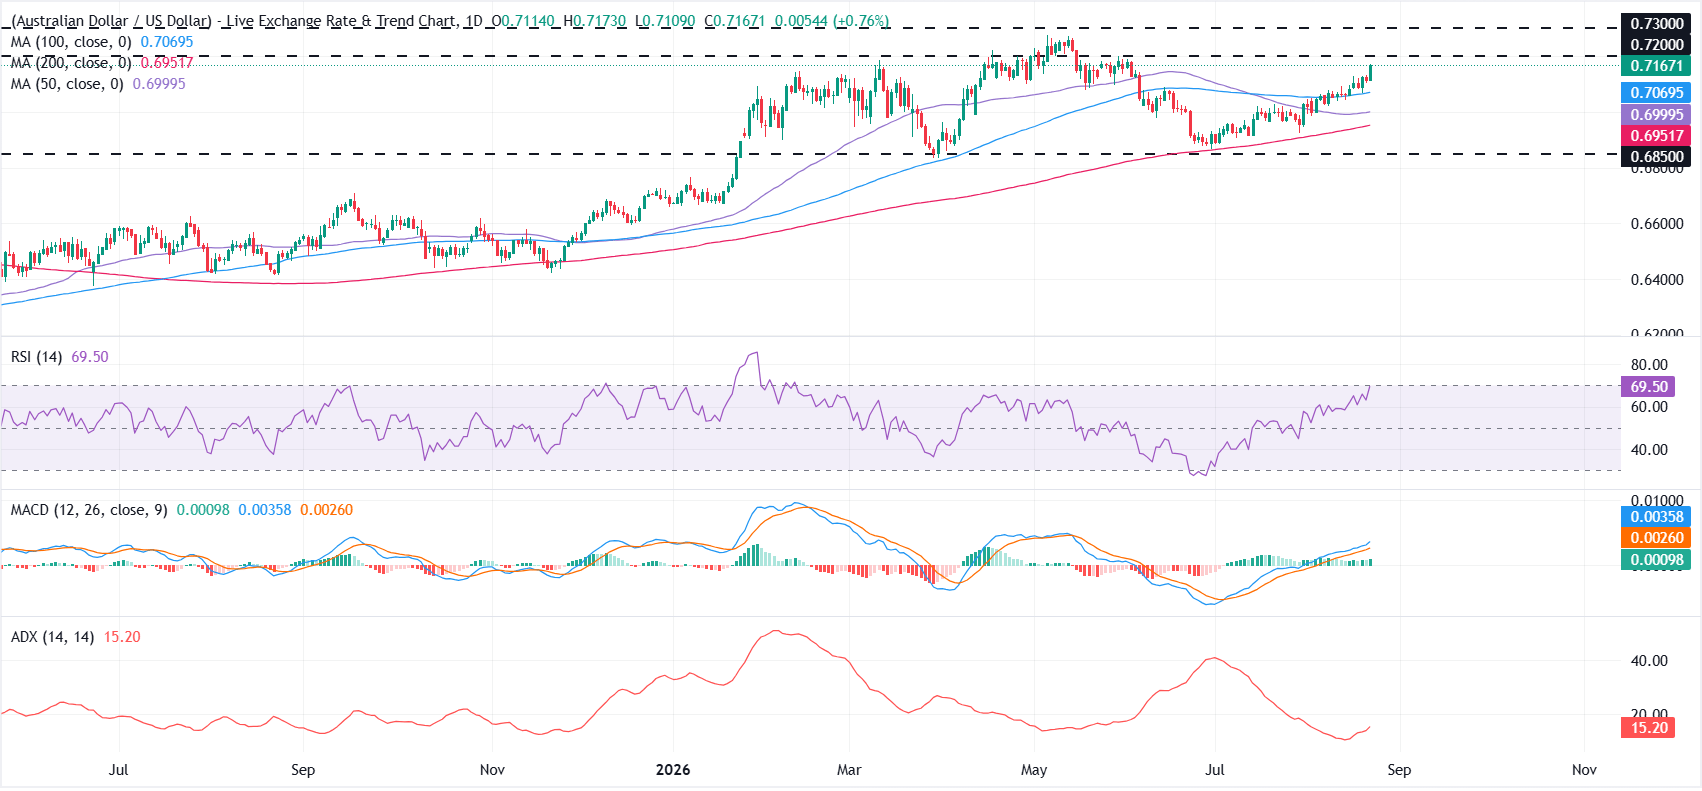
Heading into the inflation test, the Australian Dollar (AUD) is at its lowest level in two months against the US Dollar (USD), having surrendered the 0.7000 psychological mark.
What to expect from Australia’s inflation rate data?
Australia’s annual CPI is expected to rise by 4.4% in May after increasing by 4.2% in April, inching close to the near three-year high of 4.6% seen in March. The monthly CPI is seen declining by 0.3% in the same period, following a 0.4% growth reported previously.
The Trimmed Mean CPI inflation is likely to pick up slightly to 3.5% year-over-year (YoY) in May from 3.4%, while the month-over-month (MoM) figure is set to hold steady at 0.3%.
The inflation data release comes after the Reserve Bank of Australia (RBA) held the Official Cash Rate (OCR) at 4.35% last week, pausing after three consecutive rate hikes since the beginning of the year.
The RBA stated that the “board remains focused on ensuring that inflation does not become embedded once the impulse from higher oil prices has passed through.”
“The board will be attentive to the data and the evolving assessment of the outlook and risks to guide its decisions,” the central bank further noted.
Since the RBA monetary policy meeting, geopolitical tensions have eased somewhat. The United States (US) and Iran struck a peace deal, sending Oil prices sharply lower. That could help alleviate the pressure on Australian inflation in the months ahead.
The divergence between the monthly and annual figures could be justified by a roughly 12% fall in fuel prices over the month amid easing global oil prices and a domestic fuel excise cut, which is set to expire this month.
Meanwhile, new dwelling costs and rents are expected to provide upward pressure on housing inflation.
However, the Trimmed Mean measures will be closely scrutinized to assess whether second-round pass-through from the Middle East energy shock is broadening into the wider services and housing basket.
The RBA closely watches this underlying inflation trend for policy signals.
How could the Consumer Price Index report affect AUD/USD?
AUD/USD is languishing below 0.7000 in the run-up to the inflation showdown, with buyers awaiting a surprise uptick in the annual and monthly Trimmed Mean CPI inflation data to rescue the Australian Dollar.
A softer headline driven by sharply lower fuel prices, but stubbornly high underlying inflation, will keep the RBA on high alert and hopes for rate hikes alive.
On the other hand, easing inflationary pressures in Australia would push back against expectations of the RBA resuming rate hikes late this year, further weighing on the AUD.
Dhwani Mehta, Asian Session Lead Analyst at FXStreet, highlights key technical levels for trading AUD/USD on the CPI release.
“The pair is maintaining a bearish near-term bias as it holds beneath the 21-day, the 50-day and the 100-day Simple Moving Averages (SMAs), clustered between 0.7070 and 0.7135. The pair sits only above the 200-day SMA at 0.6855, which acts as the last meaningful layer of trend support, while the Relative Strength Index (RSI) at 32 is approaching oversold territory, hinting that downside momentum is stretched but not yet exhausted.
On the topside, initial resistance is aligned with the 21-day SMA at 0.7077, followed closely by the 100-day SMA at 0.7085, with the 50-day SMA higher up at 0.7136 reinforcing a broader cap on recovery attempts. On the downside, the 200-day SMA at 0.6855 is the key support to watch; a decisive break below this longer-term measure would likely open the door to a deeper bearish extension in the coming sessions”.
(The technical analysis of this story was written with the help of an AI tool.)
Economic Indicator
Consumer Price Index (YoY)
The Consumer Price Index (CPI), released by the Australian Bureau of Statistics on a monthly basis, measures the changes in the price of a comprehensive basket of goods and services acquired by household consumers. The indicator is the primary measure of headline inflation after a new methodology was applied to transition from quarterly to monthly readings, applying to data from April 2024 onwards. The YoY reading compares prices in the reference month to the same month a year earlier. A high reading is seen as bullish for the Australian Dollar (AUD), while a low reading is seen as bearish.
Inflation FAQs
Inflation measures the rise in the price of a representative basket of goods and services. Headline inflation is usually expressed as a percentage change on a month-on-month (MoM) and year-on-year (YoY) basis. Core inflation excludes more volatile elements such as food and fuel which can fluctuate because of geopolitical and seasonal factors. Core inflation is the figure economists focus on and is the level targeted by central banks, which are mandated to keep inflation at a manageable level, usually around 2%.
The Consumer Price Index (CPI) measures the change in prices of a basket of goods and services over a period of time. It is usually expressed as a percentage change on a month-on-month (MoM) and year-on-year (YoY) basis. Core CPI is the figure targeted by central banks as it excludes volatile food and fuel inputs. When Core CPI rises above 2% it usually results in higher interest rates and vice versa when it falls below 2%. Since higher interest rates are positive for a currency, higher inflation usually results in a stronger currency. The opposite is true when inflation falls.
Although it may seem counter-intuitive, high inflation in a country pushes up the value of its currency and vice versa for lower inflation. This is because the central bank will normally raise interest rates to combat the higher inflation, which attract more global capital inflows from investors looking for a lucrative place to park their money.
Formerly, Gold was the asset investors turned to in times of high inflation because it preserved its value, and whilst investors will often still buy Gold for its safe-haven properties in times of extreme market turmoil, this is not the case most of the time. This is because when inflation is high, central banks will put up interest rates to combat it.
Higher interest rates are negative for Gold because they increase the opportunity-cost of holding Gold vis-a-vis an interest-bearing asset or placing the money in a cash deposit account. On the flipside, lower inflation tends to be positive for Gold as it brings interest rates down, making the bright metal a more viable investment alternative.
United States Dollar Index climbs to its highest level since May 2025 on Fed hike bets
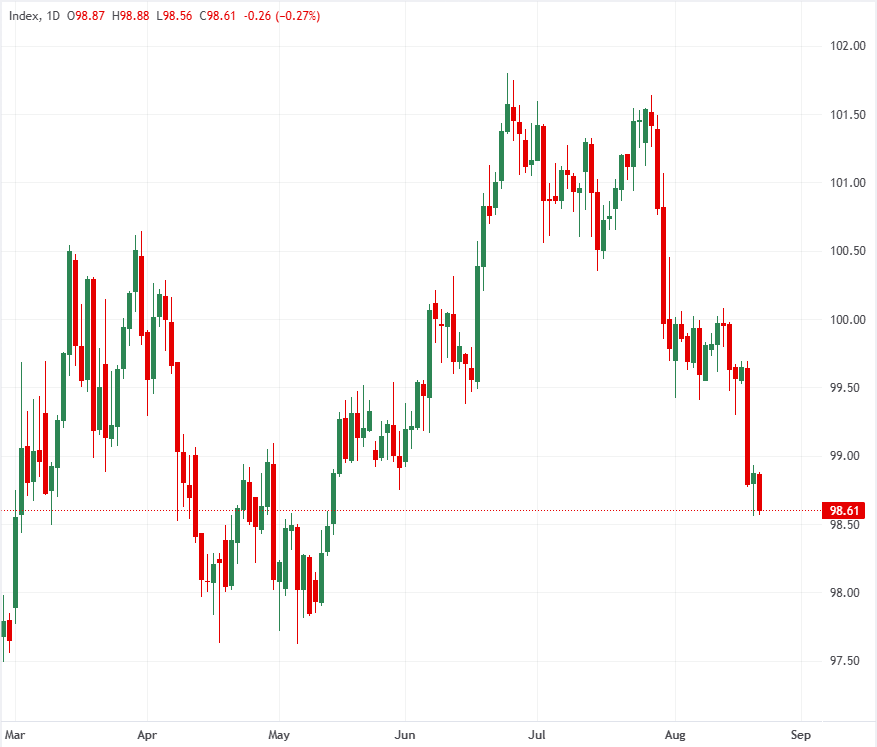
The US Dollar Index (DXY), which tracks the Greenback’s value against a basket of six major currencies, extends its rally on Tuesday, climbing to its highest level since May 2025. At the time of writing, the index trades around 100.40, up 0.4% on the day.
The Dollar’s advance gathered pace after the index decisively cleared the 100.00 mark, ending a prolonged period of range-bound trading. The upside comes as traders increasingly price in the possibility of a Federal Reserve (Fed) interest rate hike later this year following last week’s monetary policy meeting, where Chair Kevin Warsh reiterated the central bank’s commitment to bringing inflation back to its 2% target.
Meanwhile, resilient US economic data have bolstered expectations that the Fed can afford to raise borrowing costs. Economic activity remains in expansion territory, while the labor market appears to be stabilizing.
The preliminary S&P Global Services Purchasing Managers Index (PMI) rose to 51.3 from 50.7, while the Manufacturing PMI accelerated to 55.7 from 55.1. Both readings exceeded market expectations. The four-week average of ADP Employment Change climbed to 30.75K from 26.5K.
Markets are currently pricing in a 70% chance of a rate hike at the September meeting, according to the CME FedWatch Tool. Attention now turns to the Personal Consumption Expenditures (PCE) inflation report and the final estimate of first-quarter Gross Domestic Product (GDP), both due on Thursday, for fresh clues on the Fed’s policy outlook.
At the same time, focus remains on US-Iran negotiations after both sides reached a 60-day Memorandum of Understanding (MoU) last week. Talks are progressing, but the situation remains fluid and the risk of setbacks persists, particularly over Iran’s nuclear program. Uncertainty over whether a final deal can be reached is keeping safe-haven demand for the US Dollar intact.
Technical Analysis:

On the daily chart, the Dollar’s near-term bias is bullish as price extends well above the 50-, 100- and 200-day Simple Moving Averages (SMAs), which fan out below the market and suggest a reinforced underlying uptrend.
Momentum aligns with this constructive tone, with the Relative Strength Index (RSI) at 73.4 edging deeper into overbought territory while the Average Directional Index (ADX) near 36 signals a strengthening trend.
On the topside, initial resistance emerges at 102.00, where a horizontal barrier caps further gains ahead of a more distant ceiling near 103.50. On the downside, immediate attention lies on the psychological 100.00 level as first support, followed by a dense demand band formed by the 50-day SMA around 99.10, the 100-day SMA near 98.90 and the 200-day SMA at 98.77, with a deeper structural floor only seen toward 97.50 if a sharper correction unfolds from overbought conditions.
(The technical analysis of this story was written with the help of an AI tool.)
US Dollar Price Today
The table below shows the percentage change of US Dollar (USD) against listed major currencies today. US Dollar was the strongest against the Australian Dollar.
| USD | EUR | GBP | JPY | CAD | AUD | NZD | CHF | |
|---|---|---|---|---|---|---|---|---|
| USD | 0.42% | 0.49% | -0.02% | 0.36% | 1.30% | 0.78% | 0.21% | |
| EUR | -0.42% | 0.05% | -0.44% | -0.08% | 0.84% | 0.37% | -0.22% | |
| GBP | -0.49% | -0.05% | -0.47% | -0.11% | 0.81% | 0.32% | -0.26% | |
| JPY | 0.02% | 0.44% | 0.47% | 0.36% | 1.30% | 0.81% | 0.21% | |
| CAD | -0.36% | 0.08% | 0.11% | -0.36% | 0.94% | 0.46% | -0.14% | |
| AUD | -1.30% | -0.84% | -0.81% | -1.30% | -0.94% | -0.45% | -1.10% | |
| NZD | -0.78% | -0.37% | -0.32% | -0.81% | -0.46% | 0.45% | -0.61% | |
| CHF | -0.21% | 0.22% | 0.26% | -0.21% | 0.14% | 1.10% | 0.61% |
The heat map shows percentage changes of major currencies against each other. The base currency is picked from the left column, while the quote currency is picked from the top row. For example, if you pick the US Dollar from the left column and move along the horizontal line to the Japanese Yen, the percentage change displayed in the box will represent USD (base)/JPY (quote).
“Global imbalances are growing and may also be fuelling financial stability risks”: BoC’s Macklem

Bank of Canada (BoC) Governor Tiff Macklem said on Tuesday that global imbalances are increasing and may risk financial stability. Speaking to a business audience in Paris., Macklem noted that China’s outward flow of capital continues with the United States remaining the biggest destination for those flows.
Key takeaways:
Imbalances are growing as China’s outward flow of capital continues, and the United States has been the biggest destination of capital.
Global imbalances are growing and may also be fuelling financial stability risks.
While imbalances adjust slowly, attractiveness of US Dollar may have let imbalances persist longer.
Leveraged trading strategies of hedge funds and non-bank financial intermediaries may be making this core market more fragile.
Even as the US has pulled back from open trade, others should look to deepen trade and investment relationships.
If we want a more balanced and resilient global system, we need to create more places for savings to go beyond just the US.”
Indian Rupee drops against US Dollar amid hawkish Fed bets
The Indian Rupee (INR) trades lower against the US Dollar (USD) during India’s afternoon trading hours on Tuesday. The USD/INR pair rises to near 94.85 as a firm US Dollar due to escalated hawkish Federal Reserve (Fed) bets has faded the impact of lower oil prices amid progress in the United States (US)-Iran peace talks for a lasting deal.
During press time, the US Dollar Index (DXY), which gauges the Greenback’s value against six major currencies, trades firmly near 101.00, the highest level seen in over a year.
Hawkish Fed bets continue to support US Dollar
The US Dollar continues to outperform its currency peers, as market experts appear confident that the Federal Reserve (Fed) will deliver a number of interest rate hikes this year.
Analysts at Bank of America (BofA) expect the Fed to deliver three interest rate hikes of 25 basis points (bps) in September, October, and December meetings, a sharp turnaround from the anticipation that the central bank will stand pat this year.
“The data simply don’t warrant cuts this year. Core inflation is too high, and moving up. The solid April jobs report was the last straw, especially given hawkish Fedspeak,” BofA analyst said.
In the monetary policy announcement last week, the Fed left interest rates unchanged in the range of 3.50%-3.75%, as expected; however, the dot plot, which reflects where policymakers collectively see the Federal Funds Rate heading in the short-to-long term, showed that interest rates could reach 3.8% by the year-end.
Oil prices decline amid continued progress in US-Iran talks
In India’s afternoon trading hours on Tuesday, the MCX Crude Oil contract expiring on July 20 is 0.2% higher to near 7,000, but is close to its over three-month low of 6,897 posted last week. Oil prices have remained lower amid progress in technical talks between the US and Iran.
Earlier in the day, US Vice President (VP) JD Vance expressed progress in technical talks with Tehran. “Yes, there was a little bit of threatening, there was a little bit of whining, but at the end of the day, the talks continued, and we made great progress,” Vance said, CNBC reported.
On Monday, US VP Vance said that Tehran had agreed to permit International Atomic Energy Agency (IAEA) inspectors back into Iran, calling it a “major milestone for the American people and the first step in permanently denuclearizing or permanently ending a nuclear weapons program in Iran.”
Lower oil prices bode well for currencies from economies, such as India, which rely heavily on oil imports to meet their energy needs.
India’s flash HSBC PMI expands moderately
India’s preliminary HSBC Purchasing Managers’ Index (PMI) expands again in June; however, the pace of growth has moderated in both manufacturing and services sector activity. The Composite PMI has arrived at 57.4, lower than 59.3 in May.
“Private sector activity eased a bit in June. Growth of manufacturing output softened a tad as inventory-building lost steam after a few hectic months. New export orders remained resilient and the order-to-inventory ratio ticked up, pointing at resilient manufacturing activity down the line. Input costs across the private sector rose, but at the slowest pace in five months,” Pranjul Bhandari, Chief India Economist at HSBC, said.
Technical Analysis: USD/INR strives to return to 20-day EMA

USD/INR trades higher at around 94.85, but still holding a bearish near-term bias as price sits below the 20-period Exponential Moving Average (EMA) at 94.99 and under a broader downward resistance trend line that comes in near 95.57. The loss of traction below these caps suggests rallies are likely to be faded, while the Relative Strength Index (14) hovering under the 50 mark on the daily chart hints at waning upward momentum rather than outright oversold conditions.
On the topside, initial resistance is located at the 20-period EMA around 95.00, with a stronger barrier at the descending trend line near 95.57, which would need to be cleared to ease the current downside pressure. On the downside, immediate focus stays on the rising support trend line near 94.22, acting as the next key floor; a decisive break beneath this latter level would open the door to a deeper retracement within the broader uptrend structure.
(The technical analysis of this story was written with the help of an AI tool.)
Singapore Consumer Price Index (YoY) registered at 1.8, below expectations (2) in May
Gold is back in the red early Tuesday, having faced rejection once again at $4,200. The US Dollar holds at yearly highs amid hawkish Fed outlook, scepticism over US-Iran deal progress. Gold is primed to attack $4,100 as the daily technical setup remains in favor of sellers.