Mainstream adoption of Dogecoin could increase its real utility for everyday spending, according to Timothy Stebbing, director of the Dogecoin Foundation. Crypto projects need to deliver value to the next generation, aged around 15 or older, who will experience mainstream crypto.
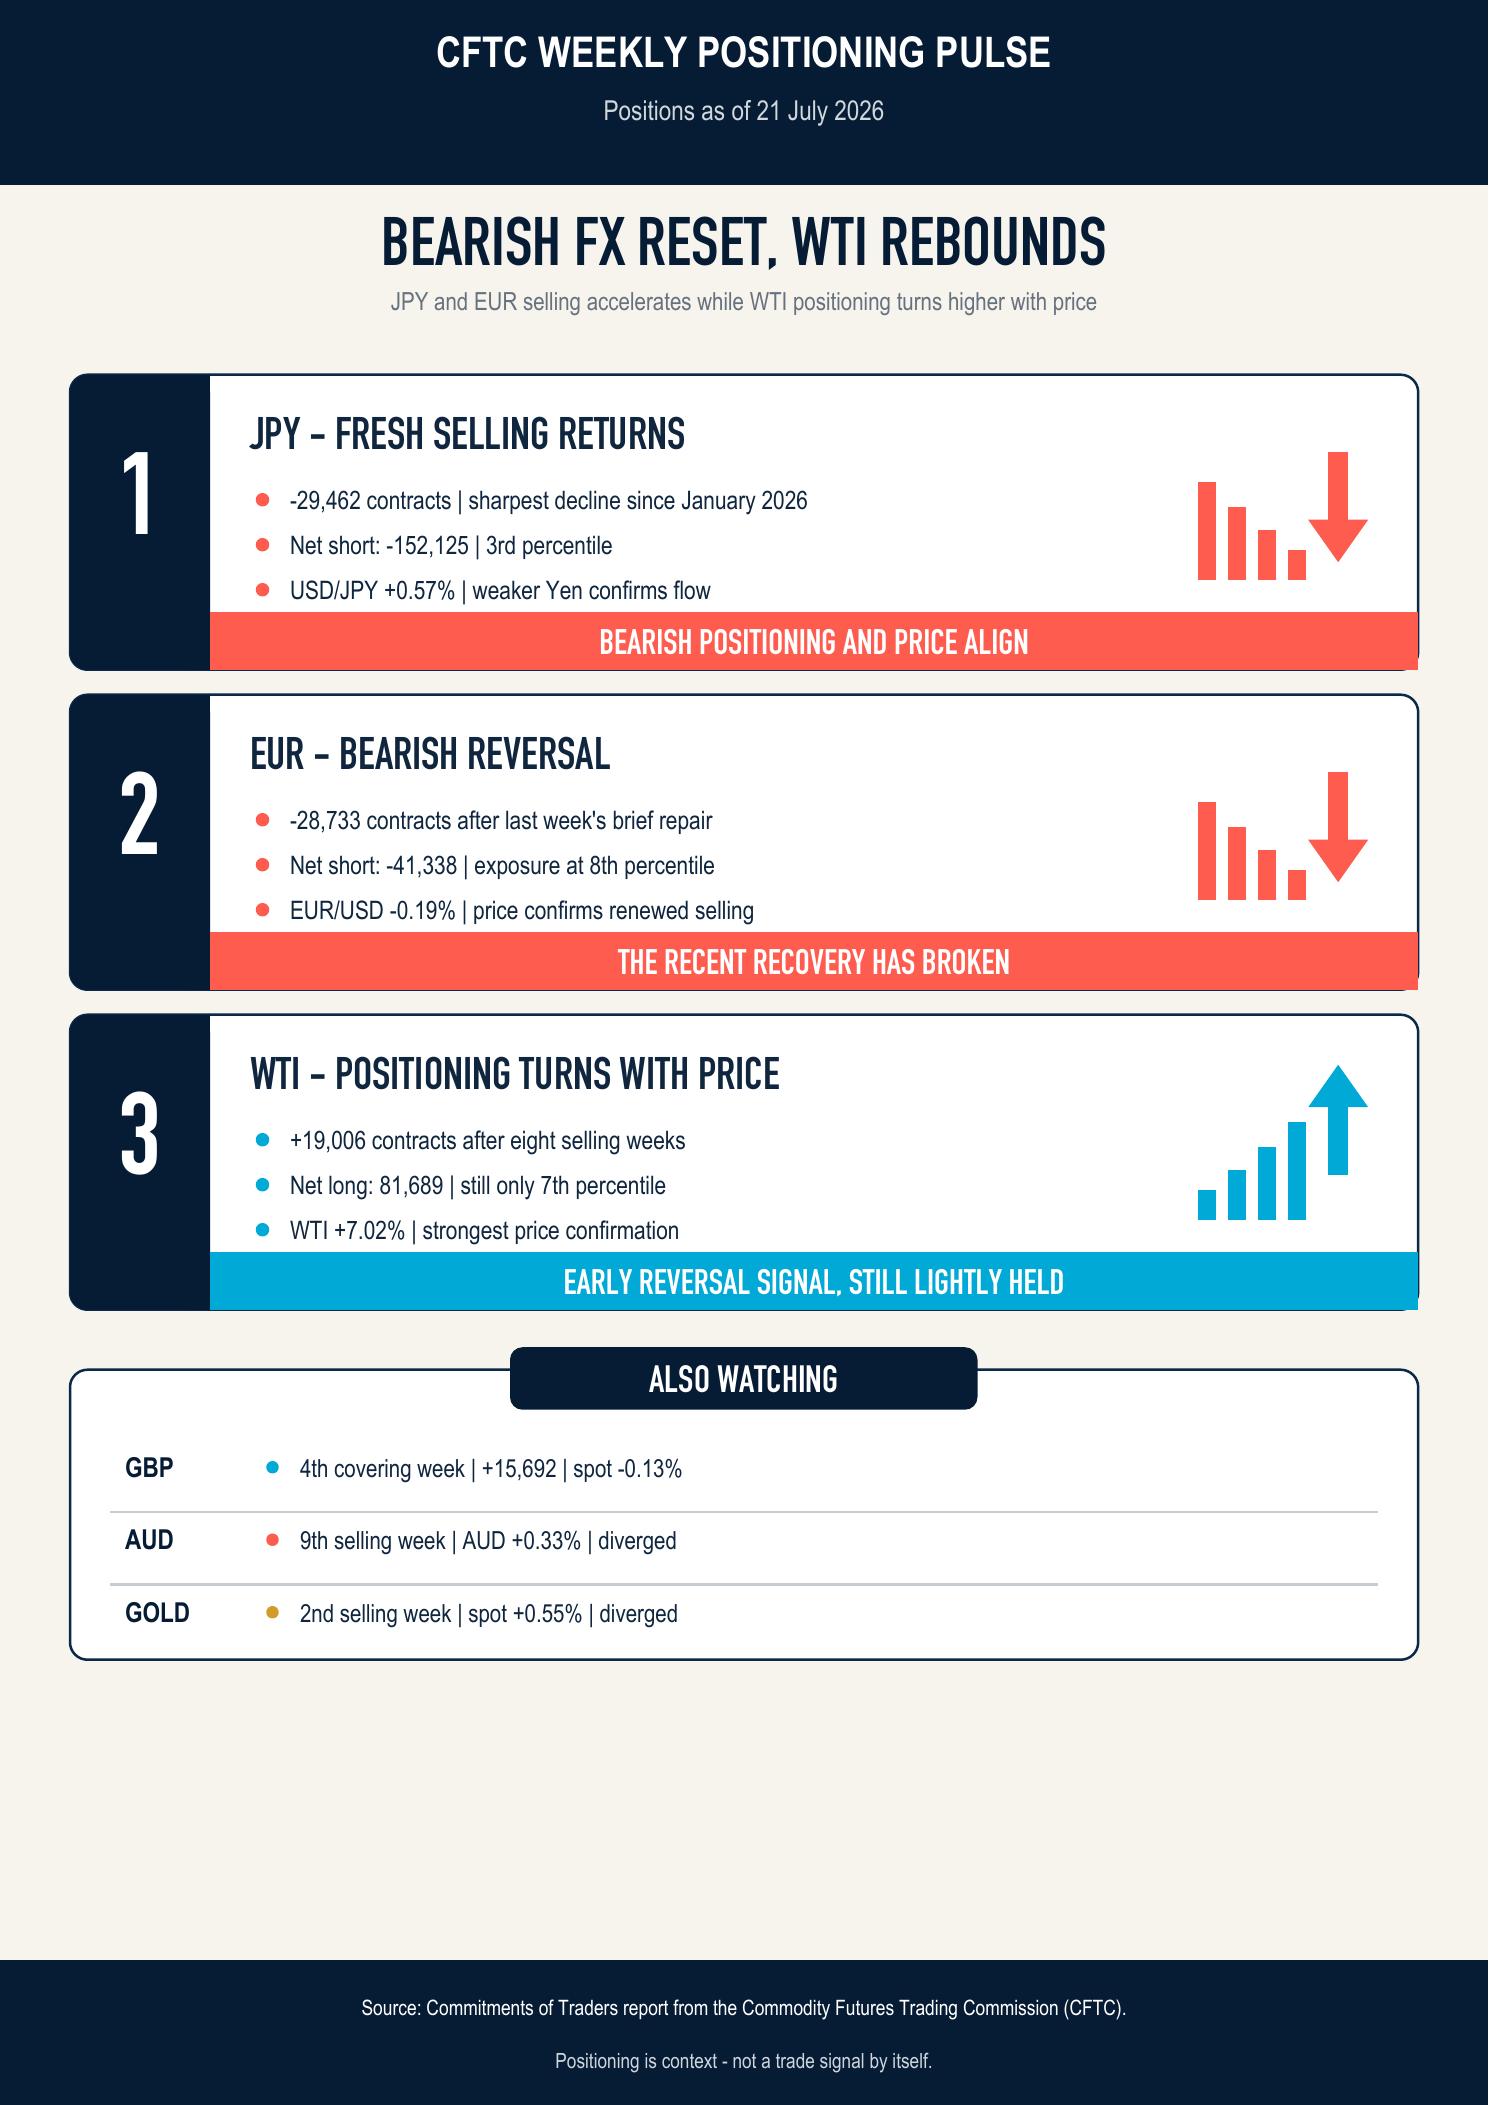
United States CFTC Gold NC Net Positions fell from previous $159.8K to $154.3K
Mainstream adoption of Dogecoin could increase its real utility for everyday spending, according to Timothy Stebbing, director of the Dogecoin Foundation. Crypto projects need to deliver value to the next generation, aged around 15 or older, who will experience mainstream crypto.
Gold approaches $4,600 as US-Iran deal hopes pressure Oil, US Dollar
Gold (XAU/USD) extends its rebound on Friday as traders assess the prospects of a potential US-Iran deal. At the time of writing, XAU/USD trades around $4,583 after recovering from a two-month low of $4,366 touched on Thursday.
Risk sentiment improved after US President Donald Trump said on Friday that “the naval blockade will now be lifted” and added that he would be meeting in the Situation Room “to make a final determination” on Iran. This comes after Axios reported on Thursday that the US and Iran reached a 60-day memorandum of understanding (MOU).
The deal would extend the current ceasefire and reopen the Strait of Hormuz. During this period, both sides would continue talks on Iran’s nuclear program. Iran’s Tasnim news agency reported that the deal is not finalized or confirmed.
Oil prices turned lower following the latest developments, with West Texas Intermediate (WTI) trading around $85 per barrel and heading for its first monthly decline in five months. Still, crude prices remain well above pre-war levels, keeping inflation concerns in focus.
US Treasury Secretary Scott Bessent said on Thursday that Trump has three conditions for any agreement. Iran must reopen the Strait of Hormuz, hand over its enriched uranium and fully end its nuclear program.
However, improving sentiment is weighing on the US Dollar. The US Dollar Index (DXY), which tracks the Greenback’s value against a basket of six major currencies, slips below its two-week-old range and trades around 98.80 at the time of writing after touching a seven-week high of 99.54 on Thursday.
Still, Gold’s upside could remain limited, while hawkish signals from the Federal Reserve (Fed) linked to elevated Oil prices act as a headwind. The precious metal is on course for a third monthly drop.
The latest US Personal Consumption Expenditure (PCE) inflation data also reinforced expectations that the Fed could keep interest rates higher for longer as inflation pushes further away from the central bank’s 2% target.
Kansas City Fed President Jeff Schmid said on Friday that policymakers “may need to weigh how to make monetary policy more restrictive” and stressed that the Fed “must signal commitment to lowering inflation.”
Philadelphia Fed President Anna Paulson said that “inflation is too high, and was too high even before the war started.” Paulson added that “holding rates steady gives Fed space to weigh data” and said monetary policy is “well positioned.”
Looking ahead, the US economic calendar remains relatively light on Friday, leaving Gold at the mercy of Fed commentary and headlines surrounding US-Iran talks.
Technical Analysis: XAU/USD rebounds from two-month low

XAU/USD sits just under the 20-day Bollinger simple moving average around $4,587.97, leaving the near-term tone broadly neutral and slightly capped by that mid-line, while the lower band near $4,414.50 offers a distant volatility floor.
The Relative Strength Index (RSI) hovers around 48, hinting at balanced momentum, and the Average Directional Index (ADX) near 24 suggests a relatively weak underlying trend as price consolidates in the upper half of the recent Bollinger envelope.
On the topside, initial resistance is defined by the 20-day Bollinger simple moving average at roughly $4,588, with the upper Bollinger band next at about $4,761 acting as a wider bullish extension barrier.
On the downside, immediate demand is expected ahead of the lower Bollinger band around $4,415, where a break would open the door to a deeper corrective phase within the broader range-bound structure.
(The technical analysis of this story was written with the help of an AI tool.)
Inflation FAQs
Inflation measures the rise in the price of a representative basket of goods and services. Headline inflation is usually expressed as a percentage change on a month-on-month (MoM) and year-on-year (YoY) basis. Core inflation excludes more volatile elements such as food and fuel which can fluctuate because of geopolitical and seasonal factors. Core inflation is the figure economists focus on and is the level targeted by central banks, which are mandated to keep inflation at a manageable level, usually around 2%.
The Consumer Price Index (CPI) measures the change in prices of a basket of goods and services over a period of time. It is usually expressed as a percentage change on a month-on-month (MoM) and year-on-year (YoY) basis. Core CPI is the figure targeted by central banks as it excludes volatile food and fuel inputs. When Core CPI rises above 2% it usually results in higher interest rates and vice versa when it falls below 2%. Since higher interest rates are positive for a currency, higher inflation usually results in a stronger currency. The opposite is true when inflation falls.
Although it may seem counter-intuitive, high inflation in a country pushes up the value of its currency and vice versa for lower inflation. This is because the central bank will normally raise interest rates to combat the higher inflation, which attract more global capital inflows from investors looking for a lucrative place to park their money.
Formerly, Gold was the asset investors turned to in times of high inflation because it preserved its value, and whilst investors will often still buy Gold for its safe-haven properties in times of extreme market turmoil, this is not the case most of the time. This is because when inflation is high, central banks will put up interest rates to combat it.
Higher interest rates are negative for Gold because they increase the opportunity-cost of holding Gold vis-a-vis an interest-bearing asset or placing the money in a cash deposit account. On the flipside, lower inflation tends to be positive for Gold as it brings interest rates down, making the bright metal a more viable investment alternative.
Fed’s Schmid: Surging oil is weighing on spending power

Kansas City Federal Reserve (Fed) Bank President Jeffrey Schmid said during the European trading session on Friday that elevated energy prices are diminishing households’ purchasing power.
Additional remarks
Some evidence AI is depressing hiring but not driving firing.
US economy less exposed to energy shock relative to the past.
Main focus is on getting inflation back to 2% target.
So far, US energy producers have not been moving to invest in more production.
Most data points to continued economic growth.
Job market in balance, buoyed in part by healthcare hiring.
Fed must signal commitment to lowering inflation.
My primary concern is inflation, which is ‘too hot’.
I place little stock in believing recent inflation jump is transitory.
Low hiring is a more general phenomenon, not only due to AI.
The Fed must signal commitment to price stability.
Market reaction
There seems to be no immediate response by the US Dollar (USD) to Fed Schmid’s comments. As of writing, the US Dollar Index (DXY) trades 0.1% higher at around 99.10.
Fed FAQs
Monetary policy in the US is shaped by the Federal Reserve (Fed). The Fed has two mandates: to achieve price stability and foster full employment. Its primary tool to achieve these goals is by adjusting interest rates.
When prices are rising too quickly and inflation is above the Fed’s 2% target, it raises interest rates, increasing borrowing costs throughout the economy. This results in a stronger US Dollar (USD) as it makes the US a more attractive place for international investors to park their money.
When inflation falls below 2% or the Unemployment Rate is too high, the Fed may lower interest rates to encourage borrowing, which weighs on the Greenback.
The Federal Reserve (Fed) holds eight policy meetings a year, where the Federal Open Market Committee (FOMC) assesses economic conditions and makes monetary policy decisions.
The FOMC is attended by twelve Fed officials – the seven members of the Board of Governors, the president of the Federal Reserve Bank of New York, and four of the remaining eleven regional Reserve Bank presidents, who serve one-year terms on a rotating basis.
In extreme situations, the Federal Reserve may resort to a policy named Quantitative Easing (QE). QE is the process by which the Fed substantially increases the flow of credit in a stuck financial system.
It is a non-standard policy measure used during crises or when inflation is extremely low. It was the Fed’s weapon of choice during the Great Financial Crisis in 2008. It involves the Fed printing more Dollars and using them to buy high grade bonds from financial institutions. QE usually weakens the US Dollar.
Quantitative tightening (QT) is the reverse process of QE, whereby the Federal Reserve stops buying bonds from financial institutions and does not reinvest the principal from the bonds it holds maturing, to purchase new bonds. It is usually positive for the value of the US Dollar.
Why Japan is fighting a billion-dollar battle at the 160 level for the Yen
The USD/JPY exchange rate at 160 represents the most dangerous level in the foreign exchange market, serving as a critical political and economic threshold where Japanese authorities have repeatedly stepped in to halt the currency’s decline. Driven by a massive interest-rate differential known as the carry trade, where investors borrow cheap Japanese Yen (JPY) to invest in higher-yielding assets such as the US Dollar (USD), the pair has surged 60% since the COVID pandemic.
Despite billions of dollars spent by the Bank of Japan (BoJ) and the Ministry of Finance (MoF) through coordinated interventions, the market continues to challenge this line. Understanding the mechanics behind these interventions, why they have previously faded, and how global shifting policies impact the currency is essential for anyone trading the Yen.

What’s behind the Japanese Yen slide?
The Yen is in a multi-year downtrend, driven mainly by the carry trade. This is what happens when a massive interest rate differential allows investors to borrow a currency cheaply (the Yen) to fund investments in higher-yielding foreign assets, such as US Dollar-denominated assets.
Following that carry trade, USD/JPY has risen from just above 100 after COVID to the dreaded 160 barrier. That’s a 60% surge in less than six years, a move that resembles an emerging-market currency rather than that of the world’s fourth-biggest economy.

The Bank of Japan and the Japanese Ministry of Finance have already intervened twice this year, first in late April, then again in early May. Both times, USD/JPY crashed violently. This is a coordinated effort by Japan’s top two financial authorities, on both the fiscal and monetary sides, to stop the Yen’s slide. But despite billions spent defending the currency, the market ignored it and pushed USD/JPY right back to the same level again.
Why the 160.00 threshold is a critical line for Tokyo
The 160.00 level is not just psychological. For Japanese authorities, it represents a political and economic pain threshold that they have imposed upon themselves. A weaker Yen massively increases import costs, energy prices, and inflation pressures on Japanese households.
Historically, whenever USD/JPY accelerates aggressively higher, Japanese officials start becoming very uncomfortable. This has been happening since the Plaza Accord back in 1985, so we’ve got a 40-year-long track record of interventions. That’s exactly what happened earlier this year as USD/JPY surged past 160.00 for two consecutive trading sessions.

Sometimes, you have to draw the line somewhere. Respecting it gives Japanese authorities credibility around their economic agenda. So, the BoJ and MoF fired their Yen-buying bazooka twice, while dumping US Dollars. The moves triggered massive intraday declines, hundreds of pips within hours. Tokyo has now intervened across five confirmed Yen-buying episodes since 2022. According to the BoJ data, the 2026 campaign added roughly ¥10 trillion across two interventions. But despite those interventions, the Yen continues to weaken.
The reason why temporary interventions fade
Intervention can temporarily provide relief for the Yen, but it cannot permanently offset interest rate differentials. That’s the core problem for Japan. The Fed still offers significantly higher yields on US Treasuries than the BoJ does on the JGBs, keeping the carry trade alive. As long as US Treasury yields remain elevated while Japan continues to offer near-zero rates, traders continue buying USD/JPY dips. That’s why the interventions faded. The market viewed them as temporary liquidity events, not a sustained policy shift. Unless the BoJ becomes materially more hawkish, the market may continue to challenge the Japanese currency near 160.00 repeatedly.
How Washington stance shifts the risk calculation
Shifting international dynamics are adding a new layer to this narrative, particularly in light of comments from US Treasury Secretary Scott Bessent. His remarks suggested that the BoJ should play a role in managing foreign exchange stability. Traders immediately noticed the significance because Japan maintains close coordination with the US regarding interventions to stabilize the Yen. If Washington sounds more tolerant or even supportive of Japanese actions, Tokyo may gain more confidence to step in aggressively again. Suddenly, speculators no longer assume Japan is isolated, which dramatically increases intervention risk as USD/JPY approaches 160.00.
What lies ahead for USD/JPY traders
At this point, another round of Yen buying by the MoF and BoJ absolutely remains possible, especially if USD/JPY decisively breaks above 160.00. However, Japan does not want to, nor can it, defend a specific number forever. Authorities mainly want to guard against excessive and disorderly FX moves.
So if USD/JPY keeps grinding slowly higher rather than exploding vertically, Tokyo may tolerate more weakness. The real shift will depend on whether the Bank of Japan meaningfully tweaks its monetary policy, goes hawkish, and abandons sub-1% interest rates. That could turn things around decisively and offer plenty of JPY bullish trades.
If you are trading USD/JPY or any Yen pairs, the upcoming Bank of Japan interest rate decisions are the critical events to watch. The 160.00 level is no longer just a chart technical level: it’s the line that points to a direct battle between global carry traders and intervention risk. The pace of the rally matters just as much as the level itself, and the market is about to find out Japan’s tolerance for this threshold once again.
(This article was created with the help of an Artificial Intelligence tool and reviewed by an editor.)
AUD/USD Price Forecast: Holds above 0.7150; remains confined in two-week-old range
The AUD/USD pair struggles to capitalize on the previous day’s goodish rebound from sub-0.7100 levels, or a one-week low, and oscillates in a range during the Asian session on Friday. Spot prices, however, hold above 0.7150 and seem poised to register modest gains for the first time in three weeks.
Reports that the US and Iran have reached a draft agreement to extend the ongoing ceasefire for 60 days underpin the US Dollar (USD) safe-haven status, which, in turn, is seen acting as a tailwind for the AUD/USD pair. Investors, however, remain skeptical about a potential US-Iran peace deal amid major disagreements over Tehran’s nuclear program and the Strait of Hormuz.
Apart from this, a rise in US inflation at the fastest pace in three years in April reaffirmed expectations that the US Federal Reserve (Fed) will raise borrowing costs by the end of this year and acts as a tailwind for the USD. Furthermore, reduced bets for an interest rate hike by the Reserve Bank of Australia (RBA) in June contribute to capping the upside for the AUD/USD pair.
From a technical perspective, spot prices remain confined in a familiar band held over the past two weeks or so. The top end of the trading range coincides with the 100-period Simple Moving Average (SMA) on the 4-hour chart and the 23.6% Fibonacci retracement level of the AUD/USD pair’s March-May upswing. This points to a mildly capped bias despite constructive momentum.
Meanwhile, the Relative Strength Index is near 56, and a marginally positive Moving Average Convergence Divergence (MACD) reading hints that sellers are not in full control. That said, a move beyond the aforementioned confluence hurdle, near the 0.7180-0.7185 area, is needed to confirm that the recent corrective slide from a multi-year top has run its course and positioning for further gains.
A clear break above this cluster would open the way toward the 0.7279 swing high. On the downside, first support emerges at the 38.2% Fibonacci level near 0.7109, ahead of the 50.0% retracement at 0.7056, with deeper pullbacks exposing 0.7003 and then 0.6928 before the broader base at 0.6833.
(The technical analysis of this story was written with the help of an AI tool.)
AUD/USD 4-hour chart
Australian Dollar FAQs
One of the most significant factors for the Australian Dollar (AUD) is the level of interest rates set by the Reserve Bank of Australia (RBA). Because Australia is a resource-rich country another key driver is the price of its biggest export, Iron Ore. The health of the Chinese economy, its largest trading partner, is a factor, as well as inflation in Australia, its growth rate and Trade Balance. Market sentiment – whether investors are taking on more risky assets (risk-on) or seeking safe-havens (risk-off) – is also a factor, with risk-on positive for AUD.
The Reserve Bank of Australia (RBA) influences the Australian Dollar (AUD) by setting the level of interest rates that Australian banks can lend to each other. This influences the level of interest rates in the economy as a whole. The main goal of the RBA is to maintain a stable inflation rate of 2-3% by adjusting interest rates up or down. Relatively high interest rates compared to other major central banks support the AUD, and the opposite for relatively low. The RBA can also use quantitative easing and tightening to influence credit conditions, with the former AUD-negative and the latter AUD-positive.
China is Australia’s largest trading partner so the health of the Chinese economy is a major influence on the value of the Australian Dollar (AUD). When the Chinese economy is doing well it purchases more raw materials, goods and services from Australia, lifting demand for the AUD, and pushing up its value. The opposite is the case when the Chinese economy is not growing as fast as expected. Positive or negative surprises in Chinese growth data, therefore, often have a direct impact on the Australian Dollar and its pairs.
Iron Ore is Australia’s largest export, accounting for $118 billion a year according to data from 2021, with China as its primary destination. The price of Iron Ore, therefore, can be a driver of the Australian Dollar. Generally, if the price of Iron Ore rises, AUD also goes up, as aggregate demand for the currency increases. The opposite is the case if the price of Iron Ore falls. Higher Iron Ore prices also tend to result in a greater likelihood of a positive Trade Balance for Australia, which is also positive of the AUD.
The Trade Balance, which is the difference between what a country earns from its exports versus what it pays for its imports, is another factor that can influence the value of the Australian Dollar. If Australia produces highly sought after exports, then its currency will gain in value purely from the surplus demand created from foreign buyers seeking to purchase its exports versus what it spends to purchase imports. Therefore, a positive net Trade Balance strengthens the AUD, with the opposite effect if the Trade Balance is negative.
NZD/USD Price Forecast: Breaks range, bulls target 0.5950 as RSI turns
The New Zealand Dollar advances some 0.48% on Thursday after bottoming near the 200-day Simple Moving Average (SMA) at 0.5836. Over the last two trading days, it cleared the 0.5900 milestone, supported by a hawkish hold by the Reserve Bank of New Zealand (RBNZ).
NZD/USD Price Forecast: Technical outlook
Price action shows the NZD/USD exited a rotation area, capped on the upside by the 100-day SMA at 0.5893, which has so far been cleared by buyers, who are eyeing further upside.
The Relative Strength Index (RSI) shows that buyers are gaining momentum after clearing the 50-neutral level a day ago, on the RBNZ’s decision.
If NZD/USD clears the 0.5950 psychological level, it opens the door to test 0.6000 ahead of the February 26 swing high of 0.6014. If hurdled, the next stop would be the yearly high at 0.6094.
On the downside, sellers must push the NZD/USD below the 100-day SMA, so that they can test the 50-day SMA at 0.5856. Below this level sits the 200-day SMA at 0.5836, followed by the 0.5800 mark.
NZD/USD Price Chart – Daily

New Zealand Dollar Price Today
The table below shows the percentage change of New Zealand Dollar (NZD) against listed major currencies today. New Zealand Dollar was the strongest against the US Dollar.
| USD | EUR | GBP | JPY | CAD | AUD | NZD | CHF | |
|---|---|---|---|---|---|---|---|---|
| USD | -0.18% | -0.09% | -0.16% | -0.41% | -0.29% | -0.50% | -0.41% | |
| EUR | 0.18% | 0.09% | 0.00% | -0.24% | -0.11% | -0.29% | -0.22% | |
| GBP | 0.09% | -0.09% | -0.09% | -0.31% | -0.19% | -0.39% | -0.32% | |
| JPY | 0.16% | 0.00% | 0.09% | -0.26% | -0.13% | -0.34% | -0.24% | |
| CAD | 0.41% | 0.24% | 0.31% | 0.26% | 0.13% | -0.08% | 0.00% | |
| AUD | 0.29% | 0.11% | 0.19% | 0.13% | -0.13% | -0.18% | -0.13% | |
| NZD | 0.50% | 0.29% | 0.39% | 0.34% | 0.08% | 0.18% | 0.07% | |
| CHF | 0.41% | 0.22% | 0.32% | 0.24% | 0.00% | 0.13% | -0.07% |
The heat map shows percentage changes of major currencies against each other. The base currency is picked from the left column, while the quote currency is picked from the top row. For example, if you pick the New Zealand Dollar from the left column and move along the horizontal line to the US Dollar, the percentage change displayed in the box will represent NZD (base)/USD (quote).
WTI reverses gains as hopes for US-Iran agreement improve sentiment

West Texas Intermediate (WTI) crude Oil sees sharp two-way price swings on Thursday as traders track rapidly changing US-Iran developments. At the time of writing, WTI is trading little changed around $88 per barrel after hitting an intraday high of $91.27.
Earlier in the day, crude prices jumped after reports of fresh attacks in the Middle East, with US armed forces targeting Iranian military sites and Iran claiming it had targeted a US airbase in the Gulf region. However, gains quickly reversed after an Axios report said the US and Iran had reached a preliminary agreement, sending WTI down to an intraday low near $86.28.
According to the report, the two sides agreed on a 60-day memorandum of understanding (MOU) to extend the current truce, though the deal still awaits final approval from US President Donald Trump.
The latest developments raised hopes that both sides may be moving closer toward a deal. Still, Oil prices did not fall much as traders waited for more details and confirmation of a final agreement, keeping WTI trading near the lower end of its recent war-driven range.
Major differences also remain unresolved, including Iran’s nuclear program and control over the vital Strait of Hormuz. On Wednesday, the US Treasury announced new Iran-related sanctions on the newly formed Persian Gulf Strait Authority.
US Treasury Secretary Scott Bessent said on Thursday the US “won’t tolerate a tolling system in Hormuz” and warned that “any willing partners in tolling in the Strait of Hormuz will be penalized.”
WTI Oil FAQs
WTI Oil is a type of Crude Oil sold on international markets. The WTI stands for West Texas Intermediate, one of three major types including Brent and Dubai Crude. WTI is also referred to as “light” and “sweet” because of its relatively low gravity and sulfur content respectively. It is considered a high quality Oil that is easily refined. It is sourced in the United States and distributed via the Cushing hub, which is considered “The Pipeline Crossroads of the World”. It is a benchmark for the Oil market and WTI price is frequently quoted in the media.
Like all assets, supply and demand are the key drivers of WTI Oil price. As such, global growth can be a driver of increased demand and vice versa for weak global growth. Political instability, wars, and sanctions can disrupt supply and impact prices. The decisions of OPEC, a group of major Oil-producing countries, is another key driver of price. The value of the US Dollar influences the price of WTI Crude Oil, since Oil is predominantly traded in US Dollars, thus a weaker US Dollar can make Oil more affordable and vice versa.
The weekly Oil inventory reports published by the American Petroleum Institute (API) and the Energy Information Agency (EIA) impact the price of WTI Oil. Changes in inventories reflect fluctuating supply and demand. If the data shows a drop in inventories it can indicate increased demand, pushing up Oil price. Higher inventories can reflect increased supply, pushing down prices. API’s report is published every Tuesday and EIA’s the day after. Their results are usually similar, falling within 1% of each other 75% of the time. The EIA data is considered more reliable, since it is a government agency.
OPEC (Organization of the Petroleum Exporting Countries) is a group of 12 Oil-producing nations who collectively decide production quotas for member countries at twice-yearly meetings. Their decisions often impact WTI Oil prices. When OPEC decides to lower quotas, it can tighten supply, pushing up Oil prices. When OPEC increases production, it has the opposite effect. OPEC+ refers to an expanded group that includes ten extra non-OPEC members, the most notable of which is Russia.
United States Core Personal Consumption Expenditures (QoQ) came in at 4.4%, above forecasts (4.3%) in 1Q
Information on these pages contains forward-looking statements that involve risks and uncertainties. Markets and instruments profiled on this page are for informational purposes only and should not in any way come across as a recommendation to buy or sell in these assets. You should do your own thorough research before making any investment decisions. FXStreet does not in any way guarantee that this information is free from mistakes, errors, or material misstatements. It also does not guarantee that this information is of a timely nature. Investing in Open Markets involves a great deal of risk, including the loss of all or a portion of your investment, as well as emotional distress. All risks, losses and costs associated with investing, including total loss of principal, are your responsibility. The views and opinions expressed in this article are those of the authors and do not necessarily reflect the official policy or position of FXStreet nor its advertisers. The author will not be held responsible for information that is found at the end of links posted on this page.
If not otherwise explicitly mentioned in the body of the article, at the time of writing, the author has no position in any stock mentioned in this article and no business relationship with any company mentioned. The author has not received compensation for writing this article, other than from FXStreet.
FXStreet and the author do not provide personalized recommendations. The author makes no representations as to the accuracy, completeness, or suitability of this information. FXStreet and the author will not be liable for any errors, omissions or any losses, injuries or damages arising from this information and its display or use. Errors and omissions excepted.
The author and FXStreet are not registered investment advisors and nothing in this article is intended to be investment advice.
US core PCE inflation set to edge up in April as markets price in Fed rate hike by year-end
The United States (US) Bureau of Economic Analysis (BEA) will publish the Personal Consumption Expenditures (PCE) Price Index data for April on Thursday at 12:30 GMT.
The PCE Price Index is closely watched by market participants because it is the Federal Reserve’s (Fed) preferred measure of inflation and could influence the policy outlook.
Anticipating the PCE: Insights into the Federal Reserve’s key inflation metric
The core PCE Price Index, which excludes volatile food and energy prices, is expected to advance 0.3% month-over-month (MoM) in April, matching March’s increase.
In 12 months to April, the core PCE inflation is set to edge higher to 3.3%. Meanwhile, the headline annual PCE inflation is forecast to reach its highest level since May 2023 at 3.8%.
Markets will scrutinize the PCE Price Index data as Fed officials take this inflation gauge into account when deciding on the next policy move. Given the uncertainty created by the ongoing Middle East conflict, investors will assess the details of the PCE inflation report to see whether the US central bank is likely to opt for an interest rate hike before the end of the year.
According to the CME FedWatch Tool, markets are currently pricing in about a 50% probability that the Fed will raise the policy rate by at least 25 basis points by end-2026.

In an interview with Reuters on Wednesday, Minneapolis Fed President Neel Kashkari, who dissented at the April policy meeting and voted against the inclusion of the easing bias in the policy statement, noted that data released since the last meeting have shown that inflationary risks are higher. In the meantime, Fed Governor Christopher Waller, known for his dovish outlook, shifted his tone last week and said that he should remove the easing bias from the statement. Waller further added that he would not hesitate to support an increase in the policy rate if inflation expectations were to become unanchored.
Previewing the PCE inflation report, TD Securities said:
“We expect core and headline PCE prices moderated in April to 0.26% and 0.43% m/m, respectively. Tariff passthrough was moderate in the month, and a slowdown in supercore services offset strength in shelter. Our forecast translates to 3.3% and 3.8% y/y for core and headline, respectively. We also look for nominal and real personal spending to slow down in the month.”
How will the Personal Consumption Expenditures Price Index affect EUR/USD?
The US Dollar (USD) stays resilient against its rivals this week. Still, it struggles to gather strength as investors refrain from taking large positions due to the uncertainty surrounding the conflict between the United States (US) and Iran.
Earlier in the week, the US carried out what it called “self-defense strikes” on Iranian missile sites and mine-laying vessels. In turn, Iran’s Islamic Revolutionary Guard Corps (IRGC) threatened to retaliate, calling the US’s action a violation of the ceasefire. Nevertheless, the truce officially remains in place, while the sides are reportedly working toward finalizing a Memorandum of Understanding (MOU), specifically trying to resolve disputes over language regarding Iran’s nuclear program and sanctions relief.
If the US and Iran reach an agreement to fully open the Strait of Hormuz, crude Oil prices could decline sharply and ease fears over global inflation running out of control. In this scenario, the USD could remain under bearish pressure and help EUR/USD turn north even if the PCE inflation data come in above analysts’ estimates.
In case the US-Iran issue remains unresolved by the time the inflation data is released, it could have a noticeable effect on the USD’s valuation. A stronger-than-forecast print in the monthly core PCE Price Index could boost the USD with the immediate reaction and hurt EUR/USD, as it would suggest that rising energy costs are lifting price pressures in the wider economy. Conversely, a soft print in this data could make it difficult for the USD to gather strength and allow EUR/USD to hold its ground.
Eren Sengezer, European Session Lead Analyst at FXStreet, shares a brief technical outlook for EUR/USD:
“The near-term technical outlook for EUR/USD points to a bearish bias but doesn’t show a buildup in momentum. The pair remains in the lower half of the Bollinger Bands on the daily chart and trades below the 20-day, 50-day, 100-day and the 200-day Simple Moving Averages (SMA).”
“On the downside, 1.1560, where the Fibonacci 23.6% retracement level of the late-January to mid-March downtrend meets the lower limit of the Bollinger Bands, aligns as key technical support. A daily close below this level could attract technical sellers and open the door to an extended decline toward 1.1400 (static level).”
“Looking north, a strong resistance area seems to have formed at the 1.1670-1.1700 region (20-day SMA, 100-day SMA, 200-day SMA) ahead of 1.1800 (Fibonacci 61.8% retracement, upper limit of the Bollinger Bands).

US Dollar FAQs
The US Dollar (USD) is the official currency of the United States of America, and the ‘de facto’ currency of a significant number of other countries where it is found in circulation alongside local notes. It is the most heavily traded currency in the world, accounting for over 88% of all global foreign exchange turnover, or an average of $6.6 trillion in transactions per day, according to data from 2022.
Following the second world war, the USD took over from the British Pound as the world’s reserve currency. For most of its history, the US Dollar was backed by Gold, until the Bretton Woods Agreement in 1971 when the Gold Standard went away.
The most important single factor impacting on the value of the US Dollar is monetary policy, which is shaped by the Federal Reserve (Fed). The Fed has two mandates: to achieve price stability (control inflation) and foster full employment. Its primary tool to achieve these two goals is by adjusting interest rates.
When prices are rising too quickly and inflation is above the Fed’s 2% target, the Fed will raise rates, which helps the USD value. When inflation falls below 2% or the Unemployment Rate is too high, the Fed may lower interest rates, which weighs on the Greenback.
In extreme situations, the Federal Reserve can also print more Dollars and enact quantitative easing (QE). QE is the process by which the Fed substantially increases the flow of credit in a stuck financial system.
It is a non-standard policy measure used when credit has dried up because banks will not lend to each other (out of the fear of counterparty default). It is a last resort when simply lowering interest rates is unlikely to achieve the necessary result. It was the Fed’s weapon of choice to combat the credit crunch that occurred during the Great Financial Crisis in 2008. It involves the Fed printing more Dollars and using them to buy US government bonds predominantly from financial institutions. QE usually leads to a weaker US Dollar.
Quantitative tightening (QT) is the reverse process whereby the Federal Reserve stops buying bonds from financial institutions and does not reinvest the principal from the bonds it holds maturing in new purchases. It is usually positive for the US Dollar.