The Japanese Yen bounced up from five-week lows against the US Dollar, turning positive on the daily chart, as Japan’s Prime Minister Sanae Takaichi warned that Tokyo is ready to take action against Yen weakness. The USD/JPY pair has pulled back from the 160.00 level, considered a line in the sand for Japanese authorities, to hit session lows at 159.55.
Australian Dollar: RBA seen hiking again as growth slows – TD Securities

TD Securities strategists Prashant Newnaha and Alex Loo note that Australian Q1 Gross Domestic Product (GDP) matched the Reserve Bank of Australia’s (RBA) 0.3% q/q implied forecast, but highlight that household and government spending are weak while data centre investment props up activity. They stress that the economy is still growing above its speed limit and expect one final 25 bps RBA hike in August.
RBA path shaped by weak demand
“Q1 GDP landed bang in line with the Bank’s implied 0.3% q/q forecast. However, a breakdown of the data reveals that outside of data center investment, household and government spending is weak.”
“Of the 0.95% pts increase in private demand, 0.69% pts came from Private Investment – thanks to the data center build-out. The contribution from private investment to GDP was the largest since Q1’21.”
“An important detail worthy of note is the drop in Government consumption was influenced by the end of the Government electricity rebate. We estimate this to have sliced 0.3% pts off Government consumption and mechanically, this would have boosted quarterly private consumption by the same magnitude. Excluding the electricity rebate, the private consumption contribution to GDP would have been flat!”
“Of more concern for the RBA is the breakdown – household spending is weak with economic activity essentially being held up by the data center build out. It doesn’t help productivity is weak, -0.6% q/q in Q1.”
“Looking ahead, economic conditions are less than ideal – S&P Global’s Composite PMI for May points to downside risks for Q2 GDP growth but upside risks to the Bank’s 1% q/q trimmed mean CPI forecast for Q2.”
(This article was created with the help of an Artificial Intelligence tool and reviewed by an editor.)
Top 3 Price Prediction: Bitcoin, Ethereum, Ripple – BTC eyes $65,000, ETH risks $1,800, XRP holds at $1.20
Bitcoin (BTC), Ethereum (ETH), and Ripple (XRP) are catching a breath during early Asian trading hours on Wednesday after losing over 6% the previous day. The path of least resistance in Bitcoin and Ethereum points to further correction likely toward the $65,000 and $1,675, while XRP risks losing the $1.20 psychological support level.
Bitcoin eyes $65,000 amid a falling knife maneuver
Bitcoin trades at around $66,500, extending a bearish phase as it remains well below the reclaimed Exponential Moving Averages (EMAs) and the previously rising support trend line, which now acts as resistance. BTC sits below the 50-day EMA around $75,302, the 100-day EMA near $76,238, and the 200-day EMA near $82,128, underscoring a downward bias despite an already stretched decline.
Momentum remains weak on the daily chart, with the Relative Strength Index (RSI) hovering in oversold territory near 21 and the Moving Average Convergence Divergence (MACD) deep in negative territory, with its signal line, while negative histogram bars expand, which together suggest persistent downside pressure.
On the downside, Bitcoin could target the lows of March 29 and February 6 at $65,000 and $60,000, respectively, where buyers may attempt to regain control of the trend.
On the topside, initial resistance is seen at the former upward-sloping trend-line break level around $71,478, which now caps recovery attempts. A sustained move above that area would next target the 50-day EMA near $75,302 and the 100-day EMA near $76,238, while the 200-day EMA at $82,128 serves as a broader bearish pivot higher up.
Ethereum risks losing $1,800 as selling pressure mounts
Ethereum maintains a bearish bias after a 7% drop on Tuesday, with price hovering above the $1,835 near-term support level, marked by the February 28 low. A decisive close below this level extends the fast-paced correction in Ethereum toward the February 6 low at $1,747.
Momentum oscillators reinforce the weak tone, with the RSI hovering near oversold territory at around 22 and the MACD remaining in negative territory, suggesting persistent downside pressure despite intermittent corrective bounces.
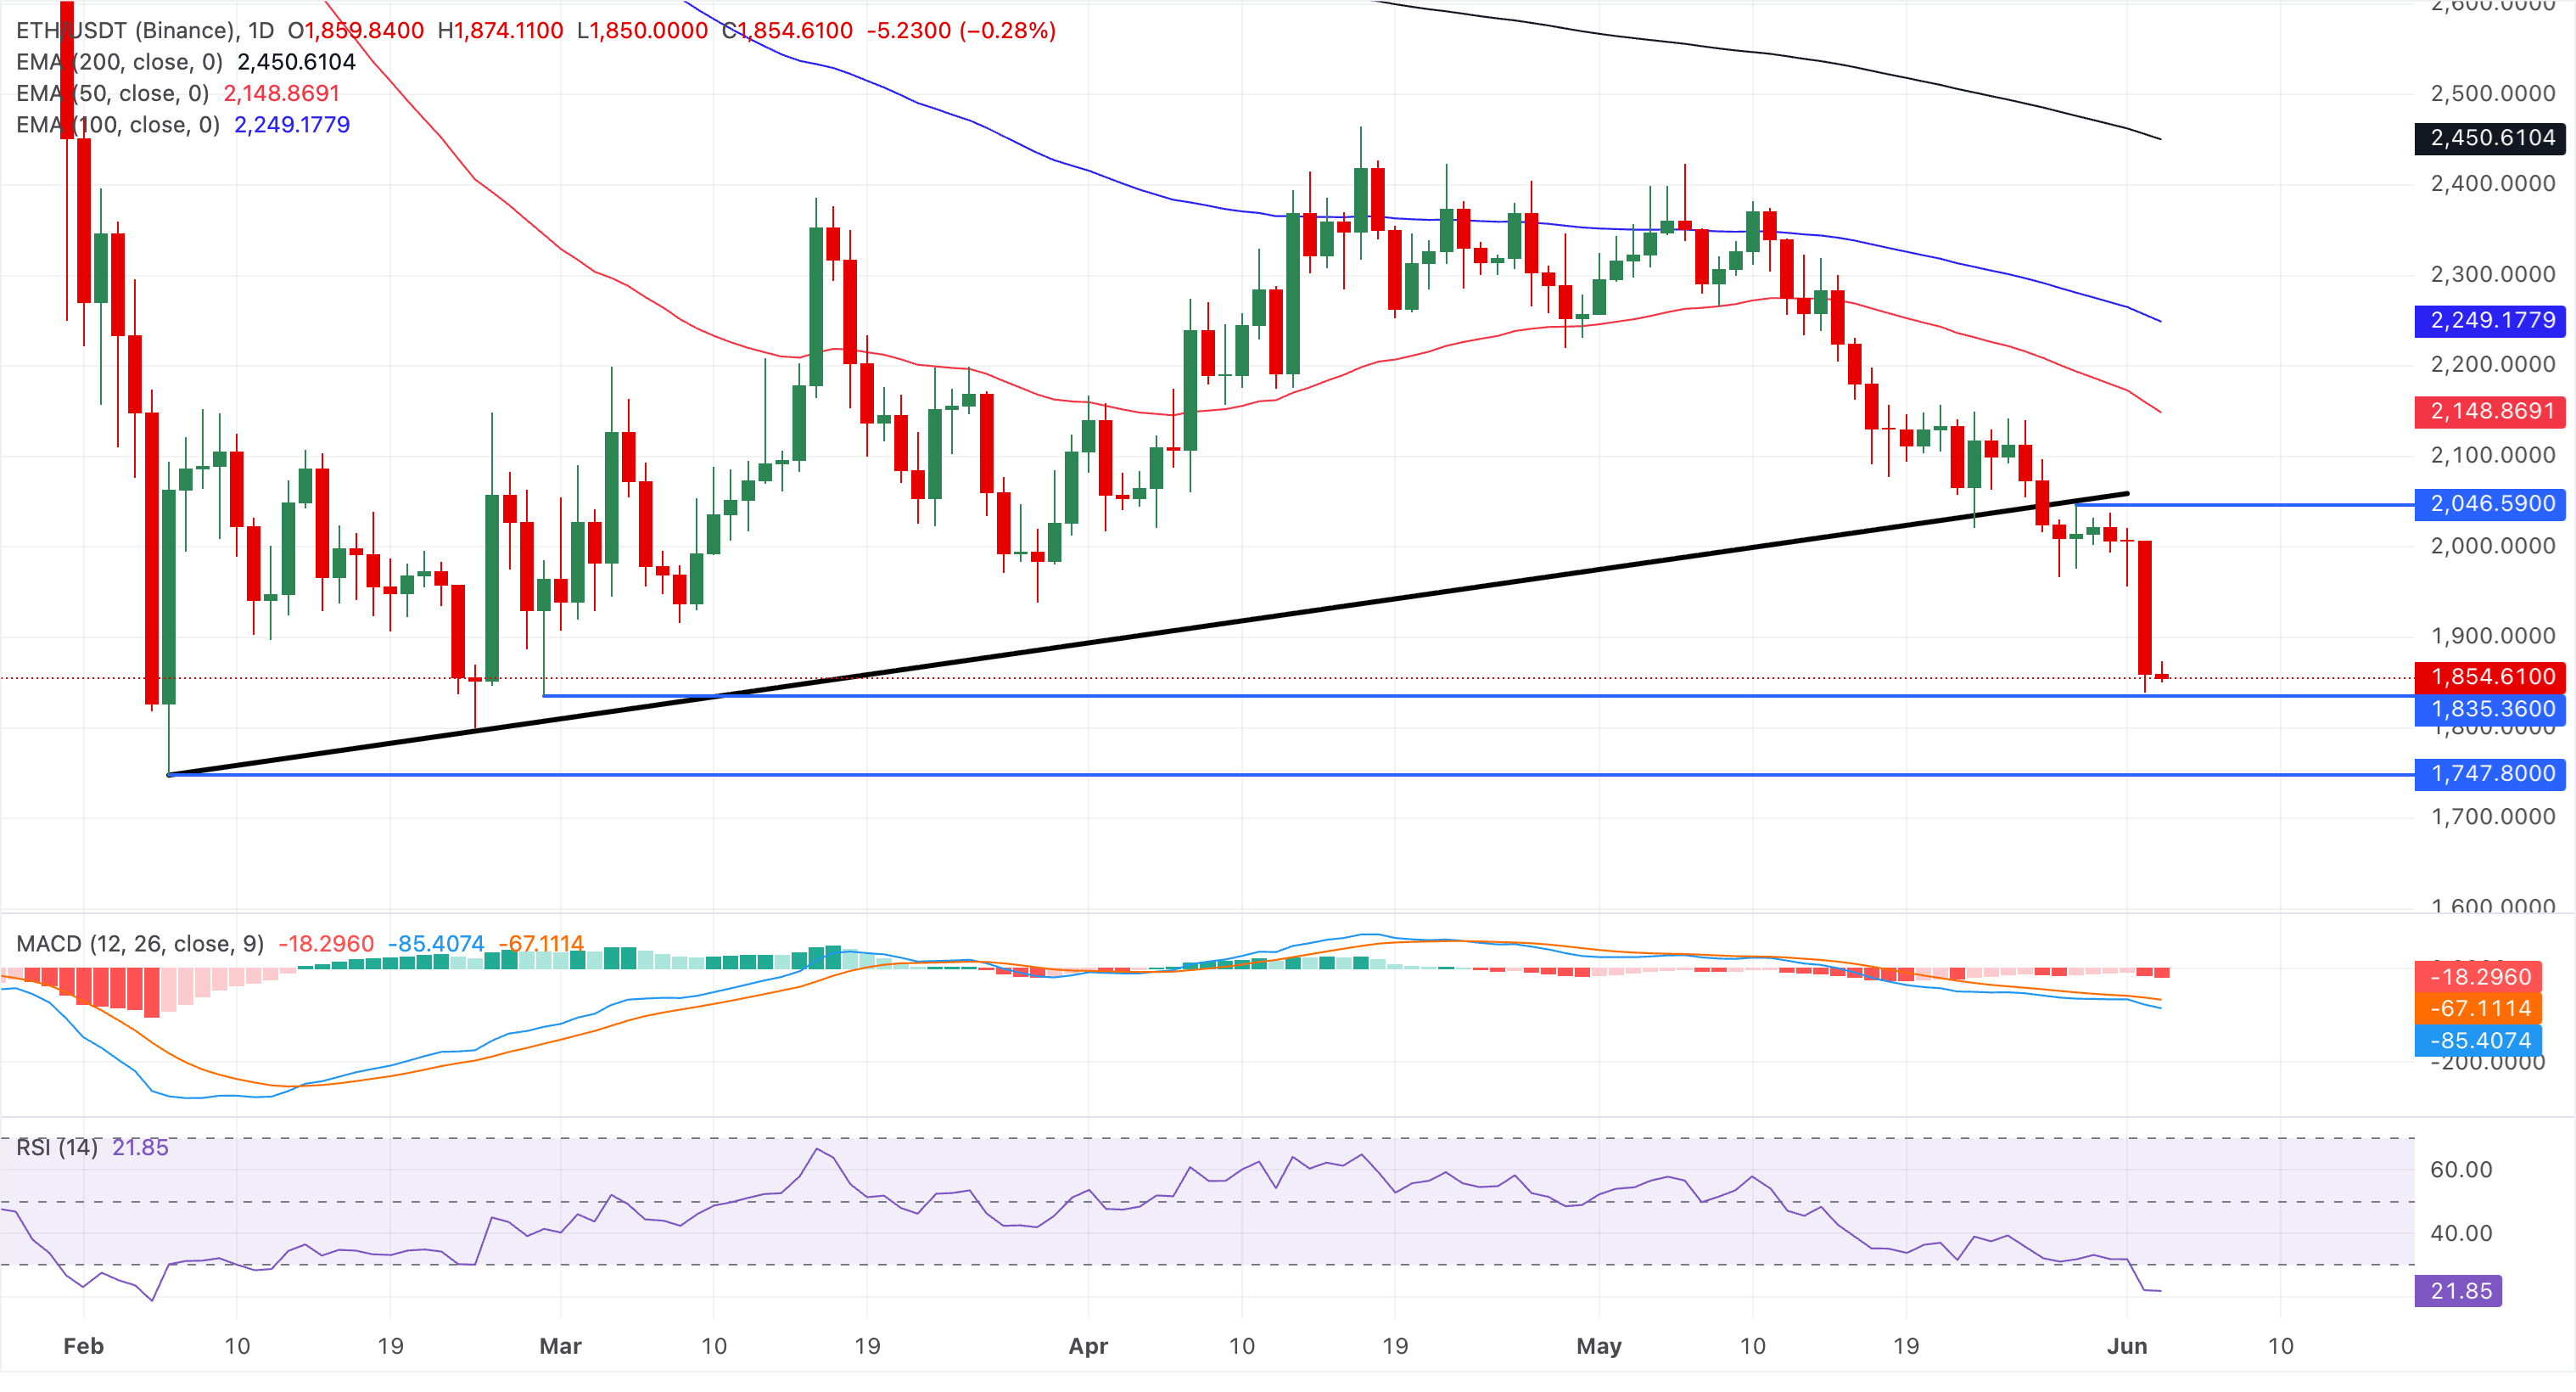
On the topside, initial resistance emerges at the broken ascending trend-line area around $2,065, which now acts as the first hurdle for any recovery attempt. A sustained break above that zone would expose the 50-day EMA at roughly $2,148, the 100-day EMA near $2,249, and the 200-day EMA around $2,450, which now sit overhead as a stacked resistance band, underscoring a structurally capped market.
XRP price decline targets February low
Ripple is trading above $1.2200 at press time on Wednesday, but remains broadly bearish after the 6% drop the previous day. Similar to Bitcoin and Ethereum, XRP trades well below the 50-, 100-, and 200-day EMAs at roughly $1.3695, $1.4447, and $1.6431, respectively.
The RSI hovers just below the 30 mark, hinting at oversold conditions but not yet signaling a decisive rebound, while the MACD line remains in a clear downtrend below its signal line in the negative territory, reinforcing persistent downside momentum despite the stretched decline.
Immediate support for XRP below the $1.20 round figure lies at the February 6 low of $1.1179.
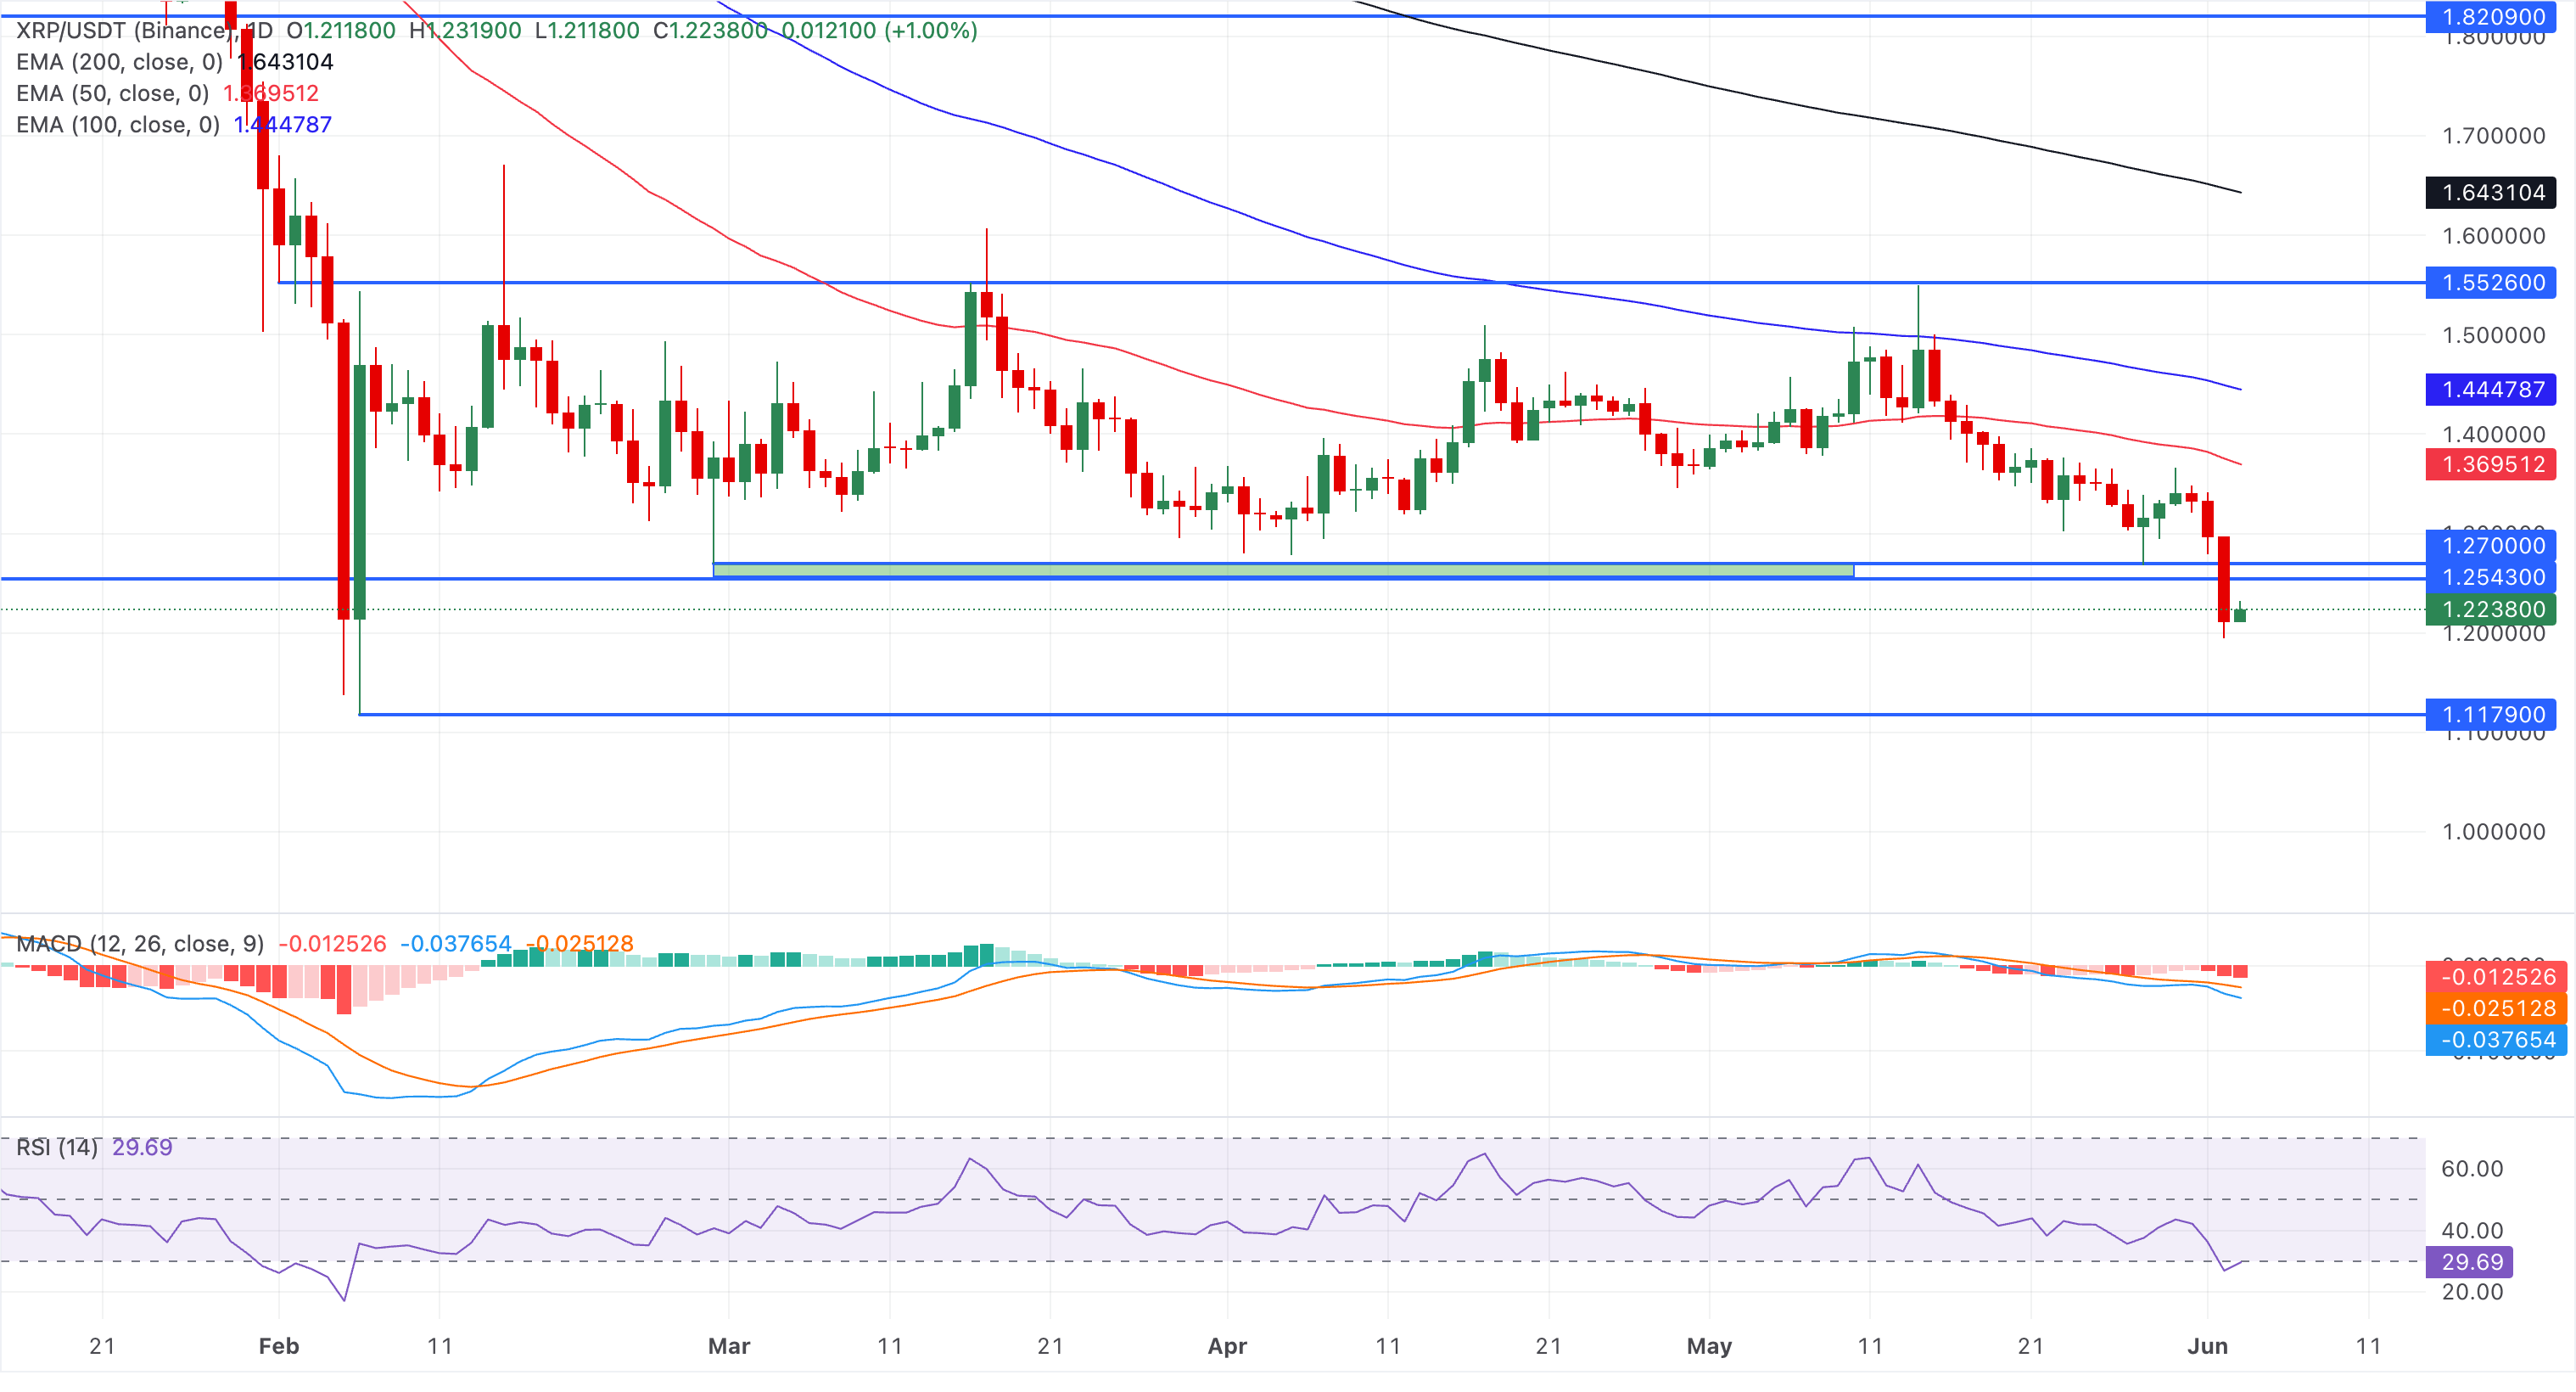
On the topside, initial resistance is seen at the 50-day EMA near 1.37, with further barriers at the 100-day EMA around 1.44 and the 200-day EMA near 1.64, levels that would need to be reclaimed to ease prevailing bearish pressure.
(The technical analysis of this story was written with the help of an AI tool.)
Bitcoin, altcoins, stablecoins FAQs
Bitcoin is the largest cryptocurrency by market capitalization, a virtual currency designed to serve as money. This form of payment cannot be controlled by any one person, group, or entity, which eliminates the need for third-party participation during financial transactions.
Altcoins are any cryptocurrency apart from Bitcoin, but some also regard Ethereum as a non-altcoin because it is from these two cryptocurrencies that forking happens. If this is true, then Litecoin is the first altcoin, forked from the Bitcoin protocol and, therefore, an “improved” version of it.
Stablecoins are cryptocurrencies designed to have a stable price, with their value backed by a reserve of the asset it represents. To achieve this, the value of any one stablecoin is pegged to a commodity or financial instrument, such as the US Dollar (USD), with its supply regulated by an algorithm or demand. The main goal of stablecoins is to provide an on/off-ramp for investors willing to trade and invest in cryptocurrencies. Stablecoins also allow investors to store value since cryptocurrencies, in general, are subject to volatility.
Bitcoin dominance is the ratio of Bitcoin’s market capitalization to the total market capitalization of all cryptocurrencies combined. It provides a clear picture of Bitcoin’s interest among investors. A high BTC dominance typically happens before and during a bull run, in which investors resort to investing in relatively stable and high market capitalization cryptocurrency like Bitcoin. A drop in BTC dominance usually means that investors are moving their capital and/or profits to altcoins in a quest for higher returns, which usually triggers an explosion of altcoin rallies.
Australia S&P Global Services PMI came in at 48.7, above forecasts (47.7) in May
Gold is down on Tuesday, trading around $4,490 after peaking at $4,541 earlier in the day. The US Dollar seesawed between limited gains and losses throughout the day, as market players are in wait-and-see mode ahead of first-tier data releases and clearer clues on whether the United States and Iran will finally clinch a deal.
US President Trump signs order to gain early access to powerful AI models

US President Donald Trump signed an executive order on Tuesday aimed at giving the government early access to powerful new artificial intelligence (AI) models. Under the proposal, AI developers would voluntarily submit new models for government cybersecurity testing before their public release.
The executive order requires key federal agencies, including the Treasury, Defense, Commerce, and Homeland Security departments, to secure agreements with AI developers to test advanced models. The order grants agencies up to 30 days to review the models before their release to the public. The directive also instructs agencies to prioritize strengthening federal cyber defense.
According to Politico, Trump had been scheduled to sign the 90-day version of the order on May 21, but he abruptly rejected that draft just hours before the Oval Office ceremony, saying he feared it would “get in the way” of US competition with China for AI supremacy.
US Dollar Price Today
The table below shows the percentage change of US Dollar (USD) against listed major currencies today. US Dollar was the strongest against the Japanese Yen.
| USD | EUR | GBP | JPY | CAD | AUD | NZD | CHF | |
|---|---|---|---|---|---|---|---|---|
| USD | 0.05% | -0.08% | 0.18% | -0.04% | -0.27% | 0.15% | 0.13% | |
| EUR | -0.05% | -0.11% | 0.11% | -0.10% | -0.31% | 0.10% | 0.07% | |
| GBP | 0.08% | 0.11% | 0.22% | 0.01% | -0.16% | 0.23% | 0.16% | |
| JPY | -0.18% | -0.11% | -0.22% | -0.21% | -0.42% | -0.01% | -0.06% | |
| CAD | 0.04% | 0.10% | -0.01% | 0.21% | -0.22% | 0.20% | 0.14% | |
| AUD | 0.27% | 0.31% | 0.16% | 0.42% | 0.22% | 0.40% | 0.34% | |
| NZD | -0.15% | -0.10% | -0.23% | 0.01% | -0.20% | -0.40% | -0.06% | |
| CHF | -0.13% | -0.07% | -0.16% | 0.06% | -0.14% | -0.34% | 0.06% |
The heat map shows percentage changes of major currencies against each other. The base currency is picked from the left column, while the quote currency is picked from the top row. For example, if you pick the US Dollar from the left column and move along the horizontal line to the Japanese Yen, the percentage change displayed in the box will represent USD (base)/JPY (quote).
United States JOLTS Job Openings registered at 7.618M above expectations (6.88M) in April
Statistics Canada handed the headline writers a gift and the analysts a headache. Real GDP shrank 0.1% on an annualized basis in the first quarter, and with the fourth quarter of 2025 revised down to a 1.0% contraction, that is two negative quarters in a row, the textbook definition of a technical recession and Canada’s first since the pandemic.
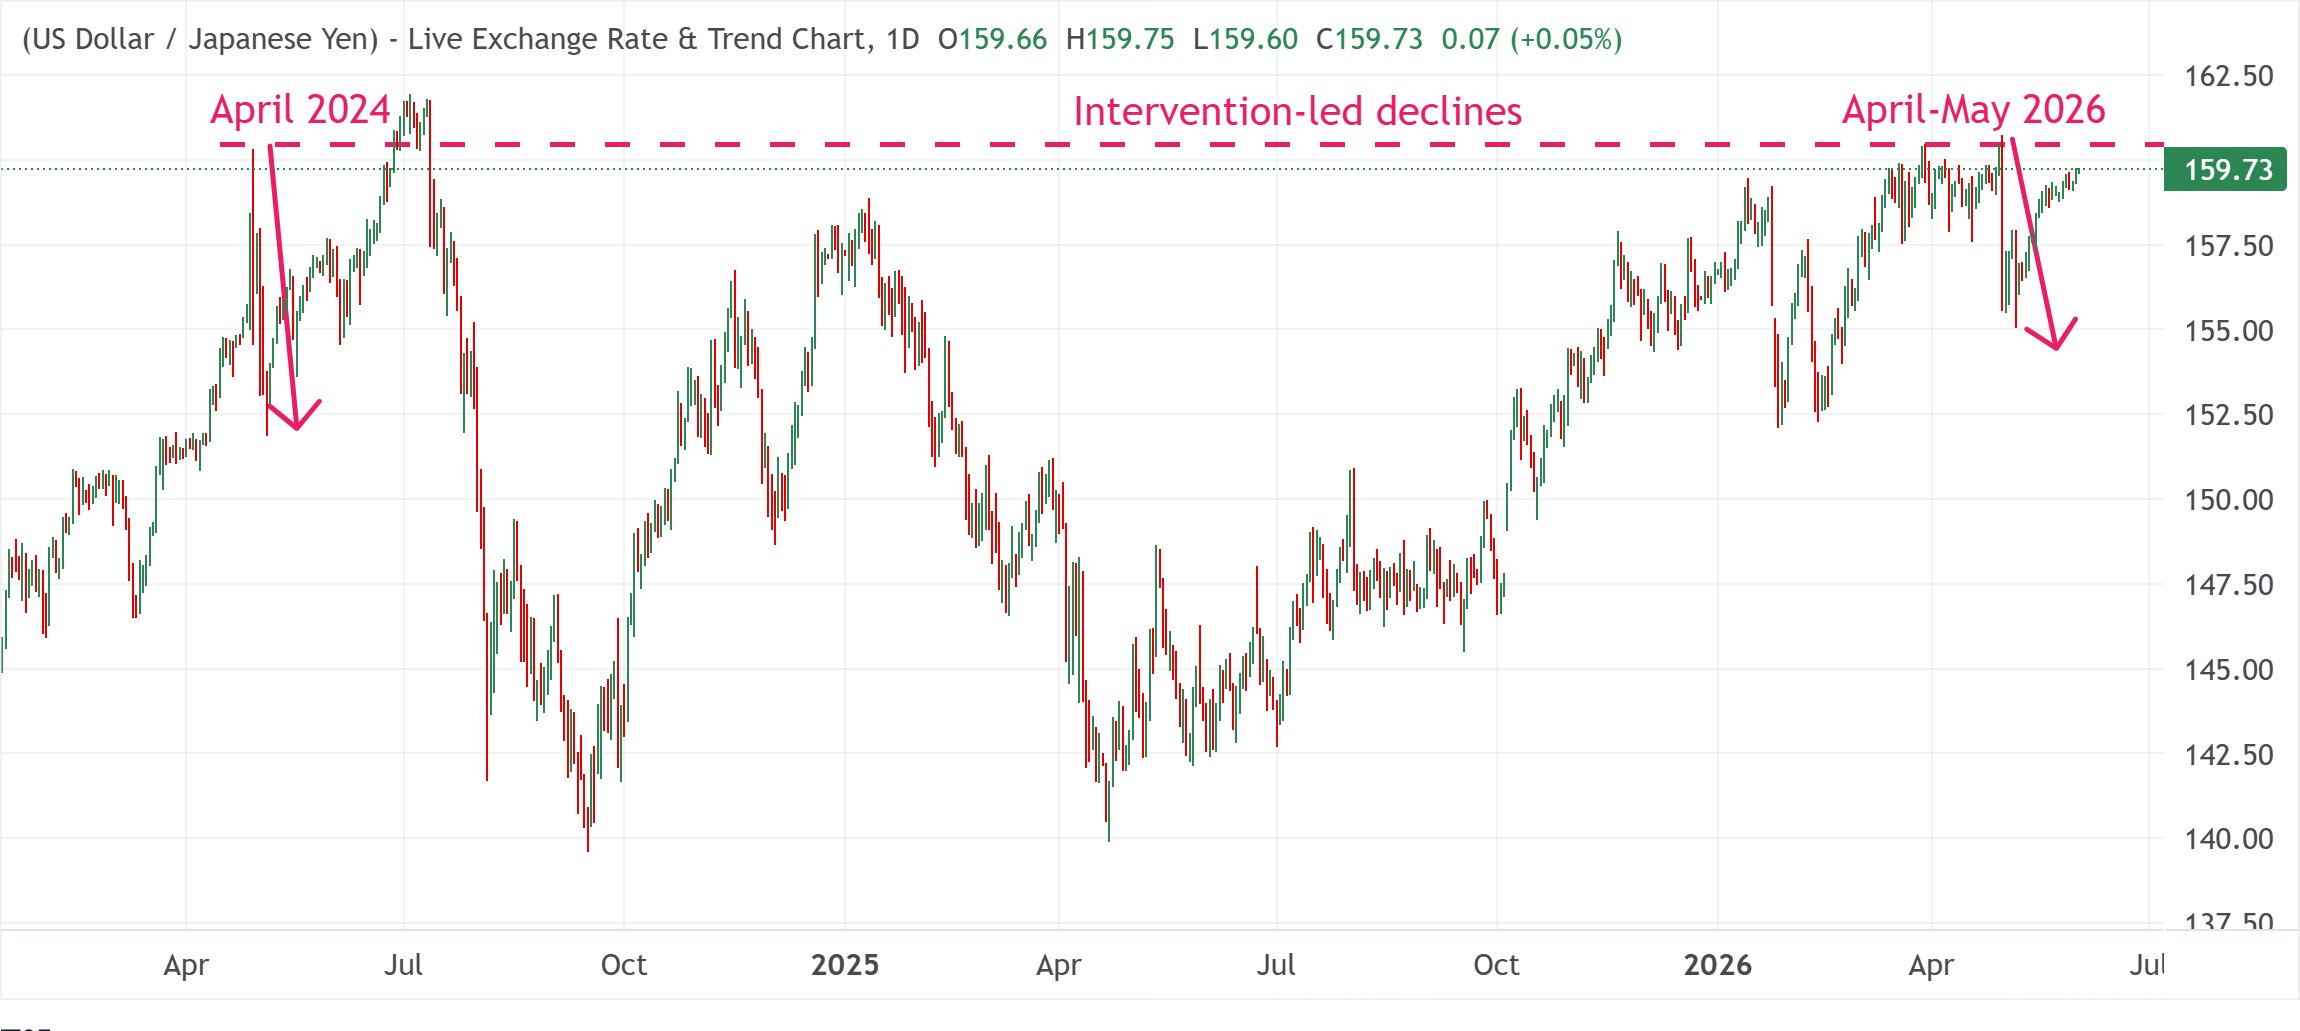
160 is back: Japan faces another Yen intervention dilemma
Welcome to Japan’s Groundhog Day: the Japanese Yen continues to severely underperform against major global currencies and remains close (again) to the 160.00 threshold against the US Dollar. Support from the Bank of Japan in the form of an interest rate hike on June 16 would certainly ease the pain, but it is unclear whether Japanese authorities can wait until then.
Recent interventions have provided short-term respite but failed to turn the tide, as they don’t address the root cause of the Yen’s weakness. Moreover, geopolitics and central bank policy factors put the Yen in danger of weakening further. Will Japan fire its Yen bazooka again?
The pressure on the JPY intensifies
The JPY has come under fierce selling pressure in the wake of economic concerns stemming from the Iran war. Japan imports over 90% of its crude Oil from the Middle East, leaving it highly vulnerable to supply chain disruptions caused by the closure of the Strait of Hormuz.
In fact, Japan relies on the strategic waterway for over 90% of its Crude Oil imports and a vast majority of the Liquefied Natural Gas (LNG). Bottlenecks impact Japanese factories directly, inflating raw material costs, exacerbating inflation, and squeezing consumer purchasing power.
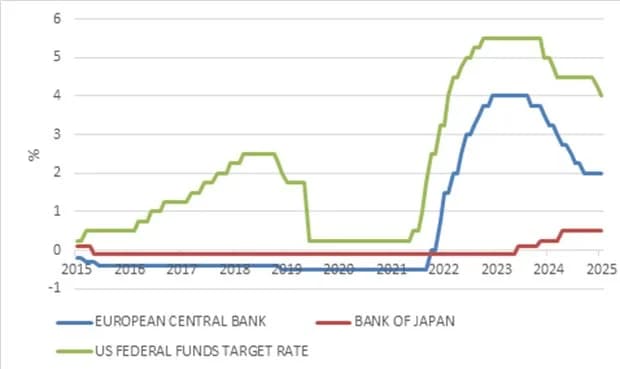
A widening rate gap contributes to the JPY fall
This puts the BoJ in a severe policy dilemma: raising interest rates amid the threat of inflation could dent a fragile economy, while holding rates down risks further currency depreciation.
In April, a rare vote split at the April BoJ meeting reflected growing pressure to increase interest rates in the near term. April’s discussions over the possibility of a hike, combined with the continued Yen weakness, make economists believe that the BoJ will indeed proceed to increase borrowing costs at its next meeting on June 16.
Still, it is unclear whether a hike will solve the Yen’s problems.
This is because the BoJ is still lagging other major central banks, which raised rates aggressively to combat inflation post-pandemic. This resulted in a massive interest rate gap that further contributed to the Yen’s weakness.
Government interventions fail to reverse the bearish trend
To prop up the embattled currency, Japanese authorities have spent a record ¥11.73 trillion ($74+ billion) in intervention between late April and early May.
The move, however, delivered only temporary relief for the Yen, as the aforementioned fundamental drivers continue to push the currency lower. Furthermore, Japan’s financial resources are finite, suggesting that the real pivot relies on the BoJ. Until then, the effect of any government intervention, even a potential joint action with the US, is unlikely to reverse the broader JPY bearish trend.
The Yen remains trapped between two forces Japan cannot easily control: high global energy prices and a wide interest-rate gap with other major central banks, particularly the Fed.
Another intervention in the Forex market could slow the move toward 160.00, but unless the BoJ delivers a stronger policy signal, any relief may prove short-lived. That leaves traders facing a familiar question: will Japan defend the line again?
Indian Rupee flattens while recovery in oil prices dampens outlook
The Indian Rupee (INR) trades almost flat against the US Dollar (USD) in the opening session on Tuesday. The USD/INR pair flattens around 95.00, while the Indian Rupee’s outlook has become uncertain as oil prices have bounced back due to fresh concerns over the United States (US)-Iran deal.
As of writing, the WTI Oil price trades 1.25% lower to near $90, but recovered strongly by over 4.5% on Monday. Theoretically, currencies from economies, such as India, which rely heavily on oil imports to meet their energy needs, tend to underperform when oil prices recover.
US-Iran negotiations toward a deal have been halted
Iran’s Tasnim News agency reported on Monday that members of the negotiating team of Tehran have stopped message exchanges with the US through mediators in protest against attacks on Lebanon.
Iran’s Parliament Speaker Mohammad Bagher Ghalibaf also said a post on X that the US naval blockade and war crimes in Lebanon are clear evidence of US noncompliance with the ceasefire. Separately, Iranian Foreign Minister Seyed Abbas Araghchi warned the US and Iran of serious consequences if there were military actions on all fronts, including Lebanon.
Meanwhile, US President Donald Trump has calmed market nerves by expressing confidence, in an interview with ABC News, that an agreement with Iran to extend the ceasefire and reopen the Strait of Hormuz over the next week, adding he had quickly resolved a diplomatic “glitch” that threatened to derail progress.
After threats of consequences to the US and Iran, President Donald Trump stated in a post on Truth Social that the exchange of attacks between Israel and Lebanon has been stopped.
Investors keenly await RBI’s policy
This week, the Reserve Bank of India’s monetary policy announcement on Friday will be the key trigger for the Indian currency. The RBI is almost certain to hold the Repo Rate steady at 5.25% and guide a hawkish stance on the monetary policy outlook, as elevated energy prices have prompted inflationary pressures. Investors will also focus on commentary from RBI Governor Sanjay Malhotra regarding the economic outlook in the wake of the Middle East crisis.
FIIs turned out net sellers on first day of June
Foreign Institutional Investors (FIIs) remained net sellers on the first day of June, offloading their stake worth Rs. 3,911.68 crore in the Indian stock market. Overseas investors have been paring their stake for a long time. Meanwhile, the Middle East tensions-driven energy supply shock has raised concerns over India Inc.’s projected earnings.
US JOLTS Job Openings data in spotlight
In Tuesday’s session, investors will focus on the US JOLTS Job Openings data for April, which will be published at 14:00 GMT. The JOLTS Job Openings data will provide cues regarding the job demand, information that influences the Federal Reserve’s (Fed) monetary policy expectations.
The data is expected to show that US employers posted 6.82 million fresh jobs, close to the March reading of 6.866 million.
Technical Analysis: USD/INR struggles to return above 20-day EMA
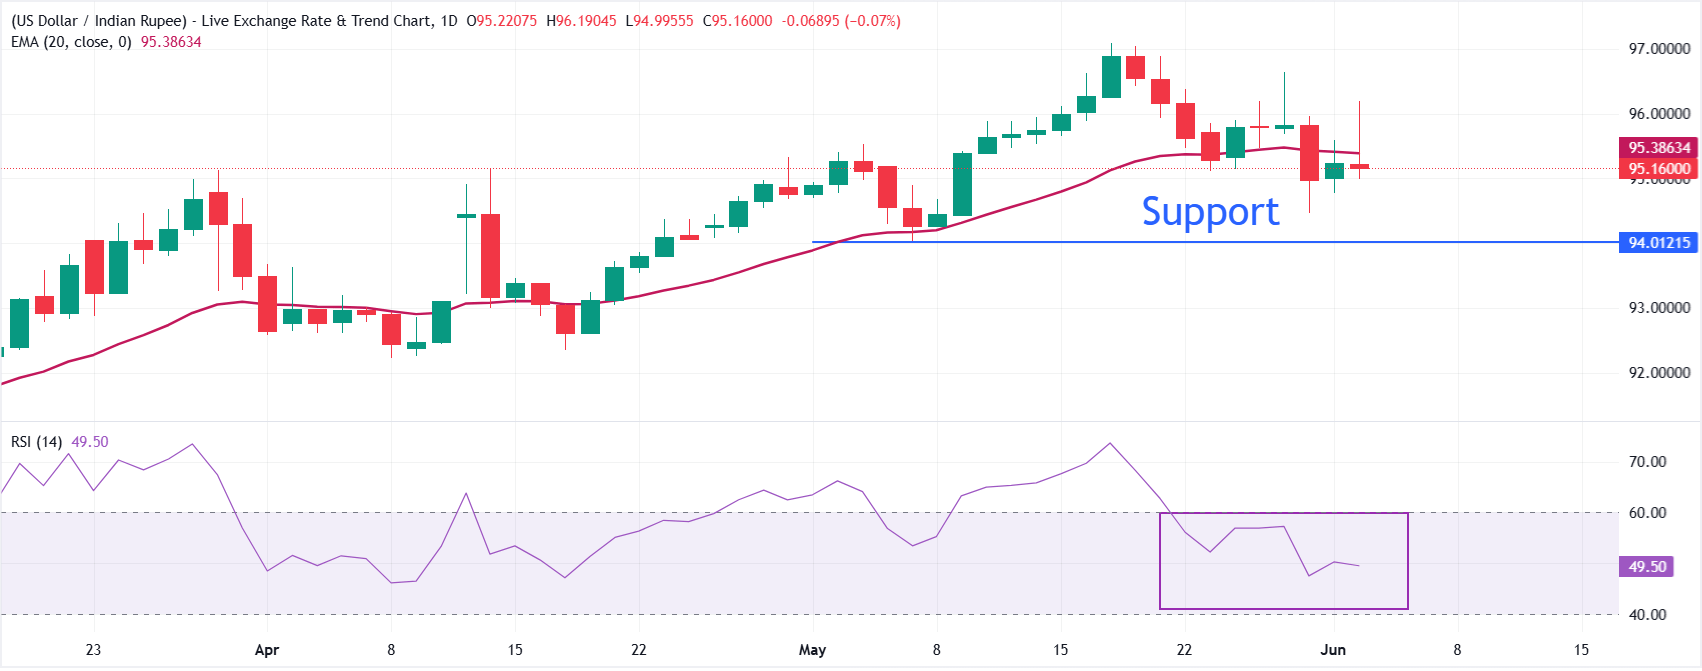
USD/INR trades almost flat at around 95.00, keeping a mildly bearish near-term tone as it holds just under the 20-day Exponential Moving Average (EMA) at 95.38. The pair has slipped back from recent highs, and the inability to reclaim the short-term EMA suggests upside attempts are being capped, while the Relative Strength Index (14) near 49.5 hints at fading momentum and a more balanced, consolidative backdrop rather than strong directional pressure.
On the topside, immediate resistance is located at the 20-day EMA around 95.39, and a daily close above this barrier would be needed to ease the current downside bias and reopen the path toward the May 28 high at 95.67. Looking down, the pair could decline towards 94.00 if it drops below the May 29 low at 94.46.
(The technical analysis of this story was written with the help of an AI tool.)
Silver FAQs
Silver is a precious metal highly traded among investors. It has been historically used as a store of value and a medium of exchange. Although less popular than Gold, traders may turn to Silver to diversify their investment portfolio, for its intrinsic value or as a potential hedge during high-inflation periods. Investors can buy physical Silver, in coins or in bars, or trade it through vehicles such as Exchange Traded Funds, which track its price on international markets.
Silver prices can move due to a wide range of factors. Geopolitical instability or fears of a deep recession can make Silver price escalate due to its safe-haven status, although to a lesser extent than Gold’s. As a yieldless asset, Silver tends to rise with lower interest rates. Its moves also depend on how the US Dollar (USD) behaves as the asset is priced in dollars (XAG/USD). A strong Dollar tends to keep the price of Silver at bay, whereas a weaker Dollar is likely to propel prices up. Other factors such as investment demand, mining supply – Silver is much more abundant than Gold – and recycling rates can also affect prices.
Silver is widely used in industry, particularly in sectors such as electronics or solar energy, as it has one of the highest electric conductivity of all metals – more than Copper and Gold. A surge in demand can increase prices, while a decline tends to lower them. Dynamics in the US, Chinese and Indian economies can also contribute to price swings: for the US and particularly China, their big industrial sectors use Silver in various processes; in India, consumers’ demand for the precious metal for jewellery also plays a key role in setting prices.
Silver prices tend to follow Gold’s moves. When Gold prices rise, Silver typically follows suit, as their status as safe-haven assets is similar. The Gold/Silver ratio, which shows the number of ounces of Silver needed to equal the value of one ounce of Gold, may help to determine the relative valuation between both metals. Some investors may consider a high ratio as an indicator that Silver is undervalued, or Gold is overvalued. On the contrary, a low ratio might suggest that Gold is undervalued relative to Silver.
Euro posts modest gains above 1.1600, Middle East tensions curb upside

The EUR/USD pair posts modest gains around 1.1635 during the early Asian session on Tuesday. Nonetheless, the potential upside might be limited, as Iran announced a halt to US negotiations and a full closure of the Strait of Hormuz, which could prompt risk-off sentiment. The preliminary reading of the Harmonized Index of Consumer Prices (HICP) from the Eurozone will be released later on Tuesday.
Iranian negotiators will stop exchanging messages with the United States (US) through intermediaries, and Iran will move to fully close the Strait of Hormuz, in retaliation for ongoing ceasefire violations, per CNBC. US President Donald Trump said on Monday that he called Israeli Prime Minister Benjamin Netanyahu and asked him not to proceed with a major raid on Beirut, and that Israeli troops were turned around.
However, Netanyahu contradicts Trump, emphasizing that he will continue operating against Hezbollah in Southern Lebanon. Escalating Middle East conflicts could boost a safe-haven currency such as the US dollar (USD) and act as a headwind for the major pair.
Across the pond, the hawkish stance of the European Central Bank (ECB) could provide some support to the shared currency. ECB executive board member Isabel Schnabel said on Monday that the central bank can no longer overlook the inflationary impact of the conflict in Iran, as price pressures have spread beyond the energy sector and the risk of unanchored inflation expectations has risen.
Euro FAQs
The Euro is the currency for the 20 European Union countries that belong to the Eurozone. It is the second most heavily traded currency in the world behind the US Dollar. In 2022, it accounted for 31% of all foreign exchange transactions, with an average daily turnover of over $2.2 trillion a day.
EUR/USD is the most heavily traded currency pair in the world, accounting for an estimated 30% off all transactions, followed by EUR/JPY (4%), EUR/GBP (3%) and EUR/AUD (2%).
The European Central Bank (ECB) in Frankfurt, Germany, is the reserve bank for the Eurozone. The ECB sets interest rates and manages monetary policy.
The ECB’s primary mandate is to maintain price stability, which means either controlling inflation or stimulating growth. Its primary tool is the raising or lowering of interest rates. Relatively high interest rates – or the expectation of higher rates – will usually benefit the Euro and vice versa.
The ECB Governing Council makes monetary policy decisions at meetings held eight times a year. Decisions are made by heads of the Eurozone national banks and six permanent members, including the President of the ECB, Christine Lagarde.
Eurozone inflation data, measured by the Harmonized Index of Consumer Prices (HICP), is an important econometric for the Euro. If inflation rises more than expected, especially if above the ECB’s 2% target, it obliges the ECB to raise interest rates to bring it back under control.
Relatively high interest rates compared to its counterparts will usually benefit the Euro, as it makes the region more attractive as a place for global investors to park their money.
Data releases gauge the health of the economy and can impact on the Euro. Indicators such as GDP, Manufacturing and Services PMIs, employment, and consumer sentiment surveys can all influence the direction of the single currency.
A strong economy is good for the Euro. Not only does it attract more foreign investment but it may encourage the ECB to put up interest rates, which will directly strengthen the Euro. Otherwise, if economic data is weak, the Euro is likely to fall.
Economic data for the four largest economies in the euro area (Germany, France, Italy and Spain) are especially significant, as they account for 75% of the Eurozone’s economy.
Another significant data release for the Euro is the Trade Balance. This indicator measures the difference between what a country earns from its exports and what it spends on imports over a given period.
If a country produces highly sought after exports then its currency will gain in value purely from the extra demand created from foreign buyers seeking to purchase these goods. Therefore, a positive net Trade Balance strengthens a currency and vice versa for a negative balance.
Carry trade: Selective opportunities as theory collides with practice – Commerzbank
Commerzbank’s Thu Lan Nguyen discusses the renewed popularity of FX carry trades as hopes grow for an end to the Middle East war. She stresses that long-run returns are not driven by interest differentials alone and warns that theory argues against persistent excess returns. Recent gains in G10 and EM carry baskets mask divergent outcomes between JPY and CHF funding strategies.
Carry appeal versus long term limits
“While an agreement between the US and Iran is still pending, investors are becoming increasingly bold on the back of hopes for an imminent end to the war in the Middle East. In the FX market, this can be seen in the fact that a comeback of so-called carry trades is already being proclaimed.”
“Strategy is not primarily based on the interest rate differential, but on the expectation that the higher-yielding currency will appreciate against the lower-yielding currency. Why? Because exchange rates are generally far more volatile than interest rates, meaning that any exchange-rate movement will significantly outweigh the interest income.”
“And indeed, this strategy has recently proven to be highly profitable. A strategy that, for example, goes long the three highest-yielding G10 currencies against the three lowest-yielding G10 currencies has delivered clearly positive returns since April of last year. An even better performance was achieved by a strategy that invested in selected emerging-market currencies.”
“Of course, theory does not always match practice. The recent winning streak does not have to end overnight just because theory says so. In the 2000s there was even a very long period during which carry trades were extremely profitable.”
“This shows that it pays to look at fundamental arguments for an appreciation or depreciation and not to blindly chase a trend.”
(This article was created with the help of an Artificial Intelligence tool and reviewed by an editor.)