Gold retreated sharply from the $4,400 area and trades flat for the day in the $4,320 price zone. Choppy trading conditions exacerbated the intraday decline, although XAU/USD bearish case is out of the picture, considering growing expectations for a dovish Fed and persistent geopolitical tensions.
GBP/USD dips below 1.3450 following final UK manufacturing PMI data

The Pound has been rejected at 1.3475 on the early London trading session on Friday, and retreated to session lows at the 1.3450 area at the time of writing. The pair has turned negative on the daily chart following the downward revision of the UK’s December $&P Global Manufacturing PMI, but remains within the weekly range, above 1.3400.
UK Manufacturing PMI figures released earlier on Friday revealed that the sector’s activity grew at a slower pace than previously estimated. The final reading has been revised to 50.6 from the preliminary estimation of 51.2, but remains above the 50.0 level that divides growth from contraction levels, and also above the 50.2 level seen in November.
Dollar recovery attempts remain limited
The immediate trend is bearish from late December highs above 1.3530, but the pair maintains most of the gains of the November-December rally, and closed the 2025 year with a more than 7% rally. U.S. President Trump’s erratic trade polices, signs of economic slowdown in the US, and the political pressures on the Fed to cut interest rates have weighed heavily on the US Dollar over the last 12 months
Looking forward, the Fed and BoE monetary policy paths are diverging. The UK central bank cut rates in December in a razor-edge decision, but the stubbornly high inflation levels and the strong opposition within the monetary policy committee practically discard any further easing move for the foreseeable future.
The Fed, on the other side, is expected to cut rates at least once more in 2026. Probably further than that if the US President replaces Jerome Powell for a more dovish-leaning Fed Chairman, as he has repeatedly pledged. Unless the context changes substantially, this is likely to keep US Dollar recovery attempts limited.
Economic Indicator
S&P Global Manufacturing PMI
The Manufacturing Purchasing Managers Index (PMI), released on a monthly basis by S&P Global, is a leading indicator gauging business activity in the UK’s manufacturing sector. The data is derived from surveys of senior executives at private-sector companies. Survey responses reflect the change, if any, in the current month compared to the previous month and can anticipate changing trends in official data series such as Gross Domestic Product (GDP), industrial production, employment and inflation. The index varies between 0 and 100, with levels of 50.0 signaling no change over the previous month. A reading above 50 indicates that the manufacturing economy is generally expanding, a bullish sign for the Pound Sterling (GBP). Meanwhile, a reading below 50 signals that activity among goods producers is generally declining, which is seen as bearish for GBP.
Last release: Fri Jan 02, 2026 09:30
Frequency: Monthly
Actual: 50.6
Consensus: 51.2
Previous: 51.2
Source: S&P Global
Economic Indicator
S&P Global Manufacturing PMI
The S&P Global Manufacturing Purchasing Managers Index (PMI), released on a monthly basis, is a leading indicator gauging business activity in the US manufacturing sector. The data is derived from surveys of senior executives at private-sector companies from the manufacturing sector. Survey responses reflect the change, if any, in the current month compared to the previous month and can anticipate changing trends in official data series such as Gross Domestic Product (GDP), industrial production, employment and inflation. A reading above 50 indicates that the manufacturing economy is generally expanding, a bullish sign for the US Dollar (USD). Meanwhile, a reading below 50 signals that activity in the manufacturing sector is generally declining, which is seen as bearish for USD.
Next release: Fri Jan 02, 2026 14:45
Frequency: Monthly
Consensus: 51.8
Previous: 51.8
Source: S&P Global
Forex Today: Markets remain quiet to begin 2026

Here is what you need to know on Friday, January 2:
Financial markets remain in holiday mood as the first trading day of the new year gets underway. The economic calendar will not offer any high-tier data releases on Friday and trading volumes could remain thin heading into the weekend.
US Dollar Price This week
The table below shows the percentage change of US Dollar (USD) against listed major currencies this week. US Dollar was the strongest against the New Zealand Dollar.
| USD | EUR | GBP | JPY | CAD | AUD | NZD | CHF | |
|---|---|---|---|---|---|---|---|---|
| USD | 0.24% | 0.18% | 0.27% | 0.37% | 0.10% | 1.23% | 0.56% | |
| EUR | -0.24% | -0.06% | 0.04% | 0.14% | -0.14% | 0.99% | 0.33% | |
| GBP | -0.18% | 0.06% | 0.25% | 0.20% | -0.08% | 1.05% | 0.39% | |
| JPY | -0.27% | -0.04% | -0.25% | 0.12% | -0.16% | 0.95% | 0.31% | |
| CAD | -0.37% | -0.14% | -0.20% | -0.12% | -0.23% | 0.86% | 0.19% | |
| AUD | -0.10% | 0.14% | 0.08% | 0.16% | 0.23% | 1.13% | 0.47% | |
| NZD | -1.23% | -0.99% | -1.05% | -0.95% | -0.86% | -1.13% | -0.66% | |
| CHF | -0.56% | -0.33% | -0.39% | -0.31% | -0.19% | -0.47% | 0.66% |
The heat map shows percentage changes of major currencies against each other. The base currency is picked from the left column, while the quote currency is picked from the top row. For example, if you pick the US Dollar from the left column and move along the horizontal line to the Japanese Yen, the percentage change displayed in the box will represent USD (base)/JPY (quote).
Following a modest recovery to end 2025, the US Dollar (USD) Index holds its ground in the European morning on Friday and fluctuates in a tight range above 98.00. Meanwhile, US stock index futures rise between 0.3% and 0.7% following the decline seen earlier in the week. On Monday, the Institute for Supply Management (ISM) will publish the Manufacturing Purchasing Managers’ Index (PMI) data for December.
Gold registered large losses ahead of the New Year break but managed to regain its traction on Friday. At the time of press, XAU/USD was trading near $4,380, rising more than 1% on a daily basis.
Similarly, XAG/USD stages a decisive rebound toward $74 and gains more than 3% on the day. Still, Silver is down nearly 7% for the week and remains on track to snap a five-week winning streak.
EUR/USD holds steady at around 1.1750 after edging lower in the first half of the week. Sentix Investors Confidence data for January will be featured in the European economic calendar later in the session.
After dropping to its lowest level in over a week and testing 1.3400 on the last day of 2025, GBP/USD reversed its direction and erased a large portion of its weekly losses. The pair stays relatively calm early Friday and trades above 1.3450.
Following Monday’s decline, USD/JPY closed in positive territory for two consecutive days. The pair continues to stretch higher and trades near 157.00 early Friday.
Gold FAQs
Gold has played a key role in human’s history as it has been widely used as a store of value and medium of exchange. Currently, apart from its shine and usage for jewelry, the precious metal is widely seen as a safe-haven asset, meaning that it is considered a good investment during turbulent times. Gold is also widely seen as a hedge against inflation and against depreciating currencies as it doesn’t rely on any specific issuer or government.
Central banks are the biggest Gold holders. In their aim to support their currencies in turbulent times, central banks tend to diversify their reserves and buy Gold to improve the perceived strength of the economy and the currency. High Gold reserves can be a source of trust for a country’s solvency. Central banks added 1,136 tonnes of Gold worth around $70 billion to their reserves in 2022, according to data from the World Gold Council. This is the highest yearly purchase since records began. Central banks from emerging economies such as China, India and Turkey are quickly increasing their Gold reserves.
Gold has an inverse correlation with the US Dollar and US Treasuries, which are both major reserve and safe-haven assets. When the Dollar depreciates, Gold tends to rise, enabling investors and central banks to diversify their assets in turbulent times. Gold is also inversely correlated with risk assets. A rally in the stock market tends to weaken Gold price, while sell-offs in riskier markets tend to favor the precious metal.
The price can move due to a wide range of factors. Geopolitical instability or fears of a deep recession can quickly make Gold price escalate due to its safe-haven status. As a yield-less asset, Gold tends to rise with lower interest rates, while higher cost of money usually weighs down on the yellow metal. Still, most moves depend on how the US Dollar (USD) behaves as the asset is priced in dollars (XAU/USD). A strong Dollar tends to keep the price of Gold controlled, whereas a weaker Dollar is likely to push Gold prices up.
GBP/USD gathers strength above 1.3450 on Fed rate cut bets, BoE’s gradual policy path

The GBP/USD pair gathers strength to around 1.3480 during the early Asian session on Friday. Expectations of the US Federal Reserve (Fed) rate cuts this year weigh on the US Dollar (USD) against the Pound Sterling (GBP). Philadelphia Fed President Anna Paulson is set to speak later on the weekend.
The Greenback ended 2025 with the sharpest annual decline in eight years. With at least two rate reductions priced in for this year, the Fed’s policy path diverges from the United Kingdom (UK), dimming the USD’s appeal. Financial markets are pricing in nearly a 15.0% chance the Fed will cut interest rates at its next meeting in January, according to the CME FedWatch tool.
Furthermore, anticipations that US President Donald Trump will name a dovish successor to Fed Chair Jerome Powell, whose term ends this year, might contribute to the USD’s downside. Trump stated that he expects the next Fed Chairman to keep interest rates low and never “disagree” with him. The comments are likely to heighten concerns among investors and policymakers about Fed independence.
On the other hand, the Bank of England (BoE) expects rates to continue on a gradual downward path, which provides some support to the Cable. The UK central bank reduced interest rates from 4.0% to 3.75% at its December policy meeting, the lowest level in nearly three years. Governor Andrew Bailey said during the press conference that rates are likely to continue on a gradual downward path, but “how much further we go becomes a closer call” with each cut.
Pound Sterling FAQs
The Pound Sterling (GBP) is the oldest currency in the world (886 AD) and the official currency of the United Kingdom. It is the fourth most traded unit for foreign exchange (FX) in the world, accounting for 12% of all transactions, averaging $630 billion a day, according to 2022 data.
Its key trading pairs are GBP/USD, also known as ‘Cable’, which accounts for 11% of FX, GBP/JPY, or the ‘Dragon’ as it is known by traders (3%), and EUR/GBP (2%). The Pound Sterling is issued by the Bank of England (BoE).
The single most important factor influencing the value of the Pound Sterling is monetary policy decided by the Bank of England. The BoE bases its decisions on whether it has achieved its primary goal of “price stability” – a steady inflation rate of around 2%. Its primary tool for achieving this is the adjustment of interest rates.
When inflation is too high, the BoE will try to rein it in by raising interest rates, making it more expensive for people and businesses to access credit. This is generally positive for GBP, as higher interest rates make the UK a more attractive place for global investors to park their money.
When inflation falls too low it is a sign economic growth is slowing. In this scenario, the BoE will consider lowering interest rates to cheapen credit so businesses will borrow more to invest in growth-generating projects.
Data releases gauge the health of the economy and can impact the value of the Pound Sterling. Indicators such as GDP, Manufacturing and Services PMIs, and employment can all influence the direction of the GBP.
A strong economy is good for Sterling. Not only does it attract more foreign investment but it may encourage the BoE to put up interest rates, which will directly strengthen GBP. Otherwise, if economic data is weak, the Pound Sterling is likely to fall.
Another significant data release for the Pound Sterling is the Trade Balance. This indicator measures the difference between what a country earns from its exports and what it spends on imports over a given period.
If a country produces highly sought-after exports, its currency will benefit purely from the extra demand created from foreign buyers seeking to purchase these goods. Therefore, a positive net Trade Balance strengthens a currency and vice versa for a negative balance.
Bitcoin Price Forecast: BTC hovers above $87,000 amid risk-averse New Year
Bitcoin (BTC) price hovers above $87,000 a press time on Thursday, holding steady after a 1% drop on the previous day. Institutional interest weakened by the end of last year, while corporate demand continues to accumulate. Derivatives data suggest a weakness in retail interest as BTC futures Open Interest declines.
Bitcoin starts the New Year with reduced demand
Bitcoin-focused Exchange Traded Funds (ETFs) in the US recorded an outflow of $348 million on Wednesday, nearly erasing the $355 million of inflow on the previous day. These ETFs recorded an outflow of $1.09 billion, advancing the withdrawal streak after $3.48 billion was offloaded in November.
Additionally, this marked the fifth bearish month last year, while the annual inflow stood at $21.07 trillion.

On the corporate side, Tether, a US Dollar-stablecoin issuer, announced acquiring 8,888 BTC over the past three months. Tether’s move alongside Michael Saylor’s Strategy and Metaplanet boosted their holdings to 672,497 BTC and 35,102 BTC, respectively, which reflects an increase in corporate demand.

However, short-term volatility in Bitcoin has led to a decline in retail risk exposure in its derivatives market. CoinGlass data shows a decrease in BTC futures Open Interest (OI) to $54.62 billion on Thursday, from $94.12 billion on October 7. Typically, a decline in OI indicates that traders are either closing positions or reducing leverage, signaling risk-off sentiment.

Technical outlook: Bitcoin consolidates in a triangle pattern
Bitcoin price is trading below $88,000 at the time of writing on Thursday, down 1% from Wednesday. The BTC is extending its sideways trend within a symmetrical triangle pattern, as previously reported by FXStreet.
The overhead resistance trendline near $92,000 is slightly above the 50-day Exponential Moving Average (EMA) at $91,629.
Technically, Bitcoin is losing momentum in the short term. The Relative Strength Index (RSI) at 445 hovers near the halfway line, indicating a neutral stand. Meanwhile, the Moving Average Convergence Divergence (MACD) steadily approaches the zero line, but fluctuating green histogram bars indicate a potentially unsustainable bullish momentum.

If BTC price slips below the support trendline near $85,000, it could test the S1 Pivot Point at $82,784.
Bitcoin, altcoins, stablecoins FAQs
Bitcoin is the largest cryptocurrency by market capitalization, a virtual currency designed to serve as money. This form of payment cannot be controlled by any one person, group, or entity, which eliminates the need for third-party participation during financial transactions.
Altcoins are any cryptocurrency apart from Bitcoin, but some also regard Ethereum as a non-altcoin because it is from these two cryptocurrencies that forking happens. If this is true, then Litecoin is the first altcoin, forked from the Bitcoin protocol and, therefore, an “improved” version of it.
Stablecoins are cryptocurrencies designed to have a stable price, with their value backed by a reserve of the asset it represents. To achieve this, the value of any one stablecoin is pegged to a commodity or financial instrument, such as the US Dollar (USD), with its supply regulated by an algorithm or demand. The main goal of stablecoins is to provide an on/off-ramp for investors willing to trade and invest in cryptocurrencies. Stablecoins also allow investors to store value since cryptocurrencies, in general, are subject to volatility.
Bitcoin dominance is the ratio of Bitcoin’s market capitalization to the total market capitalization of all cryptocurrencies combined. It provides a clear picture of Bitcoin’s interest among investors. A high BTC dominance typically happens before and during a bull run, in which investors resort to investing in relatively stable and high market capitalization cryptocurrency like Bitcoin. A drop in BTC dominance usually means that investors are moving their capital and/or profits to altcoins in a quest for higher returns, which usually triggers an explosion of altcoin rallies.
Meme Coins Price Prediction: Dogecoin, Shiba Inu, Pepe struggle to recover
Meme coins, including Dogecoin (DOGE), Shiba Inu (SHIB), and Pepe (PEPE), started the New Year under bearish pressure after Wednesday’s decline of 2% to 4%. Large wallet investors, popularly known as whales, accumulate DOGE but lose confidence in SHIB and PEPE. Technically, the meme coins are poised for further decline amid intense selling pressure and a lack of sustained recovery in Bitcoin (BTC).
Whales prefer DOGE over SHIB and PEPE
On-chain data shows that whale holdings of DOGE increased this week, while offloading of SHIB and PEPE added to supply pressure. According to Santiment, whales holding 100 million to 1 billion DOGE have a total of 35.86 billion DOGE, up from 34.59 billion on Sunday, indicating increased confidence among large wallet investors.

On the other hand, holding of Shiba Inu whales with 1 million to 100 million SHIB dropped to 11.06 trillion, from 11.12 trillion on Monday. Similarly, Pepe whales with 1 million to 100 million PEPE trim their holding to 4.45 trillion PEPE from 4.47 trillion PEPE on Monday. At the same time, investors with 100 million to 1 billion tokens reduce exposure to 10.74 trillion, down from 10.77 trillion in the same period.

Dogecoin risks a bearish breakout of a falling wedge pattern
Dogecoin is down over 4% this week so far, extending the downfall for the sixth consecutive week. The dog-themed meme coin declines in a descending wedge pattern on the daily chart, approaching the support trendline connecting the November 21 and December 18 lows, near $0.1111.
A decisive close below this level could threaten the $0.1000 psychological level for an extended correction to the October 10 low at $0.0950.
The Relative Strength Index (RSI) is at 33 on the daily chart, hovering near the oversold zone. This indicates intense selling pressure, and a drop into the oversold zone could indicate further correction.
At the same time, the Moving Average Convergence Divergence (MACD) drops to the signal line, resulting in a fresh cycle of red histogram bars below the zero line. This indicates renewed bearish momentum.

A potential DOGE rebound could face resistance near the R1 Pivot Point at $0.1290.
Shiba Inu flashes bearish potential
Shiba Inu is in a declining trend within a broadening wedge pattern, as indicated by two diverging trendlines on the daily chart. At the time of writing, SHIB is up 1% on Thursday, recovering from the 2.68% drop on the previous day.
The intraday recovery halts the three-day decline of over 6%, with bulls targeting the center Pivot Point at $0.00000775.
The technical indicators on the daily chart remain mixed. The RSI at 38 is pointing upwards from the oversold zone, signaling a drop in selling pressure. Meanwhile, the MACD and signal line are close, indicating reduced bullish momentum.

Looking down, the crucial support for SHIB lies at the S1 Pivot Point at $0.00000598.
Pepe’s recovery lacks momentum
Pepe edges higher by over 1% at press time on Thursday, turning around after Wednesday’s 2.66% drop. If the frog-themed meme coin extends its recovery, the R1 Pivot Point at $0.00000424 remains a crucial level of resistance.
The technical indicators on the daily chart remain neutral, with the RSI at 45 approaching the halfway line, while the MACD and signal line stay in an uptrend. However, a reduction in green histogram bars in the MACD indicator suggests a decline in bullish momentum.

On the flip side, a reversal to the downside could push PEPE toward the December 18 low at $0.00000363.
Terra Classic Price Forecast: LUNC recovers on the New Year amid steady burn rate
Terra Classic (LUNC) is down 1% at press time on Thursday, taking a breather after Wednesday’s 13% rise. A steady burn of LUNC supply, with over 124 million LUNC tokens wiped out on Wednesday, fueled short-term surges in Terra Classic. However, the technical outlook anticipates the continuation of the prevailing downtrend, given previous short-lived recoveries.
Daily burns pump LUNC prices
LUNCmetrics data shows a sudden increase in the daily burn rate of LUNC tokens, fueling the Terra Classic price surge. Over 124 million LUNC were wiped out on Wednesday, marking the largest daily burn since December 17 and boosting the total to over 430 billion burned tokens. A reduction in supply often leads to a price surge; however, LUNC suffers from a severe oversupply of 6.47 trillion tokens, exerting persistent supply pressure.

The recovery suggests that Do Kwon’s final hearing on a 15-year prison sentence has been priced in alongside the $4 billion lawsuit against Jump Trading for illegally profiting from the $40 billion crash of Terra Labs.
Technical outlook: Could LUNC sustain the recovery?
Terra Classic’s 13% surge on Wednesday marked an end to a three-day decline and crossed above the 50-day Exponential Moving Average (EMA) $0.00004055. At the time of writing, LUNC drops by 1% on Thursday, struggling to surpass the 100-day EMA at $0.00004309.
If LUNC exceeds this moving average, it could reach the 200-day EMA at $0.004963 near the R1 Pivot Point at $0.00004945.
The technical indicators on the daily chart remain neutral, with a potential bullish shift incoming. The Relative Strength Index (RSI) at 51 hovers near the midline, flashing a neutral stance.
At the same time, the Moving Average Convergence Divergence (MACD) approaches the signal line as bearish momentum wanes. A potential crossover could trigger a buy signal and renewed bullish momentum.

If LUNC drops below $0.00004055, it could threaten the December 19 low at $0.00003610.
Top Crypto Gainers: Canton, MYX Finance, and Chiliz lead the New Year rally
Canton (CC), MYX Finance (MYX), and Chiliz (CHZ) are the top performers over the last 24 hours, marking a bullish start to the New Year. The recovery in CC, MYX, and CHZ is gaining momentum, increasing the possibility of further gains.
Canton extends the rally above $0.16
Canton is up nearly 8% at press time on Thursday, adding gains to the 3% rise from the previous day. The intraday recovery holds above the R1 Pivot Point at $0.1636 on the 4-hour chart, with bulls waiting for a decisive close.
If CC clears this level, the rally could extend to the R2 Pivot Point at $0.1868.
The technical indicators on the 4-hour chart corroborate the bullish thesis. The Relative Strength Index (RSI) is at 79, rising into the overbought zone as buying pressure strengthens. Additionally, the Moving Average Convergence Divergence (MACD) moves upward from the signal line, indicating a surge in bullish momentum.

On the flip side, a potential reversal below $0.1636 could test the $0.1500 psychological level, followed by the center Pivot Point at $0.1215.
MYX Finance gains traction, with bulls aiming for $4 breakout
MYX Finance hovers around $3.90 with bulls aiming for the $4 mark after the 6.56% rise on Wednesday. At the time of writing, MYX is up nearly 2% on Thursday, extending a steady upward trend for the ninth day.
If the MYX token secures a daily close above the R2 Pivot Point at $4.01 on the 4-hour chart, the uptrend could target the R3 Pivot Point at $4.37.
The RSI is at 67 on the 4-hour chart, fluctuating below the overbought zone, indicating a persistent buying pressure. At the same time, the MACD and signal line rise upward following a crossover on Wednesday, upholding the buy signal.

Looking down, the MYX token could find support at the R1 Pivot Point at $3.75 in case of a reversal.
Chiliz’s high-speed recovery aims to surpass $0.050
Chiliz trades above $0.04000 at press time on Thursday, extending the 6.50% rise from the previous day. The intraday recovery marks the fourth day of the uptrend, accounting for over 17% weekly gains so far.
If CHZ clears the previous swing high of July 21 at $0.04630, it could confirm a trend reversal to the upside. However, to reinstate a bullish trend, Chiliz should clear the $0.05000 psychological level, which is slightly above the R1 Pivot Point at $0.04948.
The RSI is at 73 on the daily chart, indicating an overbought condition and suggesting a rise in buying pressure. Additionally, the MACD and signal line continue to trend upward, while the successively rising green histogram bars indicate a surge in bullish momentum.

If Chiliz fails to hold above $0.04000, it could retest the centre Pivot Point at $0.03872.
Bitcoin and Ethereum could be the only cryptos to attract institutional capital in 2026: Here’s why

The two largest cryptocurrencies, Bitcoin (BTC) and Ethereum (ETH), could grow bigger in 2026 at the expense of altcoins.
Following a rocky crypto market in Q4’25, institutional investors are beginning to rotate from altcoins toward the top two cryptos. According to the Shark Tank blog, investor Kevin O’Leary sold off all his digital assets except Bitcoin and Ethereum.
The move mirrors that of most retail and institutional players, who have been rotating from alts to majors, according to a report by Jasper De Maere, trader at market-making firm Wintermute. Net over-the-counter (OTC) buying/selling pressure for BTC and ETH has flipped positive heading into 2026.
BTC & ETH Net Over-The-Counter (OTC) Buying/Selling. Source: Wintermute
However, altcoins remained subdued by “heavy supply overhangs and a busy token unlock schedule, keeping pressure on the long tail,” De Maere notes.
Going into 2026, liquidity is one of the major factors investors are paying attention to. Aside from being the top two digital assets by market capitalization, Bitcoin and Ethereum have the deepest liquidity in the crypto market. During periods of market stress, crypto assets with low liquidity are susceptible to heavy liquidations.
This is evidenced by the October 10 crypto leverage flush, which triggered liquidations of about $40 billion, when accounting for underreported figures due to the lag in exchange reporting and API limitations, according to Coinglass data. Altcoins bore the brunt of the event, with many witnessing heavy drawdowns not seen since the 2022 bear market.
“Mainstream assets like BTC and ETH saw maximum drawdowns roughly in the 10–15% range, whereas a vast number of altcoins and long-tail assets experienced extreme retracements of 80% or even approached zero,” noted Coinglass in its annual derivatives report. “This reflects that the liquidation chain and ADL execution produced the most severe price distortions on assets with the poorest liquidity.”
As a result, liquidity flowing toward altcoins has diminished compared to the top two cryptos. Before the October crash, total crypto open interest was 2.8x that of altcoin open interest. However, total OI has increased to about 4x altcoin OI since the crash, signalling an increasing dominance of Bitcoin and Ethereum.
Regulation and corporate interest are also influencing the rotation
Regulation also plays a role. The upcoming CLARITY Act will help classify digital assets that fall within the jurisdiction of the Securities and Exchange Commission (SEC) and the Commodity Futures Trading Commission (CFTC). While the bill is largely seen as a positive for the crypto industry, it’s unclear which cryptocurrencies will be classified as commodities and securities.
Shark Tank blog suggests O’Leary and a few professional investors are rotating from altcoins toward Bitcoin and Ethereum until the bill is finalized, since they’re the only crypto assets with clear regulatory classification.
Additionally, investors are looking into corporate demand for cryptocurrencies. The digital asset treasury (DAT) narrative, which saw corporate firms accumulating altcoins in Q3, was almost absent in Q4. However, Bitcoin and Ethereum continue to see demand from weekly acquisitions by Strategy and BitMine, helping both cryptos to remain fairly stable compared to altcoins.
On the flip side, Bitwise CIO Matt Hougan is playing the indexing game. Following the launch of the firm’s crypto index fund, Hougan stated that he prefers to bet on the entire market rather than going through the hassle of predicting a few winners.
BTC is trading around $87,500, and ETH has edged close to $2,970, down 1.2% and 0.2%, respectively, at the time of publication on Wednesday.
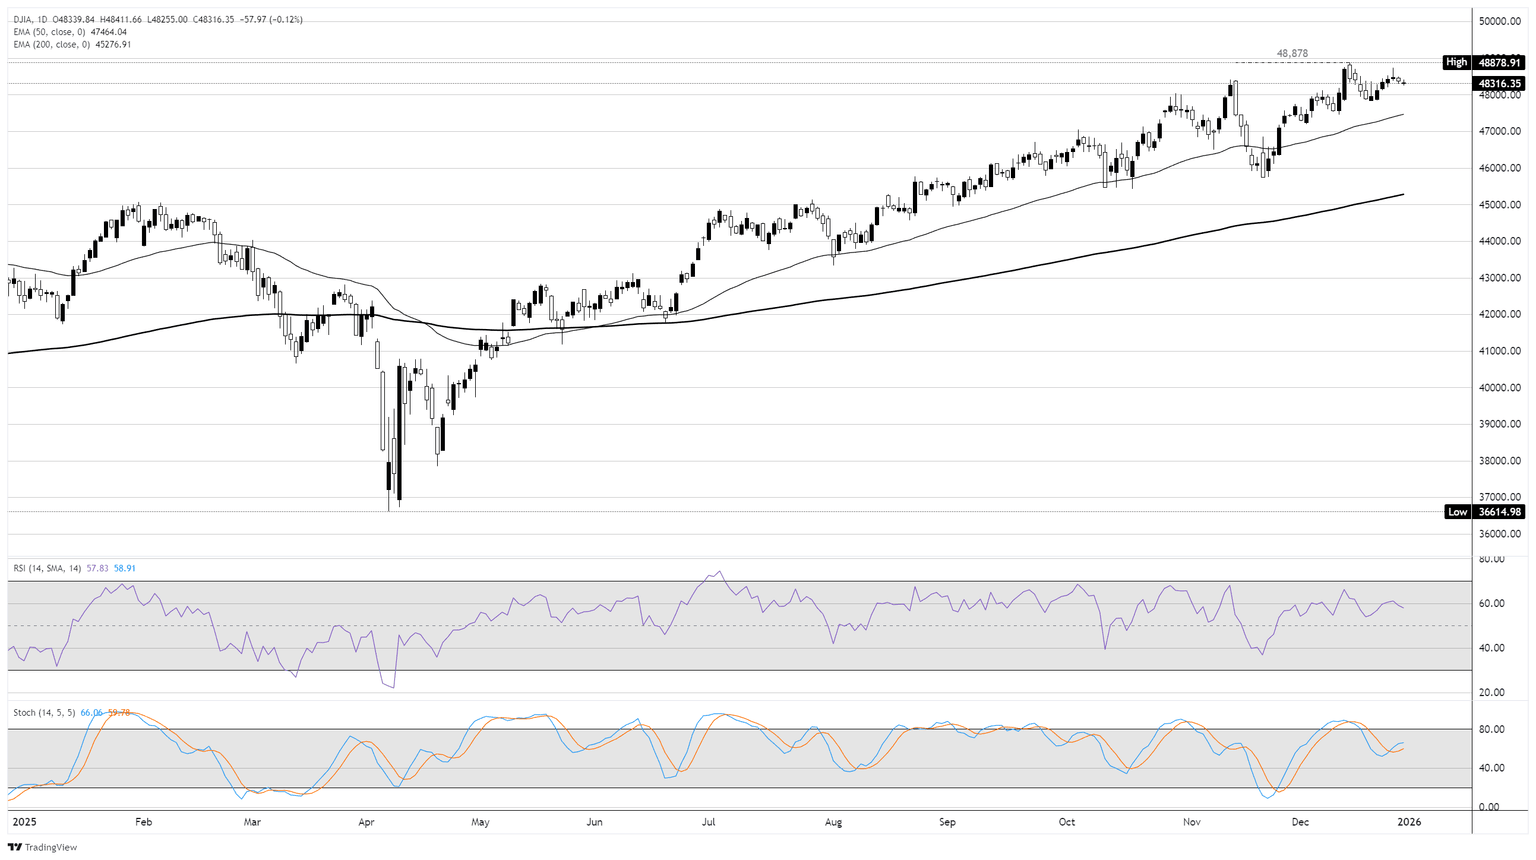
Dow Jones Industrial Average softens on final trading day of 2025
US equities pulled back modestly midweek, but the broader picture for investors remains one of a strong year nearing its conclusion. The S&P 500 slipped about 0.2% on Wednesday, matching declines in the Nasdaq Composite, while the Dow Jones Industrial Average fell roughly 0.5%. The market is on a mild three-session losing streak, yet the losses have done little to dent what has been an impressive annual performance. The S&P 500 is on track for a gain of roughly 17% in 2025, its third consecutive double-digit advance, while the Nasdaq has climbed about 21% on the back of sustained enthusiasm around artificial intelligence. The Dow has lagged somewhat with a 13% gain, reflecting its lower exposure to technology stocks.
From a seasonal perspective, December has remained a buster month for equities. Both the Dow and the S&P 500 are on pace to finish the month higher, each notching what would be an eighth consecutive winning month, a streak not seen since 2018. The Nasdaq, however, has been roughly flat for the month, underscoring the more selective nature of recent gains.
Corporate and economic updates offered a mixed but generally stable backdrop. Nike (NKE) shares rose after multiple insiders, including board members and the CEO, increased their stakes following a difficult year in which the stock fell more than 17%. On the macro front, labor market data pointed to continued resilience. Initial jobless claims fell to 199K in the latest week, well below expectations, while continuing claims also declined, reinforcing the picture of a low-hire, low-fire environment as the year comes to a close.
Stocks had a rough start despite a strong finish
This strength marks a sharp recovery from the turmoil seen in early April, when sweeping tariff announcements triggered a near bear market drawdown that pushed the S&P 500 close to a 19% decline from its February high. Since then, investors have grown more confident that trade policy lessons were absorbed and that companies can adjust supply chains and pricing to protect margins. Even so, the recent softness has raised some concern, as the final trading days of the year and the first sessions of January are typically associated with the so-called Santa Claus rally. The current bout of profit taking may also be an early signal of choppier conditions ahead. While many strategists expect another positive year for stocks in 2026, there is growing debate over whether returns will be more range-bound as earnings growth works to justify elevated valuations.
Artificial intelligence continues to shape market narratives, though its influence has become more nuanced. After blockbuster gains in 2023 and 2024 tied to the emergence of generative AI, leadership broadened in 2025 and performance within the largest technology stocks diverged. Alphabet stood out with gains exceeding 65% as investors positioned it as a key AI beneficiary, while Amazon lagged with a much more modest advance. At the same time, returns outside the megacaps improved notably, with commodities delivering exceptional performance. Gold rose more than 64% this year and silver surged over 140%, putting both metals on track for their strongest annual gains since the late 1970s. This shift in market internals has fueled expectations that future returns may depend more on traditional fundamentals than on monetary policy or massive AI infrastructure spending.
Dow Jones daily chart
Dow Jones FAQs
The Dow Jones Industrial Average, one of the oldest stock market indices in the world, is compiled of the 30 most traded stocks in the US. The index is price-weighted rather than weighted by capitalization. It is calculated by summing the prices of the constituent stocks and dividing them by a factor, currently 0.152. The index was founded by Charles Dow, who also founded the Wall Street Journal. In later years it has been criticized for not being broadly representative enough because it only tracks 30 conglomerates, unlike broader indices such as the S&P 500.
Many different factors drive the Dow Jones Industrial Average (DJIA). The aggregate performance of the component companies revealed in quarterly company earnings reports is the main one. US and global macroeconomic data also contributes as it impacts on investor sentiment. The level of interest rates, set by the Federal Reserve (Fed), also influences the DJIA as it affects the cost of credit, on which many corporations are heavily reliant. Therefore, inflation can be a major driver as well as other metrics which impact the Fed decisions.
Dow Theory is a method for identifying the primary trend of the stock market developed by Charles Dow. A key step is to compare the direction of the Dow Jones Industrial Average (DJIA) and the Dow Jones Transportation Average (DJTA) and only follow trends where both are moving in the same direction. Volume is a confirmatory criteria. The theory uses elements of peak and trough analysis. Dow’s theory posits three trend phases: accumulation, when smart money starts buying or selling; public participation, when the wider public joins in; and distribution, when the smart money exits.
There are a number of ways to trade the DJIA. One is to use ETFs which allow investors to trade the DJIA as a single security, rather than having to buy shares in all 30 constituent companies. A leading example is the SPDR Dow Jones Industrial Average ETF (DIA). DJIA futures contracts enable traders to speculate on the future value of the index and Options provide the right, but not the obligation, to buy or sell the index at a predetermined price in the future. Mutual funds enable investors to buy a share of a diversified portfolio of DJIA stocks thus providing exposure to the overall index.