Gold now extends its rally and revisits the $4,850 area per troy ounce on Thursday, helped by the decent pullback in the US Dollar. In addition, the move higher in the yellow metal comes despite a generalised improvement in global risk appetite after President Trump reversed course on Greenland, easing at the same time geopolitical tensions.
Pi Network Price Forecast: PI rebounds on creator event, PI payments updates
Pi Network (PI) recovers by over 3% at press time on Thursday, after a steady declining trend. The rebound aligns with the announcement of new updates to the network, including the integration of PI payments and a community-centered creator event. Investors removing over 1 million PI tokens from Centralized Exchanges (CEXs) adds to the easing in supply pressure.
Retail demand strengthens amid Pi Network plans to boost ecosystem
Pi Network announced plans on Wednesday to boost the ecosystem, including a creator event, integration of the PI payments system into apps built on the network, and extended access to app creation. However, the PI payments support is limited to Test-Pi, and new or non-migrated Pioneers can now deploy app iterations by watching ads instead of paying fees. The ad-supported application building on Pi App Studio could reduce the financial burden of creating Pi applications.
Meanwhile, the announcement is warming up the retail demand. PiScan data shows that the users have removed 1.17 million PI tokens from CEXs over the past 24 hours, reducing their wallet reserves and selling pressure.

Technical outlook: Will Pi Network resurface above $0.20?
Pi Network’s sudden recovery of over 3% so far on Thursday reduces this week’s loss to under 7%. Still, the rebound on the back of new updates remains under intense pressure from the prevailing downtrend.
PI should sustain a decisive close above the $0.1919 support-turned-resistance level, marked by the October 11 low, to further extend the rally, potentially targeting the December 19 high at $0.2177.
Technical indicators on the daily chart suggest a minor relief from consistent bearish momentum. The Relative Strength Index (RSI) is pointing upwards at 32 and recovering from the oversold zone, while the Moving Average Convergence Divergence (MACD) extends below the signal line but red histogram bars contract.

However, a potential reversal would shift PI into the support discovery phase with a deeper zone present between the October 10 and January 19 lows at $0.1533 and $0.1502, respectively.
Bitcoin, altcoins, stablecoins FAQs
Bitcoin is the largest cryptocurrency by market capitalization, a virtual currency designed to serve as money. This form of payment cannot be controlled by any one person, group, or entity, which eliminates the need for third-party participation during financial transactions.
Altcoins are any cryptocurrency apart from Bitcoin, but some also regard Ethereum as a non-altcoin because it is from these two cryptocurrencies that forking happens. If this is true, then Litecoin is the first altcoin, forked from the Bitcoin protocol and, therefore, an “improved” version of it.
Stablecoins are cryptocurrencies designed to have a stable price, with their value backed by a reserve of the asset it represents. To achieve this, the value of any one stablecoin is pegged to a commodity or financial instrument, such as the US Dollar (USD), with its supply regulated by an algorithm or demand. The main goal of stablecoins is to provide an on/off-ramp for investors willing to trade and invest in cryptocurrencies. Stablecoins also allow investors to store value since cryptocurrencies, in general, are subject to volatility.
Bitcoin dominance is the ratio of Bitcoin’s market capitalization to the total market capitalization of all cryptocurrencies combined. It provides a clear picture of Bitcoin’s interest among investors. A high BTC dominance typically happens before and during a bull run, in which investors resort to investing in relatively stable and high market capitalization cryptocurrency like Bitcoin. A drop in BTC dominance usually means that investors are moving their capital and/or profits to altcoins in a quest for higher returns, which usually triggers an explosion of altcoin rallies.
Forex Today: Mood improves on easing EU-US tensions, eyes on US data

Here is what you need to know on Thursday, January 22:
Market mood improves in the second half of the week as tensions between the United States (US) and the European Union (EU) ease. In the American session, the US Bureau of Economic Analysis will publish a revision to the third-quarter Gross Domestic Product (GDP) data and release the Personal Consumption Expenditure (PCE) Price Index figures for October and November. Additionally, investors will pay close attention to the weekly Initial Jobless Claims data.
US Dollar Price This week
The table below shows the percentage change of US Dollar (USD) against listed major currencies this week. US Dollar was the weakest against the New Zealand Dollar.
| USD | EUR | GBP | JPY | CAD | AUD | NZD | CHF | |
|---|---|---|---|---|---|---|---|---|
| USD | -0.90% | -0.60% | 0.68% | -0.64% | -1.98% | -2.01% | -0.81% | |
| EUR | 0.90% | 0.31% | 1.56% | 0.25% | -1.10% | -1.12% | 0.08% | |
| GBP | 0.60% | -0.31% | 1.02% | -0.06% | -1.40% | -1.43% | -0.22% | |
| JPY | -0.68% | -1.56% | -1.02% | -1.30% | -2.61% | -2.63% | -1.46% | |
| CAD | 0.64% | -0.25% | 0.06% | 1.30% | -1.31% | -1.35% | -0.17% | |
| AUD | 1.98% | 1.10% | 1.40% | 2.61% | 1.31% | -0.03% | 1.19% | |
| NZD | 2.01% | 1.12% | 1.43% | 2.63% | 1.35% | 0.03% | 1.22% | |
| CHF | 0.81% | -0.08% | 0.22% | 1.46% | 0.17% | -1.19% | -1.22% |
The heat map shows percentage changes of major currencies against each other. The base currency is picked from the left column, while the quote currency is picked from the top row. For example, if you pick the US Dollar from the left column and move along the horizontal line to the Japanese Yen, the percentage change displayed in the box will represent USD (base)/JPY (quote).
Risk flows returned to markets late Wednesday after US President Donald Trump said that they have agreed on “the framework of a future deal with respect to Greenland” and added that they will not be imposing tariffs on eight European nations that were scheduled to go into effect on February 1. Following Tuesday’s sharp decline, Wall Street main indexes gained more than 1% midweek. Early Thursday, US stock index futures trade marginally higher. Meanwhile, the US Dollar (USD) Index stays releativley quiet below 99.00 after snapping a two-day losing streak on Wednesday.
The data from Australia showed early Thursday that the Unemployment Rate declined to 4.1% in December from 4.3% in November. This print came in better than the market expectation of 4.4%. According to the other details of the report, the Employment Change was +65.2K in this period following the 28.7K decrease recorded in November. AUD/USD gathers bullish momentum on the back of upbeat data and trades at its highest level since October 2024 above 0.6800, rising about 0.7% on the day.
EUR/USD stays in a consolidation phase below 1.1700 after losing more than 0.3% on Wednesday. The European Central Bank (ECB) will publish the Monetary Policy Meeting Accounts later in the session and the European Commission will release preliminary Consumer Confidence Index data for January.
GBP/USD moves sideways above 1.3400 in the European session on Thursday following Wednesday’s correction.
After struggling to find direction in the first half of the week, USD/JPY gains traction and advances toward 159.00 early Thursday. The Bank of Japan (BoJ) will announce monetary policy decisions in the Asian session on Friday.
Gold retreated from the record-high it set near $4,890 on Wednesday but closed the day in positive territory. Following an extended decline in the Asian session, XAU/USD found support and was last seen trading flat on the day above $4,800.
Inflation FAQs
Inflation measures the rise in the price of a representative basket of goods and services. Headline inflation is usually expressed as a percentage change on a month-on-month (MoM) and year-on-year (YoY) basis. Core inflation excludes more volatile elements such as food and fuel which can fluctuate because of geopolitical and seasonal factors. Core inflation is the figure economists focus on and is the level targeted by central banks, which are mandated to keep inflation at a manageable level, usually around 2%.
The Consumer Price Index (CPI) measures the change in prices of a basket of goods and services over a period of time. It is usually expressed as a percentage change on a month-on-month (MoM) and year-on-year (YoY) basis. Core CPI is the figure targeted by central banks as it excludes volatile food and fuel inputs. When Core CPI rises above 2% it usually results in higher interest rates and vice versa when it falls below 2%. Since higher interest rates are positive for a currency, higher inflation usually results in a stronger currency. The opposite is true when inflation falls.
Although it may seem counter-intuitive, high inflation in a country pushes up the value of its currency and vice versa for lower inflation. This is because the central bank will normally raise interest rates to combat the higher inflation, which attract more global capital inflows from investors looking for a lucrative place to park their money.
Formerly, Gold was the asset investors turned to in times of high inflation because it preserved its value, and whilst investors will often still buy Gold for its safe-haven properties in times of extreme market turmoil, this is not the case most of the time. This is because when inflation is high, central banks will put up interest rates to combat it.
Higher interest rates are negative for Gold because they increase the opportunity-cost of holding Gold vis-a-vis an interest-bearing asset or placing the money in a cash deposit account. On the flipside, lower inflation tends to be positive for Gold as it brings interest rates down, making the bright metal a more viable investment alternative.
Australian Dollar advances as employment data strengthens tighter RBA outlook
The Australian Dollar advances against the US Dollar (USD) on Thursday, following the seasonally adjusted employment data from Australia, which strengthens expectations of tighter monetary policy from the Reserve Bank of Australia (RBA)
The Australian Bureau of Statistics (ABS) released the Australian Employment Change, which arrived at 65.2K in December, swinging from 28.7K jobs losses (revised from 21.3K jobs losses) in November, compared with the consensus forecast of 30K. Meanwhile, the Unemployment Rate declined to 4.1% from 4.3% prior, against the market consensus of 4.4%.
Sean Crick, head of labour statistics at the ABS, said that this month saw more people aged 15–24 move into employment, contributing to the increase in overall employment and the decline in the unemployment rate.
The International Monetary Fund (IMF) has urged the RBA to remain cautious, highlighting that inflation has stayed above the Bank’s 2%–3% target band for a prolonged period, even though headline CPI eased more quickly than anticipated in November.
US Dollar gains after Trump backs off tariff threat on Europe
- The US Dollar Index (DXY), which measures the value of the US Dollar against six major currencies, is holding ground after registering modest gains in the previous session and trading around 98.80 at the time of writing.
- The Greenback gained ground after Bloomberg reported on Wednesday that US President Donald Trump said he would step back from imposing tariffs on goods from European nations opposing his effort to take possession of Greenland. He said earlier there is “no going back” on his ambitions regarding Greenland, alongside earlier threats to impose new 10% tariffs on eight European Union (EU) countries.
- President Trump also said that the United States and the North Atlantic Treaty Organization (NATO) had “formed the framework of a future deal regarding Greenland.” However, he did not outline the parameters of the so-called framework, and it remained unclear what the agreement would entail.
- US labor market data has pushed back expectations for further Federal Reserve (Fed) rate cuts until June. Fed officials have signaled little urgency to ease policy further until there is clearer evidence that inflation is sustainably moving toward the 2% target. Morgan Stanley analysts revised their 2026 outlook, now forecasting one rate cut in June followed by another in September, compared with their previous expectation of cuts in January and April.
- The People’s Bank of China (PBOC), China’s central bank, announced on Tuesday that it would leave its Loan Prime Rates (LPRs) unchanged. The one-year and five-year LPRs were at 3.00% and 3.50%, respectively. It is essential to note that any changes in the Chinese economy could impact the Australian Dollar, as both countries are close trading partners.
- China’s Industrial Production rose 5.2% year-over-year YoY in December, accelerating from 4.8% in November, supported by resilient export-driven manufacturing activity. Meanwhile, Retail Sales rose 0.9% YoY, undershooting forecasts of 1.2% and November’s 1.3%.
- Australia’s TD-MI Inflation Gauge, released on Monday, rose to 3.5% year-over-year (YoY) in December, up from 3.2% previously. On a monthly basis, inflation surged 1.0% month-over-month (MoM) in December 2025, the fastest pace since December 2023 and a sharp acceleration from 0.3% in the prior two months.
- RBA policymakers acknowledged that inflation has eased significantly from its 2022 peak, though recent data suggests renewed upward momentum. Headline CPI slowed to 3.4% YoY in November, the lowest reading since August, but remains above the RBA’s 2–3% target band. Meanwhile, trimmed mean CPI edged down to 3.2% from October’s eight-month high of 3.3%.
- The RBA assessed that inflation risks have modestly tilted to the upside, while downside risks, particularly from global conditions, have diminished. Board members expect only one additional rate cut this year, with underlying inflation projected to remain above 3% in the near term before easing to around 2.6% by 2027.
Australian Dollar tests 0.6800 barrier near upper ascending channel boundary
The AUD/USD pair is trading around 0.6790 on Thursday. Daily chart analysis indicates that the pair is rising within the ascending channel pattern, indicating the persistent bullish bias. Moreover, the nine-day Exponential Moving Average (EMA) rises above the 50-day EMA, with spot holding above both and reinforcing a bullish tone. This alignment keeps upside pressure in place. The 14-day Relative Strength Index (RSI) at 69.93 sits near overbought, signaling stretched momentum.
The AUD/USD pair is testing the immediate resistance at the psychological level of 0.6800, followed by the upper boundary of the ascending channel around 0.6810. Further advances above the channel would expose 0.6942, the highest level since February 2023.
On the downside, the primary support lies at the nine-day EMA at 0.6732. A break below the short-term average would weaken the price momentum to target the lower ascending channel boundary at 0.6680, followed by the 50-day EMA of 0.6656.

Australian Dollar Price Today
The table below shows the percentage change of Australian Dollar (AUD) against listed major currencies today. Australian Dollar was the strongest against the Japanese Yen.
| USD | EUR | GBP | JPY | CAD | AUD | NZD | CHF | |
|---|---|---|---|---|---|---|---|---|
| USD | -0.00% | -0.04% | 0.06% | -0.05% | -0.55% | -0.22% | -0.01% | |
| EUR | 0.00% | -0.04% | 0.07% | -0.05% | -0.55% | -0.22% | -0.01% | |
| GBP | 0.04% | 0.04% | 0.11% | -0.02% | -0.51% | -0.19% | 0.02% | |
| JPY | -0.06% | -0.07% | -0.11% | -0.10% | -0.58% | -0.29% | -0.05% | |
| CAD | 0.05% | 0.05% | 0.02% | 0.10% | -0.48% | -0.17% | 0.04% | |
| AUD | 0.55% | 0.55% | 0.51% | 0.58% | 0.48% | 0.33% | 0.54% | |
| NZD | 0.22% | 0.22% | 0.19% | 0.29% | 0.17% | -0.33% | 0.21% | |
| CHF | 0.01% | 0.01% | -0.02% | 0.05% | -0.04% | -0.54% | -0.21% |
The heat map shows percentage changes of major currencies against each other. The base currency is picked from the left column, while the quote currency is picked from the top row. For example, if you pick the Australian Dollar from the left column and move along the horizontal line to the US Dollar, the percentage change displayed in the box will represent AUD (base)/USD (quote).
Economic Indicator
Employment Change s.a.
The Employment Change released by the Australian Bureau of Statistics is a measure of the change in the number of employed people in Australia. The statistic is adjusted to remove the influence of seasonal trends. Generally speaking, a rise in Employment Change has positive implications for consumer spending, stimulates economic growth, and is bullish for the Australian Dollar (AUD). A low reading, on the other hand, is seen as bearish.
Australia Westpac Leading Index (MoM) climbed from previous -0.04% to 0.1% in December
Gold pushed its rally further on Wednesday, hitting a fresh all-time high near $4,900 per troy ounce earlier in the session. Risk appetite remains fragile, with investors staying cautious after President Trump delivered his speech in Davos, while EU–US tensions over the Greenland issue continue to simmer.
Forex Today: Markets on the verge as Trump chaos revolves around the same

Here is what you need to know on Thursday, December 22:
United States (US) President Donald Trump was once again the main market mover on Wednesday, saying they are seeking immediate talks with Europe on Greenland. He added Greenland would not be a threat to NATO if the territory were under US control. He also said that he wouldn’t use excessive force, only to later say he would bring back battleships and that he wouldn’t defend Greenland on a lease when speaking at the World Economic Forum in Davos.
President Trump also referred to the US economy. Among other things, he said that inflation has been defeated, that they can now have nuclear energy at good prices and safely, and that he intends to raise living standards. Nevertheless, relief hit markets after Trump said the US does not want to use excessive force to obtain Greenland. Stocks and the US Dollar (USD) recovered while bonds eased.
The US Dollar Index (DXY) is trading near the 98.60 price zone, trying to claw back some ground after slipping to a one-week low amid persistent uncertainty following the wild Trump speech.
US Dollar Price Today
The table below shows the percentage change of US Dollar (USD) against listed major currencies today. US Dollar was the strongest against the Swiss Franc.
| USD | EUR | GBP | JPY | CAD | AUD | NZD | CHF | |
|---|---|---|---|---|---|---|---|---|
| USD | 0.18% | 0.09% | -0.03% | -0.04% | -0.28% | -0.15% | 0.42% | |
| EUR | -0.18% | -0.09% | -0.20% | -0.21% | -0.45% | -0.32% | 0.24% | |
| GBP | -0.09% | 0.09% | -0.13% | -0.13% | -0.37% | -0.24% | 0.33% | |
| JPY | 0.03% | 0.20% | 0.13% | -0.01% | -0.25% | -0.13% | 0.45% | |
| CAD | 0.04% | 0.21% | 0.13% | 0.01% | -0.24% | -0.12% | 0.46% | |
| AUD | 0.28% | 0.45% | 0.37% | 0.25% | 0.24% | 0.13% | 0.70% | |
| NZD | 0.15% | 0.32% | 0.24% | 0.13% | 0.12% | -0.13% | 0.57% | |
| CHF | -0.42% | -0.24% | -0.33% | -0.45% | -0.46% | -0.70% | -0.57% |
The heat map shows percentage changes of major currencies against each other. The base currency is picked from the left column, while the quote currency is picked from the top row. For example, if you pick the US Dollar from the left column and move along the horizontal line to the Japanese Yen, the percentage change displayed in the box will represent USD (base)/JPY (quote).
EUR/USD is trading near the 1.1700 level, cutting back a big chunk of its weekly gains while losing all of its intraday gains, now siding towards bearish.
AUD/USD traded at levels not seen since Oct 2024, with the high posted in the 0.6770 price zone, as the Australian Dollar (AUD) kept rising against a pressured USD.
GBP/USD trades flat on the day near the 1.3430 price zone, trimming some of its earlier sessions’ gains as the USD regains some traction. The United Kingdom (UK) published the December inflation data, which came in line with the market expectations. The annual reading ticked modestly higher to 3.4% from 3.2% in November and above the 3.3% expected.
USD/JPY saw little movement throughout the day, trading close to the 158.10 level and staying on the green side on a weekly view.
GOLD neared $4,890 before changing course and is now trading in the $4,810 region.
Gold FAQs
Gold has played a key role in human’s history as it has been widely used as a store of value and medium of exchange. Currently, apart from its shine and usage for jewelry, the precious metal is widely seen as a safe-haven asset, meaning that it is considered a good investment during turbulent times. Gold is also widely seen as a hedge against inflation and against depreciating currencies as it doesn’t rely on any specific issuer or government.
Central banks are the biggest Gold holders. In their aim to support their currencies in turbulent times, central banks tend to diversify their reserves and buy Gold to improve the perceived strength of the economy and the currency. High Gold reserves can be a source of trust for a country’s solvency. Central banks added 1,136 tonnes of Gold worth around $70 billion to their reserves in 2022, according to data from the World Gold Council. This is the highest yearly purchase since records began. Central banks from emerging economies such as China, India and Turkey are quickly increasing their Gold reserves.
Gold has an inverse correlation with the US Dollar and US Treasuries, which are both major reserve and safe-haven assets. When the Dollar depreciates, Gold tends to rise, enabling investors and central banks to diversify their assets in turbulent times. Gold is also inversely correlated with risk assets. A rally in the stock market tends to weaken Gold price, while sell-offs in riskier markets tend to favor the precious metal.
The price can move due to a wide range of factors. Geopolitical instability or fears of a deep recession can quickly make Gold price escalate due to its safe-haven status. As a yield-less asset, Gold tends to rise with lower interest rates, while higher cost of money usually weighs down on the yellow metal. Still, most moves depend on how the US Dollar (USD) behaves as the asset is priced in dollars (XAU/USD). A strong Dollar tends to keep the price of Gold controlled, whereas a weaker Dollar is likely to push Gold prices up.
Coming up next:
- Australian employment data will be released early Thursday.
- US GDP and PCE will be printed alongside Initial Jobless Claims in the American session on Thursday.
- New Zealand CPI will be released early Friday.
- The BoJ interest rate decision and monetary policy decisions alongside UK Retail Sales, Germany, and the Eurozone HCOB PMIs and UK S&P PMIs will be released on Friday.
US President Trump at WEF in Davos: Europe not heading in right direction
US President Donald Trump delivers a keynote speech at the World Economic Forum (WEF) held in Davos.

US President Trump speech key takeaways
“You all follow us down and you’ll follow us up.”
“Certain places in Europe not recognizable any more.”
“Europe is not heading in the right direction.”
“Green energy focus, mass migration has hurt Europe.”
This section below was published as a preview of US President Donald Trump’s speech at the World Economic Forum (WEF) at 10:00 GMT.
United States (US) President Donald Trump is scheduled to deliver a keynote speech at the World Economic Forum (WEF) held in Davos at 13:30 GMT. The speech is expected to start on time despite Trump’s trip to Davos being delayed as Air Force One was forced to turn around due to a “minor electrical issue”.
Trump’s speech will be closely watched by financial market participants as it will indicate what other measures the White House has at its disposal to intensify pressure on European Union (EU) members, who oppose Washington’s plans to acquire Greenland.
Greenland’s Prime Minister (PM) Jens-Frederik Nielsen has clarified in a joint statement with Denmark’s Mette Frederiksen that his economy prefers to remain a semi-autonomous Danish territory.
So far, President Trump has imposed 10% tariffs on several EU members: France, Germany, Denmark, Norway, Sweden, the Netherlands and Finland, and the United Kingdom (UK), which will become effective from February 1, for opposing US control of Greenland, and warned that additional duties could rise to 25% from the summer if no deal is done.
In response, EU members have warned of proportionate countermeasures against Trump’s tariff threats, calling them “blackmail”. French President Emmanuel Macron has stressed the need to deploy an anti-coercion tool, nicknamed a “trade bazooka”, in retaliation to Trump’s tariff threats. In the WEF on Tuesday, Macron said that the world is reaching a time of “instability and imbalances,” and the answer is “more cooperation,” not a system that accepts “the law of the strongest”, The New York Times (YT) reported.
Officials across the globe have also criticized Washington’s additional tariff threats. Canadian Prime Minister Mark Carney affirmed support for EU members, citing “Middle powers must act together because if we’re not at the table, we’re on the menu”, BBC reported.
How could Trump’s speech affect EUR/USD?
Signs from US President Trump’s comments signaling that Washington intends to acquire Greenland, even forcefully, and will keep the option of military action on the table, would be unfavorable for the US Dollar. Such a scenario could escalate tensions between the world’s largest economies, potentially leading to a trade war. On the contrary, Trump’s gentle comments on the Greenland crisis would ease geopolitical tensions, boosting hopes of improvement in the appeal of risky assets, the US Dollar, and US assets.
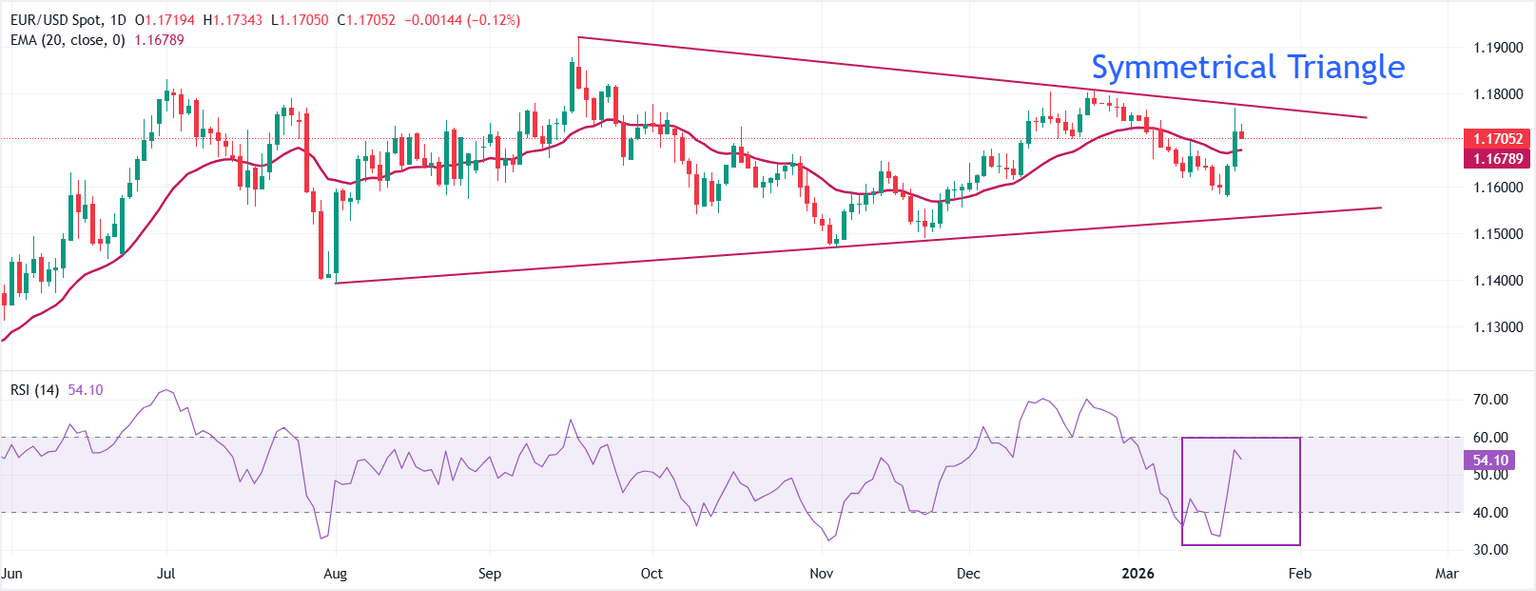
EUR/USD trades lower at around 1.1700 as of writing. The 20-day Exponential Moving Average (EMA) at 1.1679 edges higher beneath spot, supporting the short-term bias. A pullback would be expected to find initial demand around this dynamic level.
The 14-day Relative Strength Index (RSI) at 54 is neutral-to-firm, consistent with a measured upside impulse. A descending trend line from 1.1921 caps advances, with resistance at 1.1775. A daily close through this barrier could extend gains.
The rising trend line from 1.1393 underpins the broader structure, offering support near 1.1533. Failure to clear 1.1775 would keep rallies capped and leave scope for consolidation above the trend base. A sustained push beyond the descending barrier would shift focus higher, whereas holding below it would preserve a rangebound tone.
(The technical analysis of this story was written with the help of an AI tool.)
US Dollar FAQs
The US Dollar (USD) is the official currency of the United States of America, and the ‘de facto’ currency of a significant number of other countries where it is found in circulation alongside local notes. It is the most heavily traded currency in the world, accounting for over 88% of all global foreign exchange turnover, or an average of $6.6 trillion in transactions per day, according to data from 2022.
Following the second world war, the USD took over from the British Pound as the world’s reserve currency. For most of its history, the US Dollar was backed by Gold, until the Bretton Woods Agreement in 1971 when the Gold Standard went away.
The most important single factor impacting on the value of the US Dollar is monetary policy, which is shaped by the Federal Reserve (Fed). The Fed has two mandates: to achieve price stability (control inflation) and foster full employment. Its primary tool to achieve these two goals is by adjusting interest rates.
When prices are rising too quickly and inflation is above the Fed’s 2% target, the Fed will raise rates, which helps the USD value. When inflation falls below 2% or the Unemployment Rate is too high, the Fed may lower interest rates, which weighs on the Greenback.
In extreme situations, the Federal Reserve can also print more Dollars and enact quantitative easing (QE). QE is the process by which the Fed substantially increases the flow of credit in a stuck financial system.
It is a non-standard policy measure used when credit has dried up because banks will not lend to each other (out of the fear of counterparty default). It is a last resort when simply lowering interest rates is unlikely to achieve the necessary result. It was the Fed’s weapon of choice to combat the credit crunch that occurred during the Great Financial Crisis in 2008. It involves the Fed printing more Dollars and using them to buy US government bonds predominantly from financial institutions. QE usually leads to a weaker US Dollar.
Quantitative tightening (QT) is the reverse process whereby the Federal Reserve stops buying bonds from financial institutions and does not reinvest the principal from the bonds it holds maturing in new purchases. It is usually positive for the US Dollar.
EUR/USD Forecast: Bulls hesitate as focus shifts to Trump
Following a two-day rally that lifted EUR/USD to a fresh three-week high above 1.1750, the pair corrects lower toward 1.1700 in the European session on Wednesday. Investors adopt a cautious stance as they await US President Donald Trump’s speech at the World Economic Forum in Davos.
US Dollar Price This week
The table below shows the percentage change of US Dollar (USD) against listed major currencies this week. US Dollar was the weakest against the New Zealand Dollar.
| USD | EUR | GBP | JPY | CAD | AUD | NZD | CHF | |
|---|---|---|---|---|---|---|---|---|
| USD | -1.09% | -0.60% | 0.09% | -0.57% | -1.19% | -1.78% | -1.13% | |
| EUR | 1.09% | 0.50% | 1.15% | 0.52% | -0.11% | -0.70% | -0.05% | |
| GBP | 0.60% | -0.50% | 0.42% | 0.02% | -0.60% | -1.20% | -0.54% | |
| JPY | -0.09% | -1.15% | -0.42% | -0.63% | -1.24% | -1.82% | -1.17% | |
| CAD | 0.57% | -0.52% | -0.02% | 0.63% | -0.60% | -1.20% | -0.56% | |
| AUD | 1.19% | 0.11% | 0.60% | 1.24% | 0.60% | -0.60% | 0.06% | |
| NZD | 1.78% | 0.70% | 1.20% | 1.82% | 1.20% | 0.60% | 0.66% | |
| CHF | 1.13% | 0.05% | 0.54% | 1.17% | 0.56% | -0.06% | -0.66% |
The heat map shows percentage changes of major currencies against each other. The base currency is picked from the left column, while the quote currency is picked from the top row. For example, if you pick the US Dollar from the left column and move along the horizontal line to the Japanese Yen, the percentage change displayed in the box will represent USD (base)/JPY (quote).
In the absence of high-impact data releases, the risk-averse market atmosphere made it difficult for EUR/USD to preserve its bullish momentum in the American session. Wall Street’s main indexes opened lower and ended the day deep in negative territory after returnig from a long weekend.
Early Wednesday, European Central Bank (ECB) President Christine Lagarde argued that there would be a a slight inflationary effect if the US raises tariffs on European imports. She explained that they could see a stronger impact on Germany than on France, adding that European countries would be much stronger if they scrapped non-tariff trade barriers within the bloc.
US President Trump is expected to comment on the Greenland issue and how it could impact the EU-US relations. In case Trump reiterates his intentions to use tariffs against European nations that oppose the purchase of Greenland, safe-haven flows could continue to dominate the financial markets. However, the market action seen since the beginning of the week suggests that the US Dollar could have a hard time attracting safe-haven demand, especially if investors see Trump’s aggressive trade regime as more harmful to the US economy than Europe.
EUR/USD Technical Analysis:
In the 4-hour chart, EUR/USD trades at 1.1710. The 20-period Simple Moving Average (SMA) has turned higher above the 50 SMA, while both remain beneath the declining 100 SMA and the mildly rising 200 SMA. Price holds above all these averages, underscoring an improving near-term tone. The Relative Strength Index (RSI) prints at 63 (positive), easing from earlier overbought readings and supporting bullish momentum without being stretched.
Measured from the 1.1800 high to the 1.1592 low, the 50% retracement aligns as the first support level near 1.1700, which is also reinforced by the 200-period SMA, ahead of 1.1685 (100-period SMA) and 1.1670 (Fibonacci 38.2% retracement). On the upside, the 61.8% retracement at 1.1721 acts as immediate resistance ahead of 1.1755 (78.6% retracement)
(The technical analysis of this story was written with the help of an AI tool.)
Euro FAQs
The Euro is the currency for the 20 European Union countries that belong to the Eurozone. It is the second most heavily traded currency in the world behind the US Dollar. In 2022, it accounted for 31% of all foreign exchange transactions, with an average daily turnover of over $2.2 trillion a day.
EUR/USD is the most heavily traded currency pair in the world, accounting for an estimated 30% off all transactions, followed by EUR/JPY (4%), EUR/GBP (3%) and EUR/AUD (2%).
The European Central Bank (ECB) in Frankfurt, Germany, is the reserve bank for the Eurozone. The ECB sets interest rates and manages monetary policy.
The ECB’s primary mandate is to maintain price stability, which means either controlling inflation or stimulating growth. Its primary tool is the raising or lowering of interest rates. Relatively high interest rates – or the expectation of higher rates – will usually benefit the Euro and vice versa.
The ECB Governing Council makes monetary policy decisions at meetings held eight times a year. Decisions are made by heads of the Eurozone national banks and six permanent members, including the President of the ECB, Christine Lagarde.
Eurozone inflation data, measured by the Harmonized Index of Consumer Prices (HICP), is an important econometric for the Euro. If inflation rises more than expected, especially if above the ECB’s 2% target, it obliges the ECB to raise interest rates to bring it back under control.
Relatively high interest rates compared to its counterparts will usually benefit the Euro, as it makes the region more attractive as a place for global investors to park their money.
Data releases gauge the health of the economy and can impact on the Euro. Indicators such as GDP, Manufacturing and Services PMIs, employment, and consumer sentiment surveys can all influence the direction of the single currency.
A strong economy is good for the Euro. Not only does it attract more foreign investment but it may encourage the ECB to put up interest rates, which will directly strengthen the Euro. Otherwise, if economic data is weak, the Euro is likely to fall.
Economic data for the four largest economies in the euro area (Germany, France, Italy and Spain) are especially significant, as they account for 75% of the Eurozone’s economy.
Another significant data release for the Euro is the Trade Balance. This indicator measures the difference between what a country earns from its exports and what it spends on imports over a given period.
If a country produces highly sought after exports then its currency will gain in value purely from the extra demand created from foreign buyers seeking to purchase these goods. Therefore, a positive net Trade Balance strengthens a currency and vice versa for a negative balance.
Japanese Yen bulls seem hesitant amid concerns about fiscal health, ahead of BoJ
The Japanese Yen (JPY) remains on the front foot against its American counterpart through the Asian session on Wednesday, although bulls seem hesitant amid mixed fundamental cues. Expectations that Japanese authorities would intervene to counter further weakness in the domestic currency act as a tailwind for the JPY. Adding to this, prospects for further policy tightening by the Bank of Japan (BoJ) and the prevalent risk-off mood offer some support to the safe-haven JPY.
The JPY, however, struggles to gain any meaningful traction as traders opt to wait for the outcome of a two-day BoJ meeting on Friday, for more cues about the timing of the next rate hike. In the meantime, this week’s slump in Japanese government bonds (JGB), led by concerns about Japan’s fiscal health amid Prime Minister Sanae Takaichi’s expansionary policies, keeps a lid on the JPY. This, in turn, warrants caution before placing bullish bets around the USD/JPY pair.
Japanese Yen struggles to lure buyer as fiscal concerns offset supportive factors
- Japan’s Finance Minister Satsuki Katayama last week hinted at the possibility of joint intervention with the US to deal with the recent weakness in the Japanese Yen. This, along with hawkish Bank of Japan expectations and sustained safe-haven buying, assists the JPY to gain some positive traction during the Asian session on Wednesday.
- A Bank of Japan survey for December showed on Monday that most Japanese households expect prices to keep rising for the next few years. This comes on top of data released last Friday, which revealed that Japan’s inflation has averaged above the BoJ’s 2% target for four straight calendar years, and backs the case for further policy tightening.
- In fact, Reuters reported last week, citing sources, that some BoJ policymakers see scope to raise rates sooner than markets expect, with April a distinct possibility, as a sliding JPY risks adding to already broadening inflationary pressure. Moreover, concerns about Japan’s worsening finances led to a sharp rise in the Japanese government bond yields.
- On Monday, Japan’s Prime Minister Sanae Takaichi announced plans to hold a snap election in February. With Takaichi’s popularity running high, a strong majority for the ruling Liberal Democratic Party (LDP) in the lower house would give her more freedom to pursue her agenda and heighten the chance of more spending and tax cuts after the election.
- Investors gave a thumbs down to Takaichi’s fiscal policies, pushing the yield on the 40-year JGB to a fresh high since its debut in 2007. Adding to this, a fall in demand at the 20-year debt auction opened the floodgates, sending yields into uncharted territory amid a broader selloff in government bonds. This could keep a lid on further JPY gains.
- The US Dollar, on the other hand, struggles to capitalize on the overnight bounce from a two-week low and remains under some selling pressure for the third straight day as renewed trade war fears have revived the ‘Sell America’ trade. This further weighs on the USD/JPY pair, though traders seem reluctant ahead of a two-day BoJ meeting.
- After raising the overnight interest rate last month to 0.75%, or the highest in 30 years, the BoJ is expected to maintain the status quo on Friday. The focus, meanwhile, remains glued to BoJ Governor Kazuo Ueda’s comments during the post-decision press conference on Friday, which will be looked for cues about the timing of the next rate hike.
- Heading into the key central bank event risk, traders will confront the release of the US Personal Consumption Expenditure (PCE) Price Index on Thursday. This will be accompanied by the final US Q3 GDP growth report and offer cues about the US Federal Reserve’s rate-cut path, which will drive the USD and influence the USD/JPY pair.
USD/JPY bears have the upper hand while below the 100-hour SMA
The 100-period Simple Moving Average (SMA) slopes lower at 158.17, with the USD/JPY pair holding beneath it, keeping a bearish intraday bias. A recovery above this SMA would ease downside pressure. The Moving Average Convergence Divergence (MACD) and its Signal line are clustered around the zero mark, and a flat histogram suggests limited momentum. The Relative Strength Index (RSI) sits at 48 (neutral), offering little directional edge. Measured from the 159.46 high to the 157.41 low, the 38.2% Fibonacci retracement at 158.19, and the 50% retracement level at 158.43, cap initial rebounds.
While price trades below the 100 SMA, sellers retain the near-term advantage, and rallies would be capped by nearby resistance overhead. A decisive push above the average could open a path toward the next retracement barrier, whereas failure to reclaim it keeps pressure on the one-hour tone. The MACD would need to hold above zero to strengthen an upside reversal, and a turn back into negative territory would reinforce a sluggish backdrop. RSI edging toward 50 would help stabilize, but a drop back through the mid-40s would leave the bias soft.
(The technical analysis of this story was written with the help of an AI tool.)
Risk sentiment FAQs
In the world of financial jargon the two widely used terms “risk-on” and “risk off” refer to the level of risk that investors are willing to stomach during the period referenced. In a “risk-on” market, investors are optimistic about the future and more willing to buy risky assets. In a “risk-off” market investors start to ‘play it safe’ because they are worried about the future, and therefore buy less risky assets that are more certain of bringing a return, even if it is relatively modest.
Typically, during periods of “risk-on”, stock markets will rise, most commodities – except Gold – will also gain in value, since they benefit from a positive growth outlook. The currencies of nations that are heavy commodity exporters strengthen because of increased demand, and Cryptocurrencies rise. In a “risk-off” market, Bonds go up – especially major government Bonds – Gold shines, and safe-haven currencies such as the Japanese Yen, Swiss Franc and US Dollar all benefit.
The Australian Dollar (AUD), the Canadian Dollar (CAD), the New Zealand Dollar (NZD) and minor FX like the Ruble (RUB) and the South African Rand (ZAR), all tend to rise in markets that are “risk-on”. This is because the economies of these currencies are heavily reliant on commodity exports for growth, and commodities tend to rise in price during risk-on periods. This is because investors foresee greater demand for raw materials in the future due to heightened economic activity.
The major currencies that tend to rise during periods of “risk-off” are the US Dollar (USD), the Japanese Yen (JPY) and the Swiss Franc (CHF). The US Dollar, because it is the world’s reserve currency, and because in times of crisis investors buy US government debt, which is seen as safe because the largest economy in the world is unlikely to default. The Yen, from increased demand for Japanese government bonds, because a high proportion are held by domestic investors who are unlikely to dump them – even in a crisis. The Swiss Franc, because strict Swiss banking laws offer investors enhanced capital protection.
Gold and Silver surge to record highs as Bitcoin and Ethereum slide lower
Following geopolitical tensions surrounding the US proposed acquisition of Greenland, Gold and Silver have surged to record highs while Bitcoin and Ethereum — often considered digital alternatives to the two traditional metals — are crashing alongside US equities.
Gold (XAU/USD) surged to a record high above $4,750 on Tuesday, adding $15 trillion in market cap over the past twelve months. Silver (XAG/USD) also posted a fresh all-time high above $95, extending its run over the past year to about 210%. The two metals have been riding the demand for safe-haven assets amid the unpredictability of Trump’s actions.
Meanwhile, Bitcoin has declined 3.5% over the past 24 hours, sliding below $90,000. The top crypto has lost 6% of its value since the start of the week, sending its performance in the past year to -13%. In the same period, ETH has suffered a 10% downturn, falling below $3,000.
The decline has wiped out $1.6 billion in leveraged positions in the crypto market over the past three days, according to Coinglass data.
A similar decline is evident across the US equity market, where the S&P 500 fell over 2% on Tuesday, wiping out $1.2 trillion in market cap, its largest decline since October. The Nasdaq also fell 2.3%.
Once considered a safe-haven asset, Bitcoin has been behaving more like equities in recent times. Moreover, over the past year, it underperformed the Nasdaq during uptrends but reclaimed its high beta during downtrends.
Bitcoin holds a good record against Gold over a longer time frame
Despite its underperformance over the past year, Bloomberg analyst, Eric Balchunas, noted that Bitcoin is only taking a “breather.”
“…Bitcoin was up 122% in 2024, $GLD and $SLV were up 20%. It got ahead of itself, needed breather, other assets just playing catch up,” wrote Balchunas in an X post on Tuesday.
Bitcoin Magazine highlighted a similar trend, stating that Bitcoin outperformed Gold over a three-year period when dollar-cost averaging is considered.
BTC vs. Gold vs. AAPL vs. DJI. Source: Bitcoin Magazine
In contrast, Bitcoin analyst PlanB said a combination of both assets — an 80% Gold and 20% BTC allocation — will deliver higher returns while reducing risk.

Meanwhile, some analysts predict that investors will rotate some of the gains seen in Gold and Silver into Bitcoin over the coming months.