Gold retreated sharply from the $4,400 area and trades flat for the day in the $4,320 price zone. Choppy trading conditions exacerbated the intraday decline, although XAU/USD bearish case is out of the picture, considering growing expectations for a dovish Fed and persistent geopolitical tensions.
Dow Jones Industrial Average holds steady as 2026 begins with mixed market trends
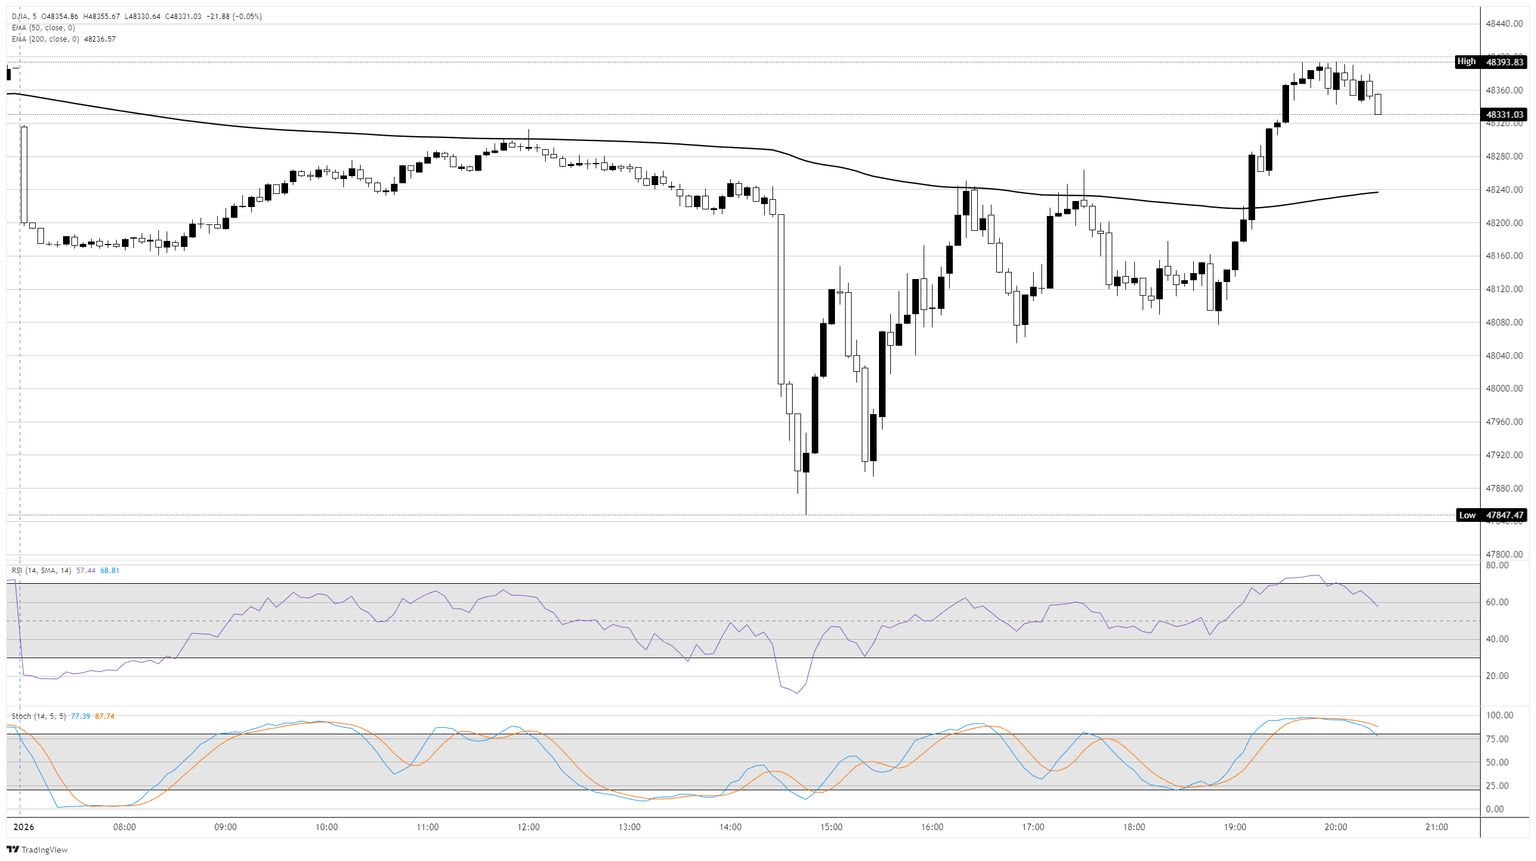
US equities opened 2026 on a cautious note, with the S&P 500 and Nasdaq essentially flat as strength in semiconductors offset weakness elsewhere in technology. The Dow Jones found some footing on Friday after an early plunge through the overnight session, holding steady near where the first trading day of 2026 started.
Looking ahead, Wall Street strategists remain broadly bullish on US equities through 2026. The latest CNBC strategist survey points to an average S&P 500 target of 7,629, implying double-digit upside for the year. Some strategists expect market leadership to broaden beyond mega-cap technology, with rotation into regional banks and other non-tech sectors, while select richly valued tech names could lag.
Semiconductors steady markets after 2025 tech splurge
Chipmakers such as Nvidia (NVDA) and Micron (MU) advanced, extending momentum from a powerful 2025 driven by artificial intelligence spending, while software names including Salesforce (CRM) and CrowdStrike (CRWD) declined. Tesla (TSLA) also weighed on sentiment after reporting fourth-quarter deliveries well below expectations. Despite the subdued start to the year, 2025 closed with strong gains across major benchmarks, as the S&P 500 rose more than 16%, the Nasdaq climbed over 20%, and the Dow added roughly 13%, all reaching record highs through the year.
Tariff pause sparks relief rally in furniture stocks
Outside of technology, furniture and home goods stocks stood out after US President Donald Trump delayed planned tariff increases on upholstered furniture, kitchen cabinets, and vanities for one year. Wayfair (W), RH, and Williams-Sonoma (WSM) all rallied as investors reassessed cost pressures tied to trade policy. The tariff pause follows a sharp divergence within the sector in 2025, when value-oriented retailers surged while higher-end brands struggled amid sourcing concerns and volatile demand.
On the economic front, US manufacturing activity cooled modestly in December as new orders slowed, according to the S&P Global Purchasing Managers Index (PMI) survey results. December’s Manufacturing PMI remained in expansion territory, while job creation accelerated to its fastest pace since August and price pressures eased, suggesting a mixed but otherwise stable backdrop for growth.
Fed and corporate leadership transitions loom large over 2026
Federal Reserve (Fed) leadership is emerging as a key uncertainty for markets this year. Fed Chair Jerome Powell has declined to say whether he will remain on the Fed’s board when his term as chair ends in May, fueling debate about the future balance of power within the central bank. If Powell steps down entirely, President Trump would gain immediate influence over a majority of the Federal Open Market Committee (FOMC), potentially reshaping monetary policy direction. Most Fed observers expect Powell to leave, citing institutional precedent and concerns about politicizing the central bank, though the decision remains unresolved and closely watched.
In corporate leadership news, Warren Buffett formally handed the CEO role at Berkshire Hathaway (BRK) to Greg Abel, ending a six-decade tenure that transformed the company into a trillion-dollar conglomerate. Buffett expressed strong confidence in Abel’s leadership and capital allocation skills, even as Berkshire shares have lagged since the succession announcement amid investor questions about the post-Buffett era. Buffett emphasized the company’s long-term durability, underscoring Berkshire’s deep cash reserves and diversified business mix as it enters a new chapter.
Dow Jones 5-minute chart
Dow Jones FAQs
The Dow Jones Industrial Average, one of the oldest stock market indices in the world, is compiled of the 30 most traded stocks in the US. The index is price-weighted rather than weighted by capitalization. It is calculated by summing the prices of the constituent stocks and dividing them by a factor, currently 0.152. The index was founded by Charles Dow, who also founded the Wall Street Journal. In later years it has been criticized for not being broadly representative enough because it only tracks 30 conglomerates, unlike broader indices such as the S&P 500.
Many different factors drive the Dow Jones Industrial Average (DJIA). The aggregate performance of the component companies revealed in quarterly company earnings reports is the main one. US and global macroeconomic data also contributes as it impacts on investor sentiment. The level of interest rates, set by the Federal Reserve (Fed), also influences the DJIA as it affects the cost of credit, on which many corporations are heavily reliant. Therefore, inflation can be a major driver as well as other metrics which impact the Fed decisions.
Dow Theory is a method for identifying the primary trend of the stock market developed by Charles Dow. A key step is to compare the direction of the Dow Jones Industrial Average (DJIA) and the Dow Jones Transportation Average (DJTA) and only follow trends where both are moving in the same direction. Volume is a confirmatory criteria. The theory uses elements of peak and trough analysis. Dow’s theory posits three trend phases: accumulation, when smart money starts buying or selling; public participation, when the wider public joins in; and distribution, when the smart money exits.
There are a number of ways to trade the DJIA. One is to use ETFs which allow investors to trade the DJIA as a single security, rather than having to buy shares in all 30 constituent companies. A leading example is the SPDR Dow Jones Industrial Average ETF (DIA). DJIA futures contracts enable traders to speculate on the future value of the index and Options provide the right, but not the obligation, to buy or sell the index at a predetermined price in the future. Mutual funds enable investors to buy a share of a diversified portfolio of DJIA stocks thus providing exposure to the overall index.
Source
Ethereum Price Forecast: Accumulation addresses post record inflows in December despite high selling pressure
Ethereum (ETH) accumulation addresses recorded their highest monthly inflow in December 2025 as the year came to a close. Despite the weak market momentum following the holidays, these wallets doubled down on their buying pressure, adding 3.62 million ETH to their cumulative balance. That figure is higher than its record 2.94 million ETH inflow in November.
-1767381629098-1767381629105.png&w=1536&q=95)
Accumulation addresses are wallets with no record of selling activity, often dominated by new addresses and long-term holders.
Despite the buying pressure from accumulation addresses, ETH’s exchange reserves rose by nearly 480,000 ETH — their largest increase since June. An increase in exchange reserves signals higher selling pressure. The distribution is likely driven by year-end tax-loss-related selling, which will likely reduce with the year-end, according to BitMine’s Thomas Lee in a Monday statement.
Validator entry queue flips upward as BitMine begins staking
Meanwhile, Ethereum’s validator entry queue has flipped upward after nearly two months in a downtrend. The amount of ETH in the queue has increased by about 120% from a low of 410,938 ETH on December 28 to 904,051 ETH on Friday, indicating more investors are committing their assets to secure the network.
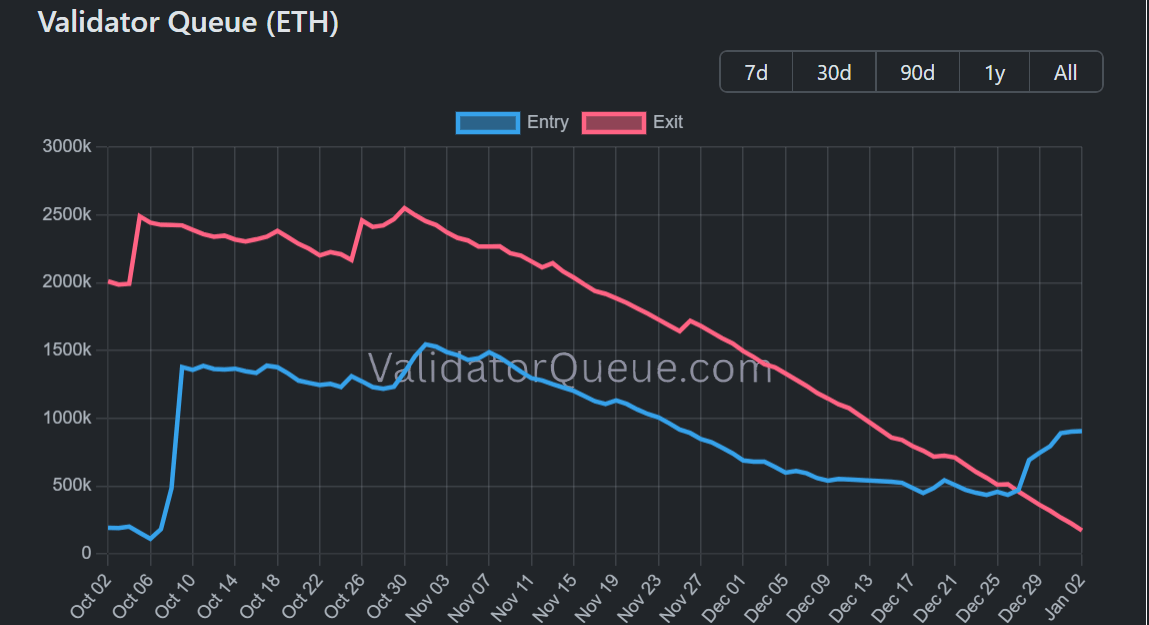
The spike follows BitMine’s latest update that it has begun staking portions of its ETH stash. The Ethereum treasury firm holds about 4.11 million ETH, worth over $12.8 billion at the time of publication.
Ethereum Price Forecast: ETH breaks out of descending triangle, tests $3,150-$3,250 resistance range
Ethereum saw $121.3 million in liquidations over the past 24 hours, driven by $111.9 million in short liquidations, according to Coinglass data.
ETH has crossed above the upper boundary of a descending triangle and is testing the 50-day Exponential Moving Average (EMA) after several days of sideways movement. The top altcoin could extend its upward move toward $3,470 if it clears the $3,150-$3,250 resistance range.
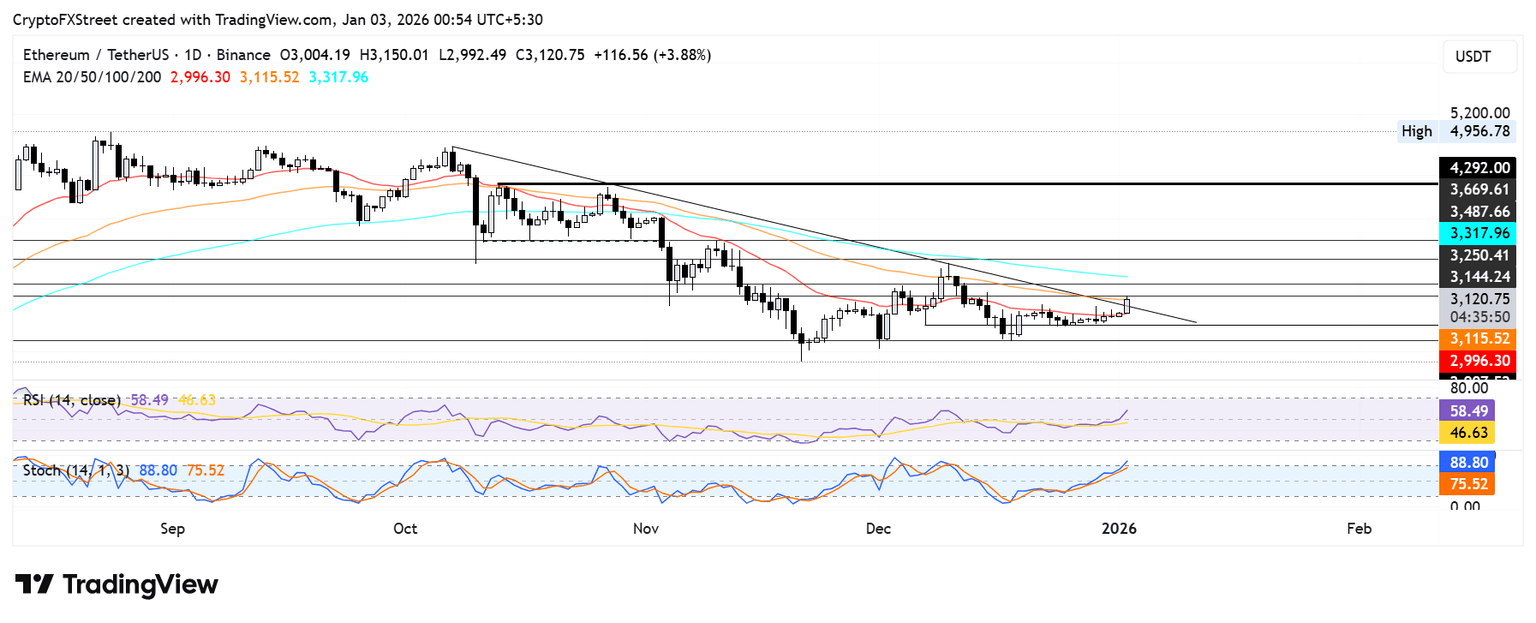
On the downside, ETH could bounce at the $2,900 support level if it sees a rejection near $3,150.
The Relative Strength Index (RSI) is above its neutral level, while the Stochastic Oscillator (Stoch) is in overbought territory, indicating a dominant bullish momentum.
Forecasting the upcoming week: Markets enter the new year calmly, US Dollar stable ahead of key data

Financial markets extend the holiday mood on the first trading day of the new year. Markets continue playing the waiting game for a data-driven next week.
The US Dollar Index (DXY) is trading near the 98.40 price region on Friday, trimming a big chunk of its New Year losses.
US Dollar Price Today
The table below shows the percentage change of US Dollar (USD) against listed major currencies today. US Dollar was the strongest against the Canadian Dollar.
| USD | EUR | GBP | JPY | CAD | AUD | NZD | CHF | |
|---|---|---|---|---|---|---|---|---|
| USD | -0.02% | -0.19% | -0.16% | 0.03% | -0.18% | -0.28% | -0.36% | |
| EUR | 0.02% | -0.21% | -0.04% | 0.15% | -0.11% | -0.15% | -0.24% | |
| GBP | 0.19% | 0.21% | 0.15% | 0.32% | 0.09% | 0.05% | -0.03% | |
| JPY | 0.16% | 0.04% | -0.15% | 0.09% | -0.15% | -0.17% | -0.19% | |
| CAD | -0.03% | -0.15% | -0.32% | -0.09% | -0.25% | -0.27% | -0.39% | |
| AUD | 0.18% | 0.11% | -0.09% | 0.15% | 0.25% | -0.04% | -0.12% | |
| NZD | 0.28% | 0.15% | -0.05% | 0.17% | 0.27% | 0.04% | -0.08% | |
| CHF | 0.36% | 0.24% | 0.03% | 0.19% | 0.39% | 0.12% | 0.08% |
The heat map shows percentage changes of major currencies against each other. The base currency is picked from the left column, while the quote currency is picked from the top row. For example, if you pick the US Dollar from the left column and move along the horizontal line to the Japanese Yen, the percentage change displayed in the box will represent USD (base)/JPY (quote).
Gold (XAU/USD) trades around the $4,320 level, losing all of its intraday gains after the New Year’s break. Market expectations of lower interest rates in the United States (US) and rising geopolitical tensions have underpinned precious metals over the last few sessions.
EUR/USD hovers around 1.1740 after edging lower in the first half of the week. The pair remains under pressure as it awaits the upcoming data.
GBP/USD is trading near the 1.3480 price region, little changed in the first American session of the year.
USD/JPY is trading near the 156.50 price region, in negative territory, with little intraday change.
AUD/USD is trading close to the 0.6690 area, posting a small advance after trimming almost half of its intraday gains on Friday.
Central banks FAQs
Central Banks have a key mandate which is making sure that there is price stability in a country or region. Economies are constantly facing inflation or deflation when prices for certain goods and services are fluctuating. Constant rising prices for the same goods means inflation, constant lowered prices for the same goods means deflation. It is the task of the central bank to keep the demand in line by tweaking its policy rate. For the biggest central banks like the US Federal Reserve (Fed), the European Central Bank (ECB) or the Bank of England (BoE), the mandate is to keep inflation close to 2%.
A central bank has one important tool at its disposal to get inflation higher or lower, and that is by tweaking its benchmark policy rate, commonly known as interest rate. On pre-communicated moments, the central bank will issue a statement with its policy rate and provide additional reasoning on why it is either remaining or changing (cutting or hiking) it. Local banks will adjust their savings and lending rates accordingly, which in turn will make it either harder or easier for people to earn on their savings or for companies to take out loans and make investments in their businesses. When the central bank hikes interest rates substantially, this is called monetary tightening. When it is cutting its benchmark rate, it is called monetary easing.
A central bank is often politically independent. Members of the central bank policy board are passing through a series of panels and hearings before being appointed to a policy board seat. Each member in that board often has a certain conviction on how the central bank should control inflation and the subsequent monetary policy. Members that want a very loose monetary policy, with low rates and cheap lending, to boost the economy substantially while being content to see inflation slightly above 2%, are called ‘doves’. Members that rather want to see higher rates to reward savings and want to keep a lit on inflation at all time are called ‘hawks’ and will not rest until inflation is at or just below 2%.
Normally, there is a chairman or president who leads each meeting, needs to create a consensus between the hawks or doves and has his or her final say when it would come down to a vote split to avoid a 50-50 tie on whether the current policy should be adjusted. The chairman will deliver speeches which often can be followed live, where the current monetary stance and outlook is being communicated. A central bank will try to push forward its monetary policy without triggering violent swings in rates, equities, or its currency. All members of the central bank will channel their stance toward the markets in advance of a policy meeting event. A few days before a policy meeting takes place until the new policy has been communicated, members are forbidden to talk publicly. This is called the blackout period.
Key economic data: Upcoming releases to shape market sentiment
Over the coming days, investors will focus on US employment data and global inflation figures, as they inform central banks’ decisions.
The US Institute for Supply Management (ISM) will publish the Manufacturing Purchasing Managers’ Index (PMI) for December on Monday.
Germany’s Harmonized Index of Consumer Prices (HICP) and the Australian Consumer Price Index (CPI) will be released on Tuesday.
The US ADP Employment Change report (December) and the ISM Services PMI (December) will be released on Wednesday, along with the Eurozone HICP (December preliminary).
The US Trade Balance (October) and Consumer Credit (November) will be released next Thursday.
Finally, the US Nonfarm Payrolls (NFP) report for December and the preliminary estimate of the January Michigan Consumer Sentiment Index will be released on January 9.
Canadian Dollar softens slightly amid tepid start to new year
The Canadian Dollar (CAD) hit a bit of a soft patch on Friday, kicking off the first trading day of 2026 on the back foot. The Loonie is one of the worst performers for the day, shedding weight against all but one of its major currency peers. Despite a steady note of overall weakness to open up the new trading year, the Canadian Dollar is still within near-term ranges as overall market momentum remains tepid coming out of the holiday window.
Canadian S&P Global Manufacturing Purchasing Managers Index (PMI) figures showed more of the same in December, with overall activity and output falling for an eleventh straight month. Tariffs remain the key thorn in Canadian business activity, with firms opting for lean operations and inventory management, keeping purchasing activity subdued. Tariffs remain the key pink elephant paradox for Canadian businesses, with apprehension keeping supply lines jittery and self-creating some inflationary pressures on input costs.
Daily digest market movers: Canadian Dollar eases slightly after PMIs confirm the usual
The Canadian Dollar lost a little over one-tenth of one percent against the US Dollar (USD) on Friday.
- The new trading year is now here, but overall market narratives remain largely the same.
- According to the latest Canadian S&P Global Manufacturing PMI, Canada’s manufacturing sector ended the year weakly, with falling output and orders, persistent tariff uncertainty weighing on confidence, firms cutting labor, inventories, and purchases, and rising input costs driven by ongoing supply chain delays and tariffs.
- The US Manufacturing PMI component also released on Friday, showing that tariff impacts continue to hit on both sides of the 49th parallel.
- US manufacturers boosted production in December, supporting late-2025 growth. However, with orders falling at the widest gap since the financial crisis, tariff-driven cost pressures squeezing demand, and payroll risks rising, current output levels look unsustainable heading into early 2026 despite some easing in input inflation.
- The first meaningful data dump that will kick off the USD/CAD trading year in earnest will be next week’s dual labor reports, with both the US and Canada slated to release their latest employment statistics on December 9.
Canadian Dollar price forecast
In the 5-minute chart, USD/CAD trades at 1.3740, above the day’s opening price by around 20 pips and up for the day. The 200-period EMA edges higher at 1.3725, with price holding above it and keeping the intraday bullish tone. Pullbacks are supported while spot stays over this average. RSI at 59.77 (neutral-bullish) is rising, aligning with improving short-term momentum. Stochastic near 68.61 continues to advance, leaving room before overbought.
Momentum remains supportive as buyers defend the rising average. A drop back under the 200-EMA would undermine the upmove and could trigger a deeper pullback. With RSI shy of the 70 threshold and Stochastic not yet in the 80 band, bulls could attempt to extend gains, though upside would slow if momentum stalls.
In the daily chart, USD/CAD trades at 1.3741. The pair remains below the falling 50-day EMA at 1.3849 and the 200-day EMA at 1.3891, keeping a bearish tone. The short-term average below the long-term one reinforces downside pressure. RSI at 40.9 (neutral) has bounced from oversold but stays under the 50 midline.
Stochastic at 42.7 has turned higher, backing scope for a corrective move. A recovery could stall at the 50-day EMA at 1.3849, while sustained weakness beneath the current level would leave risk of fresh lows. A decisive push through the short-term average would open the path toward the longer-term one; otherwise, sellers remain in control.
(The technical analysis of this story was written with the help of an AI tool)
USD/CAD 5-minute chart
US jobs report takes center stage next week – Deutsche Bank

The US jobs report will be the main economic release next week, with other US data including the ISM indices and consumer sentiment. Elsewhere, the focus will be on inflation in Europe and China, whilst wage data is due in Japan, Deutsche Bank’s economists report.
Europe and China inflation in focus
“In the US, the key event will be the December jobs report due Friday. Our US economists expect nonfarm payrolls to rise by +50k (+64k in November), with the unemployment rate falling slightly to 4.5% (4.6%), and the hourly earnings growth rising to +0.3% MoM (+0.1%). The ADP and JOLTS reports are also scheduled for Wednesday. Meanwhile, there are the ISM indices and our economics team forecast readings of 48.8 and 52.1, respectively. Other notable releases will be the University of Michigan’s consumer survey on Friday (DB forecast a 54.0 print, up from 52.9 in December) and Q3 unit labour costs on Thursday.”
“Moving on to Europe, the focus will be on the preliminary December CPIs in the Eurozone. Readings for Germany and France are due Tuesday, with a Eurozone-wide report due Wednesday. Outside of the bloc, consumer inflation prints are also due in Switzerland, Sweden and Norway. In Germany, other notable economic releases include factory orders on Thursday and industrial production and trade balance on Friday.”
“Rounding out with the economic calendar for Asia, highlights include CPI and PPI reports in China on Friday as well as wages in Japan on Wednesday.”
United States S&P Global Manufacturing PMI meets expectations (51.8) in December
Information on these pages contains forward-looking statements that involve risks and uncertainties. Markets and instruments profiled on this page are for informational purposes only and should not in any way come across as a recommendation to buy or sell in these assets. You should do your own thorough research before making any investment decisions. FXStreet does not in any way guarantee that this information is free from mistakes, errors, or material misstatements. It also does not guarantee that this information is of a timely nature. Investing in Open Markets involves a great deal of risk, including the loss of all or a portion of your investment, as well as emotional distress. All risks, losses and costs associated with investing, including total loss of principal, are your responsibility. The views and opinions expressed in this article are those of the authors and do not necessarily reflect the official policy or position of FXStreet nor its advertisers. The author will not be held responsible for information that is found at the end of links posted on this page.
If not otherwise explicitly mentioned in the body of the article, at the time of writing, the author has no position in any stock mentioned in this article and no business relationship with any company mentioned. The author has not received compensation for writing this article, other than from FXStreet.
FXStreet and the author do not provide personalized recommendations. The author makes no representations as to the accuracy, completeness, or suitability of this information. FXStreet and the author will not be liable for any errors, omissions or any losses, injuries or damages arising from this information and its display or use. Errors and omissions excepted.
The author and FXStreet are not registered investment advisors and nothing in this article is intended to be investment advice.
Canada S&P Global Manufacturing PMI climbed from previous 48.4 to 48.6 in December
Gold retreated sharply from the $4,400 area and trades flat for the day in the $4,320 price zone. Choppy trading conditions exacerbated the intraday decline, although XAU/USD bearish case is out of the picture, considering growing expectations for a dovish Fed and persistent geopolitical tensions.
Singapore Manufacturing PMI increased to 50.3 in December from previous 50.2
Gold retreated sharply from the $4,400 area and trades flat for the day in the $4,320 price zone. Choppy trading conditions exacerbated the intraday decline, although XAU/USD bearish case is out of the picture, considering growing expectations for a dovish Fed and persistent geopolitical tensions.
Brazil S&P Global Manufacturing PMI: 47.6 (December) vs previous 48.8
Gold retreated sharply from the $4,400 area and trades flat for the day in the $4,320 price zone. Choppy trading conditions exacerbated the intraday decline, although XAU/USD bearish case is out of the picture, considering growing expectations for a dovish Fed and persistent geopolitical tensions.