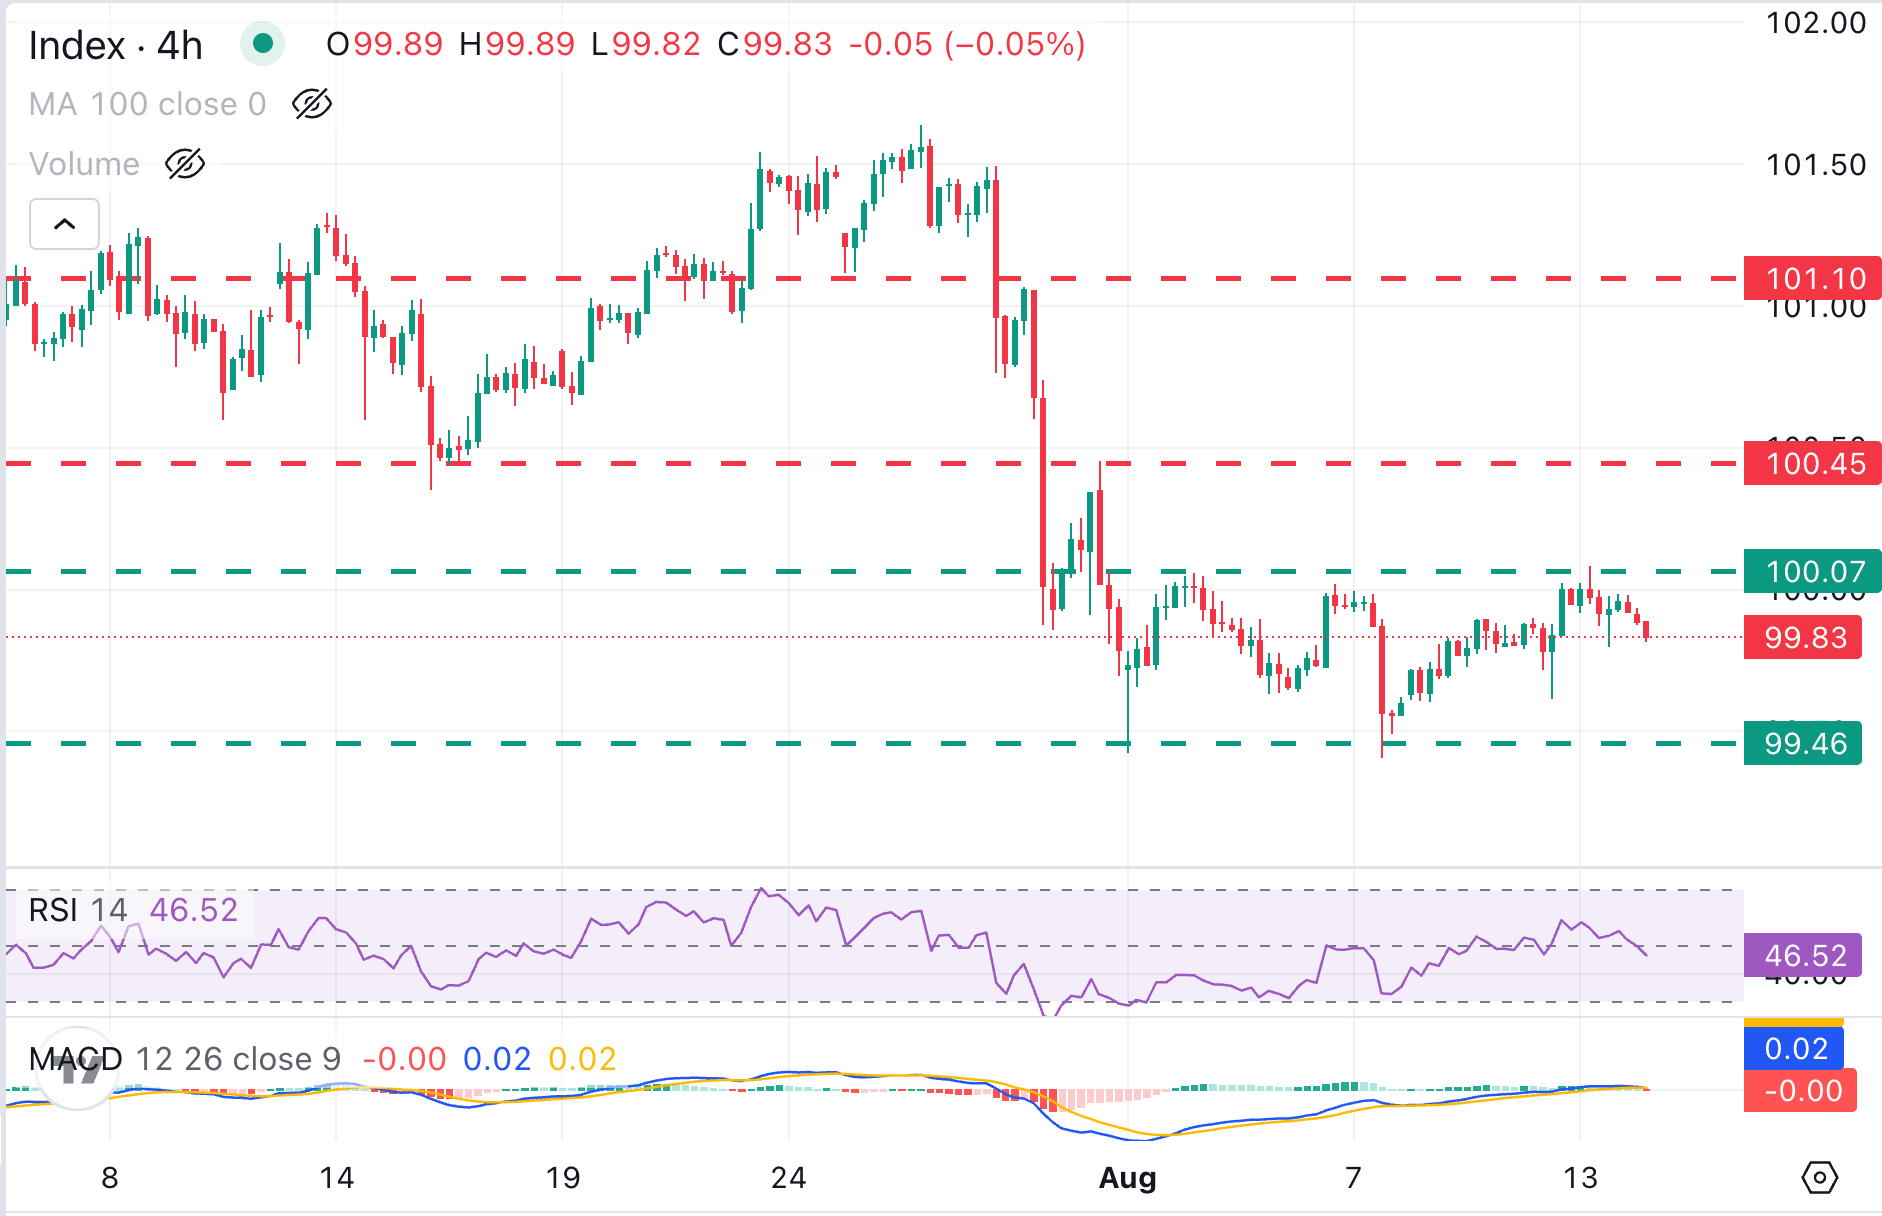
The AUD/USD pair struggles to capitalize on the previous day’s hawkish Reserve Bank of Australia-inspired bounce and trades with a negative bias for the second consecutive day on Wednesday. Spot prices, however, hold above the 0.7050 level as traders opt to wait for the outcome of a two-day FOMC policy meeting before placing fresh directional bets.
Oil: Price collapse reshapes Fed risk view – MUFG

MUFG’s Derek Halpenny underlines that Brent Oil falling below USD 80 and a roughly 30% drop in crude over a month have significantly reduced perceived near-term inflation risks from energy. This shift is seen as a “game-changer” for assessing broader inflation, potentially allowing the Fed some leeway even as it maintains a generally hawkish stance on policy and projections.
Sharp crude drop eases inflation risk
“As a result, Brent crude oil fell below the $80pbl level yesterday for the first time since 3rd March.”
“In the space of one month, crude oil has declined from an intra-day high (on 18th May) by 30%.”
“That’s a game-changer in terms of assessing near-term risk to broader inflation from a sustained energy price shock.”
“In the period since the crude oil price has dropped nearly 30%, the 2-year UST bond yield is close to unchanged so there is clearly a reluctance amongst investors to take a bullish view on rates with uncertainty over the outcome this evening an obvious deterrent.”
“Investors also likely see the energy price drop as only a counter to the continued surge in equities and the three months of stronger than expected NFP reports.”
(This article was created with the help of an Artificial Intelligence tool and reviewed by an editor.)
Cardano Price Forecast: Bearish flag pattern in ADA signals 14% downside risk
Cardano (ADA) price hovers above $0.1700 at press time on Wednesday, but the two consecutive days of losses cap the momentum in its short-term recovery. The pullback weighs down on the retail sentiment and forms a bearish flag pattern, with a 14% downside risk toward the June 6 low at $0.1486.
Risk-off sentiment rises in ADA derivatives
Retail strength in Cardano has been declining over the past few weeks amid concerns about network utility, ecosystem growth, and founder Charles Hoskinson’s posts about his responsibilities and his break from social media. CoinGlass data show that the volume in ADA derivatives has dropped by roughly 25% in the last 24 hours to $565.46 million, while Open Interest (OI) is up almost 3% to $385.38 million. Typically, an inverse relation in OI and volume suggests a quiet positional buildup in the market.
The negative funding rate of -0.0099% – indicating traders are willing to buy short positions for a premium– confirms a heavy bearish buildup in ADA derivatives. In short, ADA derivatives data reflects a bearish crowding or crowded-shorts scenario.

Technical outlook: Will Cardano price drop below $0.1500?
Cardano trades around $0.1700 at press time on Wednesday, maintaining a broadly bearish bias on the 4-hour chart. ADA price holds beneath the 50-period Exponential Moving Average (EMA) at $0.1752 is the first cap above spot, with the 100-period EMA at $0.1845 and the 200-period EMA at $0.2035 reinforcing the broader downside bias.
From a technical perspective, ADA price hovers near the local support trendline of a short-term rising channel pattern around $0.1700. However, the channel completes a bearish flag pattern with the 30% drop in early June acting as the pole.
That said, the Relative Strength Index (RSI) hovers just below the midline near 47 on the 4-hour chart, while the Moving Average Convergence Divergence (MACD) remains below its signal line, following a bearish trajectory. Taken together, the momentum indicators suggest that recovery attempts are likely to encounter selling pressure while the price remains below these key EMAs.
A decisive close below $0.1700 could confirm a bearish breakout of the inverted flag pattern, shifting attention to lower support levels. The 78.6% and 100% Fibonacci levels, measured over the 30% drop in early June, at $0.1644 and $0.1486, serve as crucial bases, with the latter signaling a potential 14% downside from the current market price. The 127.2% Fibonacci extension level at $0.1306 emerges as the extended bearish price target.
Looking up, a potential rebound in ADA price could test the 50- and 100-period EMAs at $0.1752 and $0.1845, respectively, followed by the 50% retracement level at $0.1883.
(The technical analysis of this story was written with the help of an AI tool.)
Cryptocurrency metrics FAQs
Euro holds steady above 1.1600 ahead of Fed rate decision

The EUR/USD pair holds steady near 1.1610 during the early Asian session on Wednesday. Traders prefer to wait on the sidelines ahead of the US Federal Reserve (Fed) interest rate decision later in the day. Also, the US May Retail Sales will be published.
The Fed is widely expected to keep its benchmark interest rate unchanged at a target range of 3.50% to 3.75% at its upcoming June policy meeting on Wednesday. Traders will closely monitor the press conference, as Kevin Warsh could offer clues on whether he seeks to raise interest rates to tame inflation or cut them, as Trump has long demanded.
Any hawkish remarks from Fed policymakers could lift the US dollar (USD) and act as a headwind for the major pair in the near term. Markets are pricing in a 42.6% probability that the US central bank will raise interest rates by 25 basis points (bps) by year-end, according to the CME FedWatch tool.
A deal to reopen the Strait of Hormuz could spur a rally in riskier assets such as the shared currency. US Vice-President JD Vance said on Tuesday that US President Donald Trump may decide to release a preliminary deal to end the war with Iran before Friday, after Trump said the agreement had already been signed.
Fed FAQs
Monetary policy in the US is shaped by the Federal Reserve (Fed). The Fed has two mandates: to achieve price stability and foster full employment. Its primary tool to achieve these goals is by adjusting interest rates.
When prices are rising too quickly and inflation is above the Fed’s 2% target, it raises interest rates, increasing borrowing costs throughout the economy. This results in a stronger US Dollar (USD) as it makes the US a more attractive place for international investors to park their money.
When inflation falls below 2% or the Unemployment Rate is too high, the Fed may lower interest rates to encourage borrowing, which weighs on the Greenback.
The Federal Reserve (Fed) holds eight policy meetings a year, where the Federal Open Market Committee (FOMC) assesses economic conditions and makes monetary policy decisions.
The FOMC is attended by twelve Fed officials – the seven members of the Board of Governors, the president of the Federal Reserve Bank of New York, and four of the remaining eleven regional Reserve Bank presidents, who serve one-year terms on a rotating basis.
In extreme situations, the Federal Reserve may resort to a policy named Quantitative Easing (QE). QE is the process by which the Fed substantially increases the flow of credit in a stuck financial system.
It is a non-standard policy measure used during crises or when inflation is extremely low. It was the Fed’s weapon of choice during the Great Financial Crisis in 2008. It involves the Fed printing more Dollars and using them to buy high grade bonds from financial institutions. QE usually weakens the US Dollar.
Quantitative tightening (QT) is the reverse process of QE, whereby the Federal Reserve stops buying bonds from financial institutions and does not reinvest the principal from the bonds it holds maturing, to purchase new bonds. It is usually positive for the value of the US Dollar.
USD/CHF Price Forecast: Bullish despite dropping towards 200-day SMA
The USD/CHF retreats for the second straight day but remains above its current weekly low of 0.7921, due to overall US Dollar weakness, triggered by the Greenback’s strong correlation with falling Oil prices and traders’ lack of expectation of Fed rate hikes. This provided a leg down in the pair, which traded at 0.7933, down 0.16%.
USD/CHF Price Forecast: Technical outlook
Overall, the USD/CHF is neutral to slightly upward-biased, even though the uptrend stalled after testing 0.8000. In the short term, momentum favours sellers, as indicated by the Relative Strength Index (RSI), which could open the door to a test of the 200-day Simple Moving Average (SMA) at 0.7906.
A breach below the 200-day SMA opens the door to test the ‘inverted head-and-shoulders’ neckline, which remains in play around 0.7878, before diving towards the 50-day SMA at 0.7864.
However, if USD/CHF climbs above June’s 15 high of 0.7968, it opens the door to test June 12’s daily peak of 0.7976 ahead of the 0.8000 figure. Once hurdled, the next resistance would be the March 31 cycle high of 0.8042, ahead of the 0.8100 milestone.
USD/CHF Price Chart – Daily

Swiss Franc Price Today
The table below shows the percentage change of Swiss Franc (CHF) against listed major currencies today. Swiss Franc was the strongest against the Japanese Yen.
| USD | EUR | GBP | JPY | CAD | AUD | NZD | CHF | |
|---|---|---|---|---|---|---|---|---|
| USD | -0.15% | -0.07% | 0.08% | 0.05% | 0.09% | -0.16% | -0.17% | |
| EUR | 0.15% | 0.08% | 0.28% | 0.21% | 0.23% | -0.02% | -0.02% | |
| GBP | 0.07% | -0.08% | 0.17% | 0.14% | 0.15% | -0.09% | -0.09% | |
| JPY | -0.08% | -0.28% | -0.17% | -0.04% | -0.01% | -0.22% | -0.24% | |
| CAD | -0.05% | -0.21% | -0.14% | 0.04% | 0.03% | -0.21% | -0.23% | |
| AUD | -0.09% | -0.23% | -0.15% | 0.01% | -0.03% | -0.24% | -0.23% | |
| NZD | 0.16% | 0.02% | 0.09% | 0.22% | 0.21% | 0.24% | -0.00% | |
| CHF | 0.17% | 0.02% | 0.09% | 0.24% | 0.23% | 0.23% | 0.00% |
The heat map shows percentage changes of major currencies against each other. The base currency is picked from the left column, while the quote currency is picked from the top row. For example, if you pick the Swiss Franc from the left column and move along the horizontal line to the US Dollar, the percentage change displayed in the box will represent CHF (base)/USD (quote).
Swiss Franc FAQs
The Swiss Franc (CHF) is Switzerland’s official currency. It is among the top ten most traded currencies globally, reaching volumes that well exceed the size of the Swiss economy. Its value is determined by the broad market sentiment, the country’s economic health or action taken by the Swiss National Bank (SNB), among other factors. Between 2011 and 2015, the Swiss Franc was pegged to the Euro (EUR). The peg was abruptly removed, resulting in a more than 20% increase in the Franc’s value, causing a turmoil in markets. Even though the peg isn’t in force anymore, CHF fortunes tend to be highly correlated with the Euro ones due to the high dependency of the Swiss economy on the neighboring Eurozone.
The Swiss Franc (CHF) is considered a safe-haven asset, or a currency that investors tend to buy in times of market stress. This is due to the perceived status of Switzerland in the world: a stable economy, a strong export sector, big central bank reserves or a longstanding political stance towards neutrality in global conflicts make the country’s currency a good choice for investors fleeing from risks. Turbulent times are likely to strengthen CHF value against other currencies that are seen as more risky to invest in.
The Swiss National Bank (SNB) meets four times a year – once every quarter, less than other major central banks – to decide on monetary policy. The bank aims for an annual inflation rate of less than 2%. When inflation is above target or forecasted to be above target in the foreseeable future, the bank will attempt to tame price growth by raising its policy rate. Higher interest rates are generally positive for the Swiss Franc (CHF) as they lead to higher yields, making the country a more attractive place for investors. On the contrary, lower interest rates tend to weaken CHF.
Macroeconomic data releases in Switzerland are key to assessing the state of the economy and can impact the Swiss Franc’s (CHF) valuation. The Swiss economy is broadly stable, but any sudden change in economic growth, inflation, current account or the central bank’s currency reserves have the potential to trigger moves in CHF. Generally, high economic growth, low unemployment and high confidence are good for CHF. Conversely, if economic data points to weakening momentum, CHF is likely to depreciate.
As a small and open economy, Switzerland is heavily dependent on the health of the neighboring Eurozone economies. The broader European Union is Switzerland’s main economic partner and a key political ally, so macroeconomic and monetary policy stability in the Eurozone is essential for Switzerland and, thus, for the Swiss Franc (CHF). With such dependency, some models suggest that the correlation between the fortunes of the Euro (EUR) and the CHF is more than 90%, or close to perfect.
Japanese Yen fails to gain support after BoJ hike
The USD/JPY pair rose slightly around the intervention zone of 160.40 on Tuesday, as the Japanese Yen (JPY) struggles to gain strong traction even after the Bank of Japan (BoJ) raised interest rates to their highest level in more than three decades.
The BoJ lifted its short-term policy rate to 1.00% from 0.75%, in a widely expected move as policymakers continued to focus on upside inflation risks. The decision was backed by a 7-1 vote, while Deputy Governor Shinichi Uchida signaled that the central bank remains prepared to tighten further if inflation persists.
However, the Yen failed to rally sharply as the BoJ also adopted a more cautious stance on bonds. The central bank decided to pause its bond-buying taper from April 2027 onward, while continuing to purchase roughly ¥2 trillion in Japanese government bonds per month.
This suggests that while the BoJ is moving further away from ultra-loose monetary policy, it still wants to avoid excessive volatility in the Japanese government bond market.
Short-term technical analysis:
On the 4-hour chart, USD/JPY trades at 160.45, maintaining a constructive bullish bias as it hovers just below nearby resistance at 160.47. The pair remains supported above both the 20-period Simple Moving Average (SMA) at 160.24 and the 100-period SMA at 159.85, suggesting the broader uptrend is still intact despite the latest consolidation. The Relative Strength Index (RSI) at 58 stays in positive territory without being overbought, hinting that buyers retain control but may need a clear break over 160.47 to trigger fresh upside momentum.
On the topside, immediate resistance is aligned at 160.47, where a sustained break would open the way for further gains in the near term. On the downside, initial support is seen at the horizontal level near 160.32, followed by the 160.24 band, where a price floor converges with the 20-period SMA, and then 160.15. Deeper losses would expose the 100-period SMA at 159.85, which acts as the key medium-term support maintaining the bullish structure.
(The technical analysis of this story was written with the help of an AI tool.)
Bitcoin Price Forecast: BTC rebound driven by fading selling pressure as demand remains subdued
Bitcoin (BTC) extends its recovery, trading above $66,500 as of Tuesday, marking four consecutive daily gains since the weekend. Institutional selling continues as spot Exchange Traded Funds (ETFs) recorded a mild outflow on Monday; however, the pace of withdrawals has slowed compared with recent weeks. Traders should remain cautious, as Glassnode reported that BTC’s rebound suggests stabilization rather than a trend reversal.
Institutional selling may be easing
Institutional demand began the week on a weak note. SoSoValue data showed that spot Bitcoin ETFs recorded outflows of $64.09 million on Monday. While the flows remained negative, the pace of selling was lower than the heavy outflows seen in recent weeks, suggesting that selling pressure may be easing. However, traders should be cautious, as a sustained recovery in BTC would require these flows to turn positive and strengthen in the coming days.

On the corporate front, Michael Saylor announced on Monday that his firm Strategy has acquired 1,587 BTC, bringing the total holding to 846,842 BTC. In addition, the firm also increased its USD Reserve by $100 million to $1.1 billion. This highlights the company’s continued conviction in Bitcoin and aggressive accumulation despite the recent BTC price correction.
BTC hints at stabilization rather than a trend reversal
Glassnode reported on Monday that the Crypto King is staging a tentative relief bounce from deeply oversold conditions. Meanwhile, on-chain and derivatives data suggest stabilization rather than a trend reversal.
“The recovery is happening on thin ice,” the report noted.
According to Glassnode, spot trading volume has fallen 40.4% to $5.8 billion. In comparison, futures open interest declined another 3% to $30.65 billion, indicating that the recent rebound is largely being driven by short covering rather than fresh buying. Long-side funding payments dropped 22.3%, and spot ETF trading volume fell 38.1% to $11.1 billion, highlighting subdued institutional participation.

“The market is lighter, not healthier,” Glassnode’s analyst added.
The report concluded that the lack of strong spot demand, shrinking derivatives activity, and continued capital outflows suggest BTC is building a consolidation base rather than confirming a trend reversal.
Bitcoin Price Forecast: Extends rebound
Bitcoin trades at $66,600 on Tuesday, extending its recovery since the weekend. However, BTC maintains a bearish bias as price remains well below the 50-day, 100-day, and 200-day Exponential Moving Averages (EMAs) and the previously broken ascending trendline.
Momentum is mixed, with the Relative Strength Index (RSI) on the daily chart hovering near 45 and the Moving Average Convergence Divergence (MACD) positive and above the zero line, hinting that downside pressure is easing but not yet strong enough to overcome the dominant overhead supply.
On the topside, initial resistance is seen at the 50-day EMA near $70,566, followed by the 100-day EMA at $73,246 and the prior rising trendline break zone around $73,641. Beyond that, the 200-day EMA at $79,081 becomes a key medium-term barrier before the stronger horizontal resistance at $84,410.

On the downside, the first notable support emerges at the horizontal level near $64,004; a sustained break below this floor would open the door to a deeper corrective phase, while holding above it would keep BTC in a broad consolidation beneath the cluster of daily EMAs.
(The technical analysis of this story was written with the help of an AI tool.)
Bitcoin, altcoins, stablecoins FAQs
Bitcoin is the largest cryptocurrency by market capitalization, a virtual currency designed to serve as money. This form of payment cannot be controlled by any one person, group, or entity, which eliminates the need for third-party participation during financial transactions.
Altcoins are any cryptocurrency apart from Bitcoin, but some also regard Ethereum as a non-altcoin because it is from these two cryptocurrencies that forking happens. If this is true, then Litecoin is the first altcoin, forked from the Bitcoin protocol and, therefore, an “improved” version of it.
Stablecoins are cryptocurrencies designed to have a stable price, with their value backed by a reserve of the asset it represents. To achieve this, the value of any one stablecoin is pegged to a commodity or financial instrument, such as the US Dollar (USD), with its supply regulated by an algorithm or demand. The main goal of stablecoins is to provide an on/off-ramp for investors willing to trade and invest in cryptocurrencies. Stablecoins also allow investors to store value since cryptocurrencies, in general, are subject to volatility.
Bitcoin dominance is the ratio of Bitcoin’s market capitalization to the total market capitalization of all cryptocurrencies combined. It provides a clear picture of Bitcoin’s interest among investors. A high BTC dominance typically happens before and during a bull run, in which investors resort to investing in relatively stable and high market capitalization cryptocurrency like Bitcoin. A drop in BTC dominance usually means that investors are moving their capital and/or profits to altcoins in a quest for higher returns, which usually triggers an explosion of altcoin rallies.
Japan FM Katayama: Government’s responsibility rests in appropriately conducting economic, fiscal policies

Japan Finance Minister (FM) Satsuki Katayama said during the European trading session on Tuesday that the government is focused on appropriately conducting economic and fiscal policies.
Additional remarks
Won’t comment on BoJ decision until after BoJ deputy governor speaks.
Believe status of accessing mythos remains as previously promised but checking on actual operations.
Market reaction
No major action seen in the Japanese Yen (JPY) following Japan’s Katayama comments. As of writing, USD/JPY trades slightly lower to near 160.25.
Japanese Yen FAQs
The Japanese Yen (JPY) is one of the world’s most traded currencies. Its value is broadly determined by the performance of the Japanese economy, but more specifically by the Bank of Japan’s policy, the differential between Japanese and US bond yields, or risk sentiment among traders, among other factors.
One of the Bank of Japan’s mandates is currency control, so its moves are key for the Yen. The BoJ has directly intervened in currency markets sometimes, generally to lower the value of the Yen, although it refrains from doing it often due to political concerns of its main trading partners. The BoJ ultra-loose monetary policy between 2013 and 2024 caused the Yen to depreciate against its main currency peers due to an increasing policy divergence between the Bank of Japan and other main central banks. More recently, the gradually unwinding of this ultra-loose policy has given some support to the Yen.
Over the last decade, the BoJ’s stance of sticking to ultra-loose monetary policy has led to a widening policy divergence with other central banks, particularly with the US Federal Reserve. This supported a widening of the differential between the 10-year US and Japanese bonds, which favored the US Dollar against the Japanese Yen. The BoJ decision in 2024 to gradually abandon the ultra-loose policy, coupled with interest-rate cuts in other major central banks, is narrowing this differential.
The Japanese Yen is often seen as a safe-haven investment. This means that in times of market stress, investors are more likely to put their money in the Japanese currency due to its supposed reliability and stability. Turbulent times are likely to strengthen the Yen’s value against other currencies seen as more risky to invest in.
China Fixed Asset Investment (YTD) (YoY) registered at -4.1%, below expectations (-2%) in May
The Reserve Bank of Australia is widely expected to leave the Official Cash Rate unchanged at 4.35% when it announces its monetary policy decision on Tuesday, marking a pause after three consecutive rate hikes delivered earlier this year. The decision will be announced at 04:30 GMT, accompanied by the Monetary Policy Statement.
South Korea Import Price Growth (YoY): 24.8% (May) vs 20.2%
EUR/USD rapidly leaves behind Friday’s small downtick and trades with solid gains on Monday, consolidating its daily advance around the 1.1600 region as the NA session draws to a close. Meanwhile, the improved risk appetite following the US-Iran deal and the reopening of the Strait of Hormuz continues to weigh on the US Dollar, lending support to the broader risk-linked galaxy.