Financial markets could find an important catalyst in the enchanting, fairytale-like landscape of Sintra this week. The European Central Bank Forum will, as it does every year, gather the crème de la crème of central banks. The new boss at the Federal Reserve, who has clearly said that the Fed should stop explaining everything, will need to talk – and traders should listen.
Sweden Manufacturing PMI rose from previous 57.3 to 58.3 in June
Solana price extends gains, testing the 50-day Exponential Moving Average around $75.00. Although institutional demand for Solana remains weak, stabilizing retail confidence, with rising funding rates and steady Open Interest, supports the mild recovery. The technical outlook for SOL shifts mildly bullish, projecting a potential breakout rally toward the $100 mark.
China’s RatingDog Manufacturing PMI matches forecast in June: What 51.7 means for Australian Dollar
China’s RatingDog Manufacturing Purchasing Managers’ Index (PMI) eased to 51.7 in June from 51.8 in May the latest data published by RatingDog showed on Wednesday. The market forecast was for a 51.7 reading.
The China-proxy Australian Dollar (AUD) has little to no impact following China’s PMI data. At the press time, the AUD/USD pair is down 0.37% on the day to trade at 0.6893.
Australian Dollar Price Today
The table below shows the percentage change of Australian Dollar (AUD) against listed major currencies today. Australian Dollar was the weakest against the US Dollar.
| USD | EUR | GBP | JPY | CAD | AUD | NZD | CHF | |
|---|---|---|---|---|---|---|---|---|
| USD | 0.15% | 0.19% | 0.03% | 0.16% | 0.42% | 0.25% | 0.10% | |
| EUR | -0.15% | 0.03% | -0.11% | 0.00% | 0.28% | 0.07% | -0.05% | |
| GBP | -0.19% | -0.03% | -0.15% | -0.02% | 0.23% | 0.04% | -0.06% | |
| JPY | -0.03% | 0.11% | 0.15% | 0.11% | 0.39% | 0.18% | 0.07% | |
| CAD | -0.16% | -0.01% | 0.02% | -0.11% | 0.27% | 0.06% | -0.05% | |
| AUD | -0.42% | -0.28% | -0.23% | -0.39% | -0.27% | -0.21% | -0.29% | |
| NZD | -0.25% | -0.07% | -0.04% | -0.18% | -0.06% | 0.21% | -0.10% | |
| CHF | -0.10% | 0.05% | 0.06% | -0.07% | 0.05% | 0.29% | 0.10% |
The heat map shows percentage changes of major currencies against each other. The base currency is picked from the left column, while the quote currency is picked from the top row. For example, if you pick the Australian Dollar from the left column and move along the horizontal line to the US Dollar, the percentage change displayed in the box will represent AUD (base)/USD (quote).
What do China’s RatingDog Manufacturing PMI data mean for the Australian Dollar?
China’s Manufacturing PMI is a leading indicator gauging business activity in China’s manufacturing sector, highlighting the health of the manufacturing sector, considered as the backbone of the Chinese economy. This reading is closely watched by traders, as China is Australia’s largest trading partner.
While the report does not directly determine the Reserve Bank of Australia (RBA) decisions, but they can affect the Australian economy through trade and commodity channels.
Stronger-than-expected PMI readings signals stronger business activity and economic growth in China, which could lift the China-proxy Aussie as risk sentiment improves. On the other hand, weaker-than-expected readings could indicate slowing economic activity and weigh on the AUD.
Technical Analysis: AUD/USD keeps the negative outlook under the key 100-day SMA
In the daily chart, AUD/USD keeps a bearish near-term tone as spot holds below the 20-day Bollinger simple moving average and the 100-day moving average. The Relative Strength Index (14) at 32 stays in weak territory, hinting that downside pressure persists even as conditions approach oversold.
On the topside, initial resistance sits at the Bollinger midline around 0.6995, followed by the 100-day moving average at 0.7075 and then the upper Bollinger band near 0.7135. On the downside, the immediate technical floor is defined by the lower Bollinger band around 0.6850, where a break would open the door to an extension of the current decline.
(The technical analysis of this story was written with the help of an AI tool.)
Economic Indicator
RatingDog Manufacturing PMI
The RatingDog Manufacturing Purchasing Managers Index (PMI), released on a monthly basis by Caixin Insight Group and S&P Global, is a leading indicator gauging business activity in China’s manufacturing sector. The data is derived from surveys of senior executives at both private-sector and state-owned companies. Survey responses reflect the change, if any, in the current month compared to the previous month and can anticipate changing trends in official data series such as Gross Domestic Product (GDP), industrial production, employment and inflation.The index varies between 0 and 100, with levels of 50.0 signaling no change over the previous month. A reading above 50 indicates that the manufacturing economy is generally expanding, a bullish sign for the Renminbi (CNY). Meanwhile, a reading below 50 signals that activity among goods producers is generally declining, which is seen as bearish for CNY.
Last release: Mon Jun 01, 2026 01:45
Frequency: Monthly
Actual: 51.8
Consensus: 51.4
Previous: 52.2
Source: IHS Markit
Australian Dollar FAQs
One of the most significant factors for the Australian Dollar (AUD) is the level of interest rates set by the Reserve Bank of Australia (RBA). Because Australia is a resource-rich country another key driver is the price of its biggest export, Iron Ore. The health of the Chinese economy, its largest trading partner, is a factor, as well as inflation in Australia, its growth rate and Trade Balance. Market sentiment – whether investors are taking on more risky assets (risk-on) or seeking safe-havens (risk-off) – is also a factor, with risk-on positive for AUD.
The Reserve Bank of Australia (RBA) influences the Australian Dollar (AUD) by setting the level of interest rates that Australian banks can lend to each other. This influences the level of interest rates in the economy as a whole. The main goal of the RBA is to maintain a stable inflation rate of 2-3% by adjusting interest rates up or down. Relatively high interest rates compared to other major central banks support the AUD, and the opposite for relatively low. The RBA can also use quantitative easing and tightening to influence credit conditions, with the former AUD-negative and the latter AUD-positive.
China is Australia’s largest trading partner so the health of the Chinese economy is a major influence on the value of the Australian Dollar (AUD). When the Chinese economy is doing well it purchases more raw materials, goods and services from Australia, lifting demand for the AUD, and pushing up its value. The opposite is the case when the Chinese economy is not growing as fast as expected. Positive or negative surprises in Chinese growth data, therefore, often have a direct impact on the Australian Dollar and its pairs.
Iron Ore is Australia’s largest export, accounting for $118 billion a year according to data from 2021, with China as its primary destination. The price of Iron Ore, therefore, can be a driver of the Australian Dollar. Generally, if the price of Iron Ore rises, AUD also goes up, as aggregate demand for the currency increases. The opposite is the case if the price of Iron Ore falls. Higher Iron Ore prices also tend to result in a greater likelihood of a positive Trade Balance for Australia, which is also positive of the AUD.
The Trade Balance, which is the difference between what a country earns from its exports versus what it pays for its imports, is another factor that can influence the value of the Australian Dollar. If Australia produces highly sought after exports, then its currency will gain in value purely from the surplus demand created from foreign buyers seeking to purchase its exports versus what it spends to purchase imports. Therefore, a positive net Trade Balance strengthens the AUD, with the opposite effect if the Trade Balance is negative.
Thai Baht: Recovery seen shallow without USD fade – OCBC

Christopher Wong at OCBC notes USD/THB’s recent rebound is running into interim resistance around 33.40 after a sharp move higher. Bank of Thailand officials attribute THB weakness mainly to broad USD strength and Thai equity outflows, while signalling readiness to manage excessive FX moves. Softer Oil may slow USD/THB upside, but THB recovery could stay shallow unless USD momentum fades and Gold prices stabilise.
Interim resistance caps rebound
“USD/THB’s rebound is showing signs of running into interim resistance around the 33.40 levels, after a sharp move higher last week.”
“BoT officials recently attributed THB weakness mainly to broad USD strength and Thai equity outflows, while also signalling readiness to manage excessive FX moves.”
“Overall, softer oil can help slow USD/THB upside, but THB recovery may remain shallow unless USD momentum fades, oil stay contained portfolio outflows and gold prices stabilise.”
“Support at 33.20, 33 levels. Resistance at 33.41 (61.8% fibo retracement of 2025 high to 2026 low).”
“USD/THB last seen at 33.28 levels. Mild bullish momentum on daily chart remains intact though RSI shows signs of easing from overbought conditions. Retracement lower not ruled out.”
(This article was created with the help of an Artificial Intelligence tool and reviewed by an editor.)
Ondo Price Forecast: ONDO holds key support as network’s tokenized stocks launch on Uniswap
Ondo Finance (ONDO) is facing a pivotal moment as it attempts to hold above the $0.30 short-term support level on Tuesday. Since early June, ONDO has declined by more than 30%, putting significant pressure on the technical setup and reducing the probability of a sustained bullish reversal.
Uniswap lists Ondo Finance tokenized stocks and ETFs
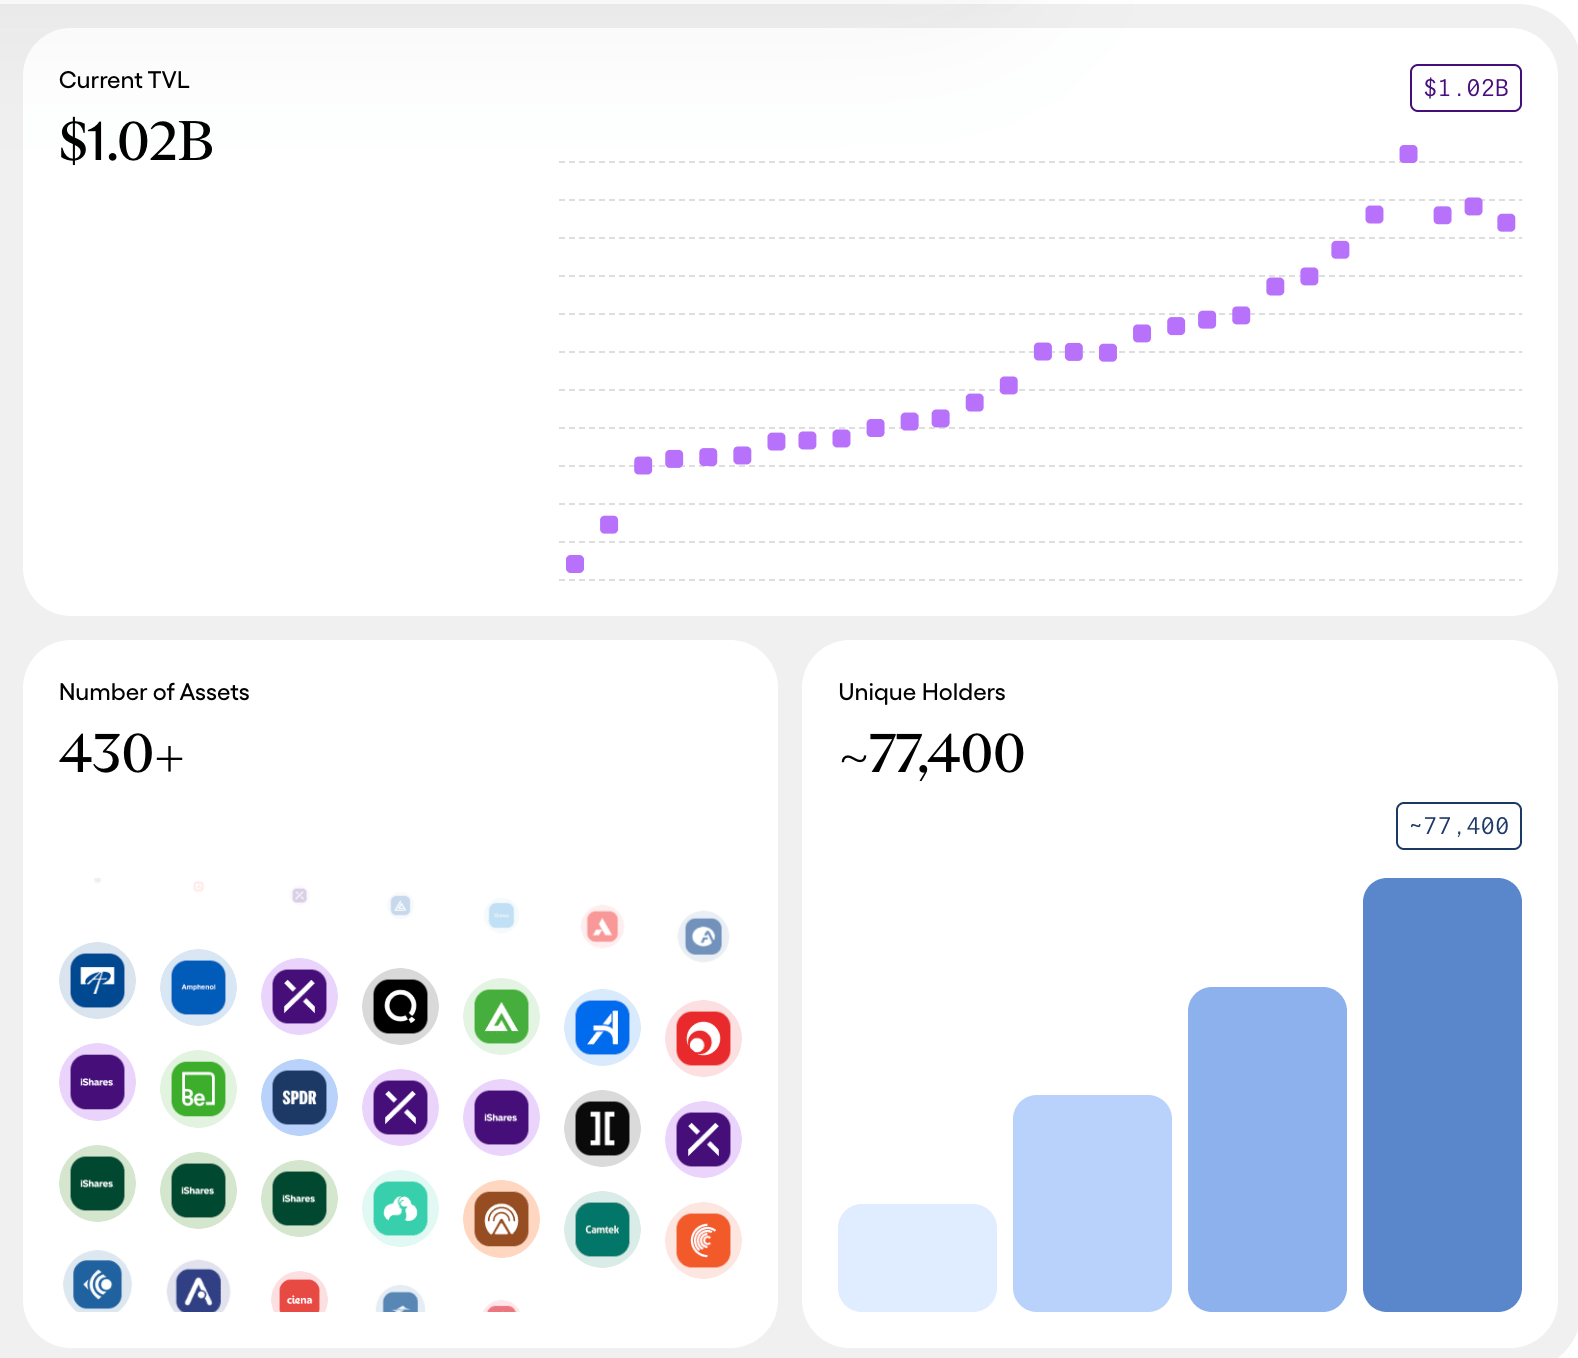
Ondo Finance announced on Tuesday that more than 430 tokenized stocks and Exchange-Traded Funds (ETFs) are now available for trading on the decentralized exchange (DEX) Uniswap.
Qualified participants on Ethereum (ETH) and BNB Chain can now gain exposure to leading equities such as SpaceX (SPCX), Tesla (TSLA), Nvidia (NVDA), and Apple (AAPL), along with major ETFs like QQQ and SPY, all seamlessly via the Uniswap platform.
Ondo Finance stated in the press release that protocols, wallets, or applications that have integrated UniswapX can link their users to Ondo tokenized stocks and ETFs without additional integration work.
Ondo Finance is a leading real-world asset (RWA) tokenization platform, with a self-reported Total Value Locked (TVL) of $1.02 billion. The protocol boasts over 77,000 unique holders spread across over 430 assets.
Price analysis: Ondo under pressure as bearish signals persist
ONDO trades around $0.31 as bulls aggressively defend the psychological $0.30 support level. Meanwhile, the token upholds a bearish bias, sitting decisively below the short and long-term Exponential Moving Averages (EMAs).
Momentum conditions reinforce the cautious tone, with the Relative Strength Index (RSI) hovering near 39 in weak territory on the daily chart and the Moving Average Convergence Divergence (MACD) histogram still negative, hinting at persistent downside pressure despite mild stabilization.
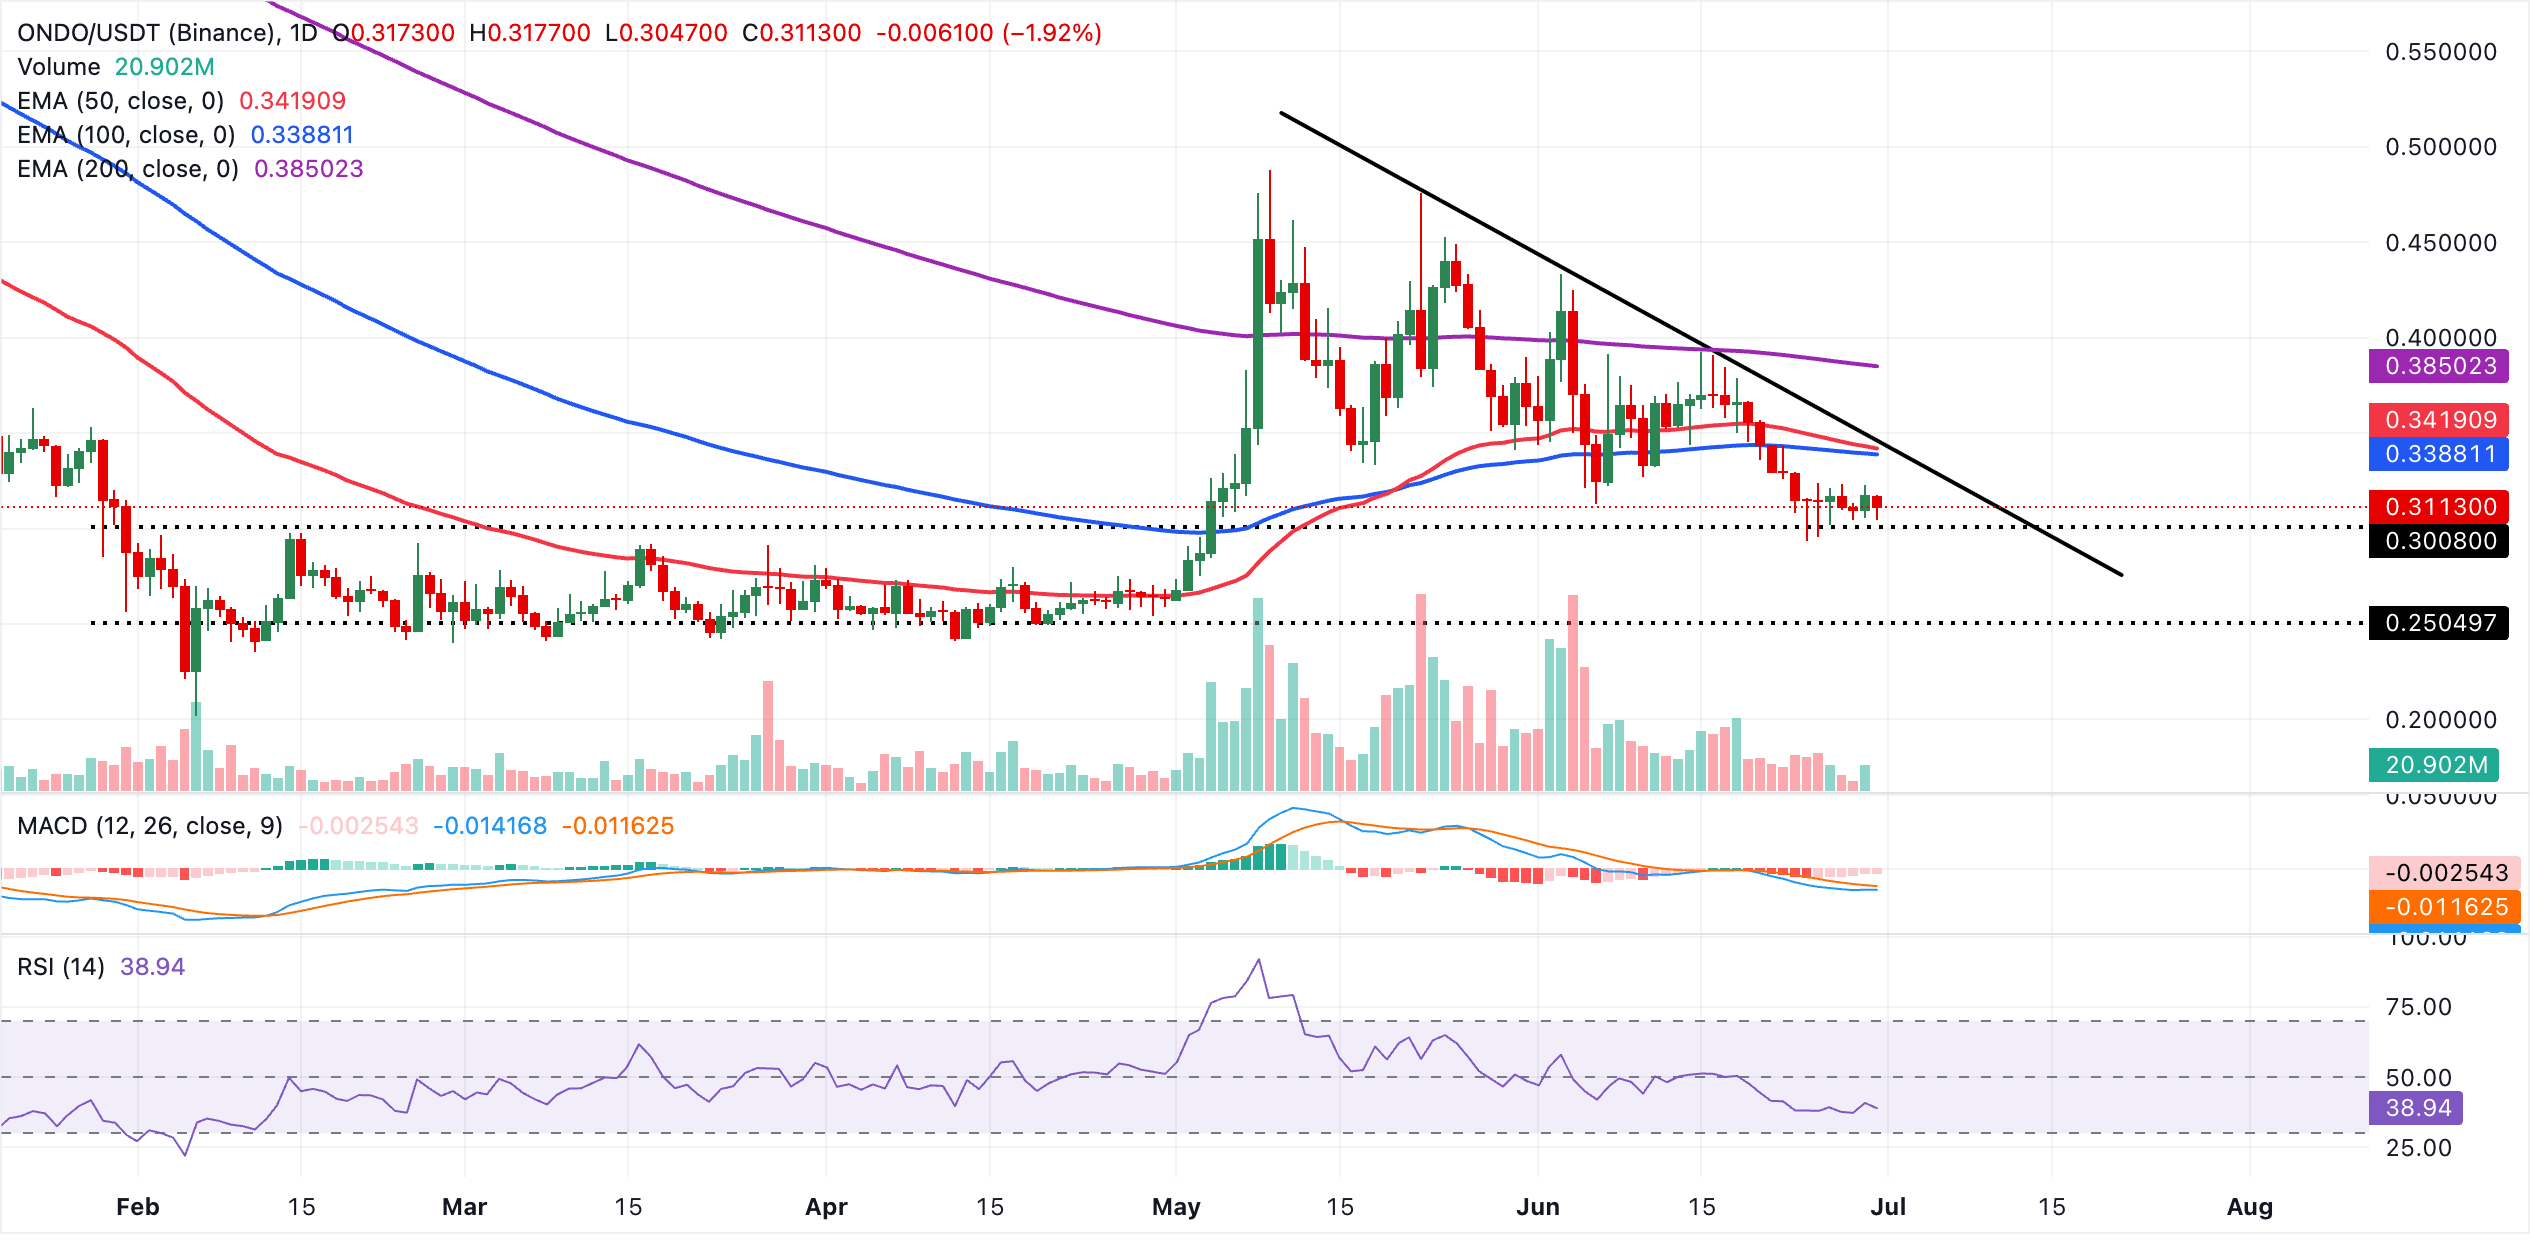
Initial resistance aligns with the 100-day EMA at $0.34, followed closely by the 50-day EMA at $0.34, forming a compact supply zone that bulls would need to reclaim to ease the current bearish structure. Above these barriers, the 200-day EMA at $0.39 marks a more significant hurdle within the broader downtrend, while the longer-term descending trendline, referenced around $0.52, defines the upper boundary. Looking down, ONDO bulls hold firmly to the immediate support at $0.30, where a deeper sell-off will likely open the door to losses targeting the demand area at $0.25.
(The technical analysis of this story was written with the help of an AI tool.)
Bitcoin, altcoins, stablecoins FAQs
Bitcoin is the largest cryptocurrency by market capitalization, a virtual currency designed to serve as money. This form of payment cannot be controlled by any one person, group, or entity, which eliminates the need for third-party participation during financial transactions.
Altcoins are any cryptocurrency apart from Bitcoin, but some also regard Ethereum as a non-altcoin because it is from these two cryptocurrencies that forking happens. If this is true, then Litecoin is the first altcoin, forked from the Bitcoin protocol and, therefore, an “improved” version of it.
Stablecoins are cryptocurrencies designed to have a stable price, with their value backed by a reserve of the asset it represents. To achieve this, the value of any one stablecoin is pegged to a commodity or financial instrument, such as the US Dollar (USD), with its supply regulated by an algorithm or demand. The main goal of stablecoins is to provide an on/off-ramp for investors willing to trade and invest in cryptocurrencies. Stablecoins also allow investors to store value since cryptocurrencies, in general, are subject to volatility.
Bitcoin dominance is the ratio of Bitcoin’s market capitalization to the total market capitalization of all cryptocurrencies combined. It provides a clear picture of Bitcoin’s interest among investors. A high BTC dominance typically happens before and during a bull run, in which investors resort to investing in relatively stable and high market capitalization cryptocurrency like Bitcoin. A drop in BTC dominance usually means that investors are moving their capital and/or profits to altcoins in a quest for higher returns, which usually triggers an explosion of altcoin rallies.
Canada Gross Domestic Product (MoM) above forecasts (0.4%) in April: Actual (0.5%)
Gold (XAU/USD) builds on its intraday recovery from the lowest level since November 2025, touched below $3,950 earlier this Tuesday, and trades marginally higher on the day above $4,000. Any meaningful appreciation still seems elusive in the wake of a broadly firmer US Dollar. Against the backdrop of renewed Mideast tensions, mixed signals on US-Iran talks assist the USD and limit XAU/USD’s upside.
Germany Unemployment Rate s.a. meets expectations (6.3%) in May
Financial markets could find an important catalyst in the enchanting, fairytale-like landscape of Sintra this week. The ECB Forum will, as it does every year, gather the crème de la crème of central banks. The new boss at the Fed, who has clearly said that the Fed should stop explaining everything, will need to talk – and traders should listen.
New Zealand Dollar remains depressed as USD benefits from Iran risks and hawkish Fed

The NZD/USD pair attracts some sellers during the Asian session on Tuesday, though it lacks bearish conviction and remains confined in a familiar range held over the past week or so. Spot prices move little following the release of China’s official PMIs and currently trade just below mid-0.5600s, down 0.05% for the day.
An official survey published by the National Bureau of Statistics (NBS) showed that business activity in China’s manufacturing sector grew slightly above expectations in June. In fact, the official Manufacturing PMI rose from the 50.0 seen in May to 50.3, slightly above expectations of 50.1. Adding to this, the gauge for the non-manufacturing sector improved to 50.2 in June vs 50.1 in the previous month and forecast for a 49.9 print. The data, however, indicated that business activity barely remained in expansion territory on the back of sluggish domestic demand and weak consumer spending. This, in turn, fails to provide any impetus to antipodean currencies, including the New Zealand Dollar (NZD) and the NZD/USD pair.
The US Dollar (USD), on the other hand, draws some support from persistent geopolitical uncertainties and mixed signals on US-Iran talks. US President Donald Trump wrote on Truth Social that Iran had requested a meeting, and it will take place in Qatar’s capital, Doha, on Tuesday. However, Deputy Iranian Foreign Minister Kazem Gharibabadi denied that there were plans for technical talks this week. Furthermore, fresh Israeli strikes on Lebanon keep geopolitical risk premiums in play, which, along with hawkish US Federal Reserve (Fed) bets, underpins the safe-haven USD and weighs on the NZD/USD pair.
According to the CME Group’s FedWatch Tool, traders are still pricing in around 63% chance that the US central bank will raise borrowing costs in September and assigning over an 80% probability of a move by the end of this year. Adding to this, renewed US-Iran hostilities sparked inflationary fears, which, in turn, favor the USD bulls. However, the NZD/USD pair, so far, has held above its lowest level since November 2025, touched last week, warranting some caution before positioning for any further depreciating move.
New Zealand Dollar FAQs
The New Zealand Dollar (NZD), also known as the Kiwi, is a well-known traded currency among investors. Its value is broadly determined by the health of the New Zealand economy and the country’s central bank policy. Still, there are some unique particularities that also can make NZD move. The performance of the Chinese economy tends to move the Kiwi because China is New Zealand’s biggest trading partner. Bad news for the Chinese economy likely means less New Zealand exports to the country, hitting the economy and thus its currency. Another factor moving NZD is dairy prices as the dairy industry is New Zealand’s main export. High dairy prices boost export income, contributing positively to the economy and thus to the NZD.
The Reserve Bank of New Zealand (RBNZ) aims to achieve and maintain an inflation rate between 1% and 3% over the medium term, with a focus to keep it near the 2% mid-point. To this end, the bank sets an appropriate level of interest rates. When inflation is too high, the RBNZ will increase interest rates to cool the economy, but the move will also make bond yields higher, increasing investors’ appeal to invest in the country and thus boosting NZD. On the contrary, lower interest rates tend to weaken NZD. The so-called rate differential, or how rates in New Zealand are or are expected to be compared to the ones set by the US Federal Reserve, can also play a key role in moving the NZD/USD pair.
Macroeconomic data releases in New Zealand are key to assess the state of the economy and can impact the New Zealand Dollar’s (NZD) valuation. A strong economy, based on high economic growth, low unemployment and high confidence is good for NZD. High economic growth attracts foreign investment and may encourage the Reserve Bank of New Zealand to increase interest rates, if this economic strength comes together with elevated inflation. Conversely, if economic data is weak, NZD is likely to depreciate.
The New Zealand Dollar (NZD) tends to strengthen during risk-on periods, or when investors perceive that broader market risks are low and are optimistic about growth. This tends to lead to a more favorable outlook for commodities and so-called ‘commodity currencies’ such as the Kiwi. Conversely, NZD tends to weaken at times of market turbulence or economic uncertainty as investors tend to sell higher-risk assets and flee to the more-stable safe havens.
South Korea Service Sector Output increased to 1.3% in May from previous -1%
Financial markets could find an important catalyst in the enchanting, fairytale-like landscape of Sintra this week. The ECB Forum will, as it does every year, gather the crème de la crème of central banks. The new boss at the Fed, who has clearly said that the Fed should stop explaining everything, will need to talk – and traders should listen.
Singapore Dollar: Consolidates near recent lows against US Dollar – UOB

United Overseas Bank’s (UOB) Quek Ser Leang notes USD/SGD slipped to 1.2929 before recovering, with intraday price action still seen as range trading. For the day, the pair is expected to stay between 1.2930 and 1.2960. On a 1–3 week horizon, the bank keeps a constructive Dollar view while stressing that a break below 1.2925 would cap recent strength near 1.2991.
Range holds as upside momentum eases
“24-HOUR VIEW: When USD was at 1.2965 last Friday, we indicated that “the current price movements are likely part of a range-trading phase,” and we expected USD to “trade between 1.2950 and 1.2980.” We did not expect USD to dip to a low of 1.2929. USD recovered from the low to close -0.16% lower at 1.2949. Despite the decline, there is no clear increase in downward momentum, and USD is unlikely to weaken much further. Today, USD is more likely to trade between 1.2930 and 1.2960.”
“1-3 WEEKS VIEW: Tracking our positive view from the middle of the month, we highlighted the following last Friday (26 Jun, spot at 1.2965): “Upward momentum has eased somewhat, and USD needs to build on its gain soon, or a breach of 1.2925 (‘strong support’ level) would indicate that the 1.2991 high seen two days ago is the extent of the current USD strength.” USD subsequently dipped to a low of 1.2929. While upward momentum continues to ease, we will maintain our view as long as 1.2925 (no change in ‘strong support’ level) continues to hold”
(This article was created with the help of an Artificial Intelligence tool and reviewed by an editor.)