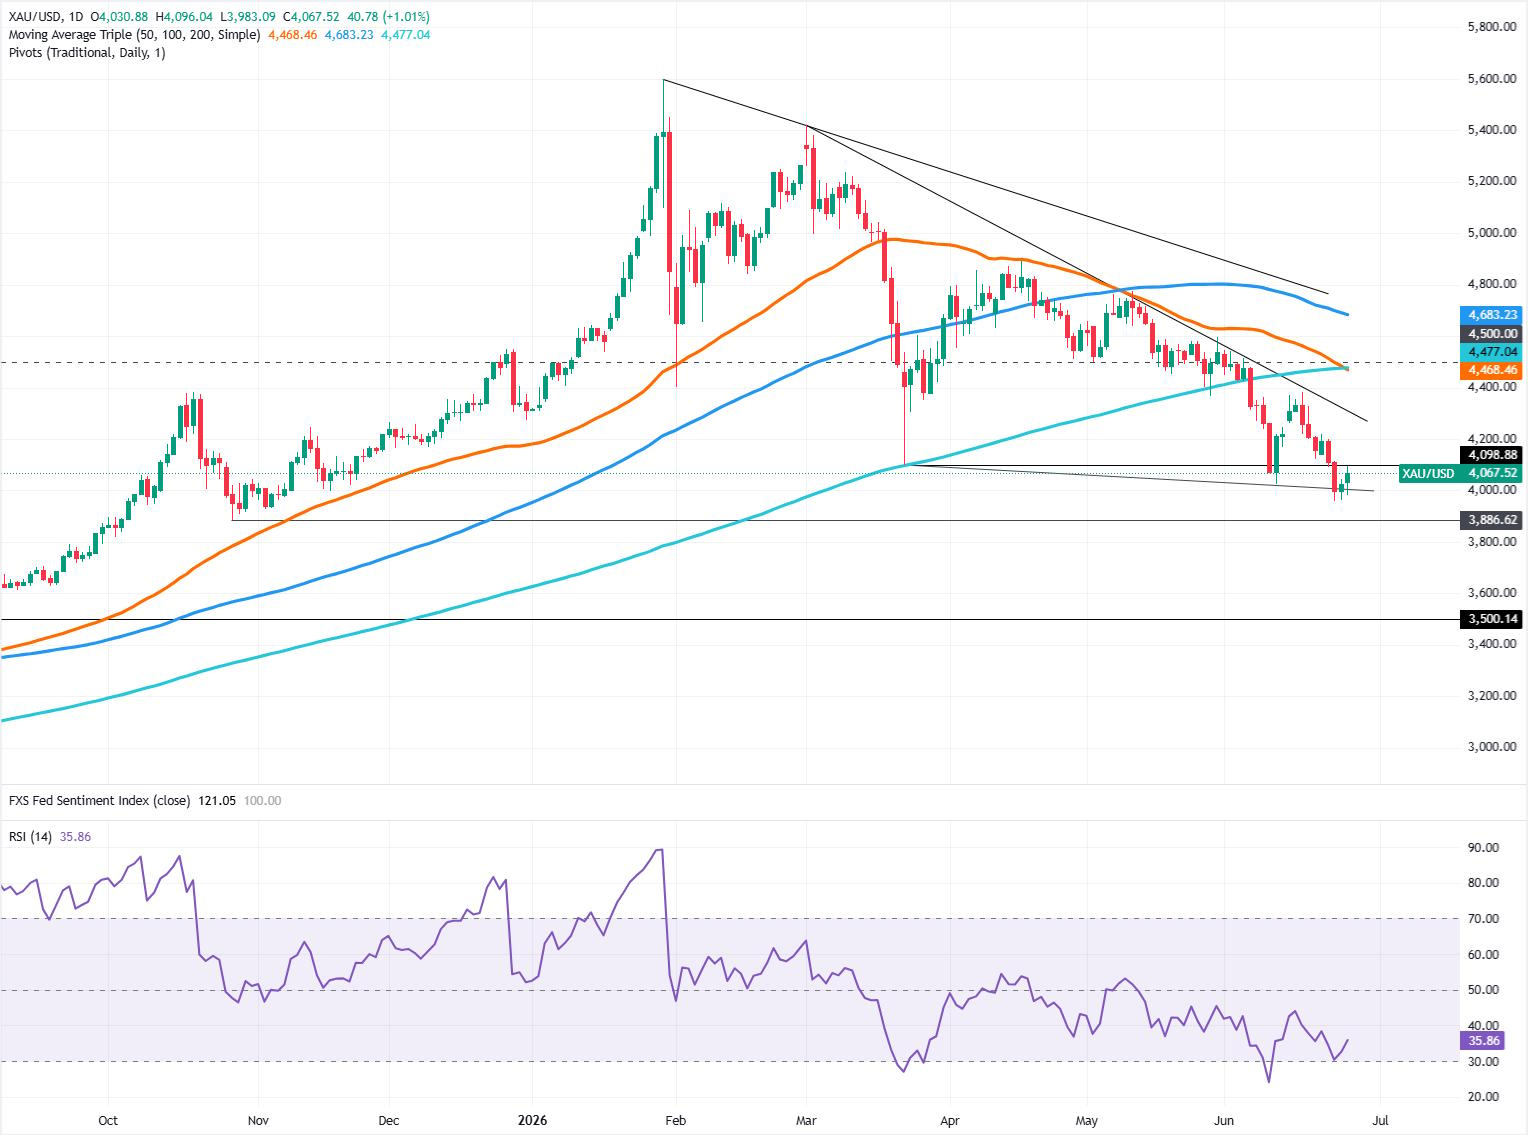
EUR/USD extends its losses for the third successive day, trading around 1.1660 during the Asian hours. The daily chart technical analysis indicates a potential for a bearish reversal, as the pair has slipped below the ascending channel. The EUR/USD pair holds just under the 50-day EMA and the nine-day EMA, which together suggest a capped near-term tone despite the recent recovery from lower levels.
Australian Dollar edges higher ahead of Chinese PMI releases

The AUD/USD pair gathers strength to near 0.7130 during the early Asian session on Thursday. The Australian Dollar (AUD) edges higher against the US Dollar (USD) on hotter domestic inflation data. Traders brace for the release of the Chinese Purchasing Managers Index (PMI) data later on Thursday, which could give direction to the China-proxy Aussie.
Australia’s Consumer Price Index (CPI) climbed by 4.6% year-over-year (YoY) in March, versus a 3.7% increase prior, the Australian Bureau of Statistics (ABS) revealed on Wednesday.
While the figure was slightly below the 4.7% forecast, it remains well above the Reserve Bank of Australia’s (RBA) target range, keeping pressure on the central bank to hike rates. This, in turn, provides some support to the AUD against the USD. The monthly CPI came in at 1.1% in March, compared to the previous reading of 0%.
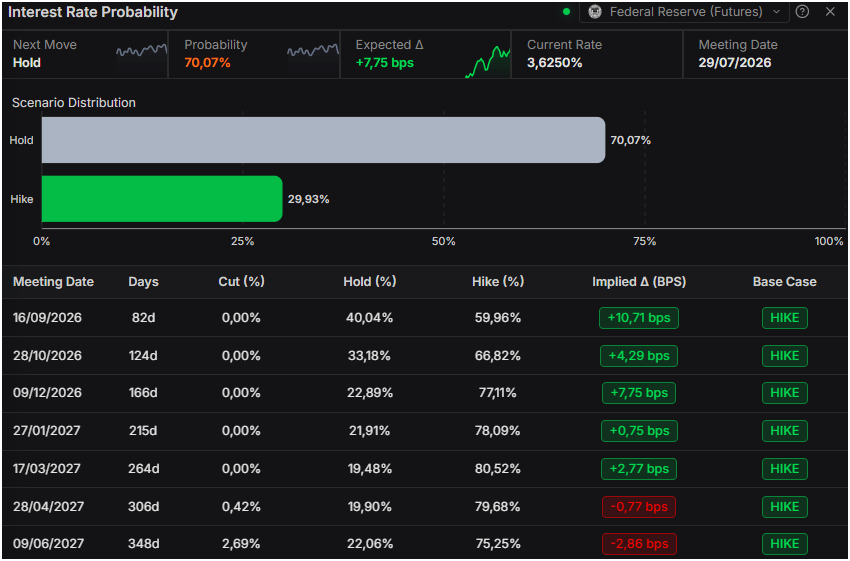
The Federal Open Market Committee (FOMC) on Wednesday voted 8-4 to hold rates in a range of 3.5% to 3.75%. That marked the first time four FOMC members dissented since October 1992. The committee noted that “inflation is elevated, in part reflecting the recent increase in global energy prices.”
Fed Chair Jerome Powell said during a press conference that he will continue to serve as a Fed governor for an indefinite period even after his chairmanship ends. Kevin Warsh, Trump’s nominated successor, appears on track to take over for Powell at the central bank.
Australian Dollar FAQs
One of the most significant factors for the Australian Dollar (AUD) is the level of interest rates set by the Reserve Bank of Australia (RBA). Because Australia is a resource-rich country another key driver is the price of its biggest export, Iron Ore. The health of the Chinese economy, its largest trading partner, is a factor, as well as inflation in Australia, its growth rate and Trade Balance. Market sentiment – whether investors are taking on more risky assets (risk-on) or seeking safe-havens (risk-off) – is also a factor, with risk-on positive for AUD.
The Reserve Bank of Australia (RBA) influences the Australian Dollar (AUD) by setting the level of interest rates that Australian banks can lend to each other. This influences the level of interest rates in the economy as a whole. The main goal of the RBA is to maintain a stable inflation rate of 2-3% by adjusting interest rates up or down. Relatively high interest rates compared to other major central banks support the AUD, and the opposite for relatively low. The RBA can also use quantitative easing and tightening to influence credit conditions, with the former AUD-negative and the latter AUD-positive.
China is Australia’s largest trading partner so the health of the Chinese economy is a major influence on the value of the Australian Dollar (AUD). When the Chinese economy is doing well it purchases more raw materials, goods and services from Australia, lifting demand for the AUD, and pushing up its value. The opposite is the case when the Chinese economy is not growing as fast as expected. Positive or negative surprises in Chinese growth data, therefore, often have a direct impact on the Australian Dollar and its pairs.
Iron Ore is Australia’s largest export, accounting for $118 billion a year according to data from 2021, with China as its primary destination. The price of Iron Ore, therefore, can be a driver of the Australian Dollar. Generally, if the price of Iron Ore rises, AUD also goes up, as aggregate demand for the currency increases. The opposite is the case if the price of Iron Ore falls. Higher Iron Ore prices also tend to result in a greater likelihood of a positive Trade Balance for Australia, which is also positive of the AUD.
The Trade Balance, which is the difference between what a country earns from its exports versus what it pays for its imports, is another factor that can influence the value of the Australian Dollar. If Australia produces highly sought after exports, then its currency will gain in value purely from the surplus demand created from foreign buyers seeking to purchase its exports versus what it spends to purchase imports. Therefore, a positive net Trade Balance strengthens the AUD, with the opposite effect if the Trade Balance is negative.
Ethereum Price Forecast: ETH eyes decline to $2,200 as Fed hawkish tone weighs
Ethereum price today: $2,230
- Ethereum has declined toward $2,200 after the Fed left interest rates unchanged at 3.50-3.75% and showed a hawkish bias.
- Exchange reserves have risen by over 226K ETH since the beginning of the week amid declining US interest.
- ETH could find support near $2,211 after breaching the 20-day and 50-day EMAs.
Ethereum (ETH) declines below $2,300 on Wednesday after the US Federal Reserve’s (Fed) decided to hold interest rates steady at 3.50%-3.75% and signaled increasing internal division over any upcoming interest-rate cuts.
The decision came after a split among committee members, with an 8-4 vote in favor of the move. Three regional bank presidents pushed to remove the inclusion of “easing bias” from the central bank’s statement, signaling that there is more and more resistance to further interest-rate cuts. Such outlook doesn’t favor risk assets like crypto.
The Fed’s decision comes as ETH faces rising selling pressure.
The Ethereum Exchange Reserve, which measures the total number of coins held in exchanges, has been on an uptrend since the beginning of the week. Over the past three days, reserves have risen by roughly 226,000 ETH, indicating rising selling pressure.

The rising exchange deposits are also evident in several transactions highlighted by smart money tracker Lookonchain. Wallets linked to Fenbushi Capital and Genesis Trading have offloaded ETH to exchanges over the past 24 hours.
Notably, a participant in Ethereum’s initial coin offering (ICO) moved 10,000 ETH to a new wallet after it had remained dormant for nearly 11 years.
The activity marks the continuation of a distribution pattern retail investors began last week, after offloading over 750,000 ETH.
US interest weakens alongside decline in staking flows
The Coinbase Premium Index, an indicator of US investors’ interest, also slipped into negative territory during the period, signaling that traders in the region are becoming cautious. US spot ETH exchange-traded funds (ETFs) align with the negative sentiment, posting two consecutive days of net outflows since the beginning of the week, according to SoSoValue data.
The weakness has also filtered into the total staked ETH supply, which has halted its uptrend over the past week, resulting in a decline of 140,000 ETH. The validator exit queue has also risen from below 1000 to above 414,000 ETH, a negative signal.

However, the entry queue is also rising, growing by over 600,000 ETH in the past week. A key driver of the increase is Ethereum treasury firm BitMine Immersion Technologies (BMNR).
The firm staked an additional 106,200 ETH on Tuesday, according to Lookonchain. Earlier on Monday, it reported holdings of 5.078 million ETH, of which it had staked 3.7 million.
Ethereum Price Forecast: ETH breaches 20-day and 50-day EMAs, eyes $2,211 support
Ethereum has seen $149.7 million in liquidations over the past 24 hours, driven by $110.3 million in liquidated long positions.
On the daily chart, ETH has slipped below the 20-day, 50-day and 100-day Exponential Moving Averages (EMAs) at $2,287, $2,242 and $2,366, respectively, keeping a bearish near-term tone.
Momentum metrics reinforce this corrective bias, with the 14-day Relative Strength Index (RSI) falling to a neutral-to-soft 47 and the Stochastic Oscillator (Stoch) sinking into oversold territory. The move hints that while downside pressure persists, the sell-off could start to lose intensity.
On the downside, immediate support emerges at the horizontal level around $2,211, ahead of a stronger floor near $2,107. A break there would expose the prior base zones at $1,909 and $1,741.
On the topside, initial resistance is seen at the 20-day and 100-day EMAs, while a sustained move above the horizontal barrier at $2,388 would be needed to ease the current bearish bias and open the way toward higher resistance levels at $2,746 and $3,411.
(The technical analysis of this story was written with the help of an AI tool.)
Federal Reserve to remain on hold, shrugging off political pressure to cut rates
The United States (US) Federal Reserve (Fed) announces its interest rate decision on Wednesday, another pivotal meeting for markets to gauge the stance of policymakers as energy prices remain uncomfortably high amid ongoing uncertainty in the Middle East, putting the Fed’s dual mandate under strain.

Markets widely expect the Federal Open Market Committee (FOMC) to keep interest rates unchanged in the range of 3.5%-3.75% for the third consecutive meeting in April.
As this decision is fully priced in, Fed Chair Jerome Powell’s comments in his last post-meeting press conference, given his term ends in over two weeks, could offer key clues on the policy outlook and drive the US Dollar’s (USD) performance.
Republican Senator Thom Tillis, who took a stance to block any Fed Chair nominee while the probe into Jerome Powell remained open, announced that he is prepared to move on with the confirmation of Kevin Warsh after the Department of Justice dropped the investigation on Friday. Warsh is now widely expected to become the US central bank’s new chair from May 15, when Powell’s current term ends.
The CME FedWatch Tool shows that investors see little to no chance of a rate cut at least until September, while pricing in about an 80% probability that interest rates will remain where they currently are by end-2026. Earlier in the year, there were strong expectations of multiple interest rate reductions, but surging Oil prices and the potential impact on global inflation caused investors to reassess their outlooks.

The revised Summary of Economic Projections (SEP) published in March showed that policymakers’ median projection pointed to a 25 basis points (bps) cut this year, unchanged from the SEP published in December 2025. However, the minutes of the March meeting highlighted that many participants saw risk of inflation remaining elevated for longer than expected amid persistent Oil price increase, which could even call for rate hikes.
TD Securities analysts note they expect the Fed policy rate to remain unchanged in April. “The labor market remains balanced, while headline inflation has ticked up owing to the oil shock. With uncertainty still high, the Committee will likely reiterate patience. Powell is likely to stay neutral on policy and avoid new comments on succession, despite this being originally slated as his final meeting,” they explain.
Economic Indicator
Fed Monetary Policy Statement
Following the Federal Reserve’s (Fed) rate decision, the Federal Open Market Committee (FOMC) releases its statement regarding monetary policy. The statement may influence the volatility of the US Dollar (USD) and determine a short-term positive or negative trend. A hawkish view is considered bullish for USD, whereas a dovish view is considered negative or bearish.
Next release: Wed Apr 29, 2026 18:00
Frequency: Irregular
Consensus: –
Previous: –
Source: Federal Reserve
When will the Fed announce its interest rate decision and how could it affect EUR/USD?
The Fed is scheduled to announce its interest rate decision and publish the monetary policy statement at 18:00 GMT. This will be followed by Fed Chair Jerome Powell’s press conference starting at 18:30 GMT.
The rate decision itself is unlikely to trigger a significant market reaction, but investors will scrutinize Fed Chair Powell’s remarks.
Powell is likely to reiterate that they need more time and data to assess whether high inflation will persist. Until now, Powell has refrained from hinting at a potential rate hike. In case he notes that option could be on the table in future meetings if the Middle East conflict prolongs and keeps Oil prices elevated, the immediate market reaction could help the USD gather strength against its rivals.
Although markets remain cautiously optimistic about a permanent truce between the US and Iran, the ongoing blockade of Iranian ports by the US military and Tehran’s reluctance to progress with negotiations until the blockade is removed don’t allow Oil prices to return to pre-war levels. The barrel of West Texas Intermediate (WTI), which was trading at around $65 before the US and Israel attacked Iran on February 28, seems to have settled above $90.
Conversely, market participants could start pricing in a September rate cut if Powell notes that the Fed will need to tilt its focus back to supporting the labor market once the situation in the Middle East is resolved. Investors could also assess Powell’s tone as being dovish if he pushes back against policy-tightening expectations and sounds optimistic about inflation quickly softening again, driven by a correction in Oil prices. In this scenario, the USD could come under selling pressure and pave the way for a bullish action in EUR/USD in the near term.
“We expect Fed Chair Powell to reiterate that the Fed’s current policy stance is appropriate, implying a high bar to resume easing. Watch out to see if Powell confirms any discussion on the next move being a hike,” BBH analysts note.
“Remember, the FOMC March meeting minutes highlighted that ‘many’ participants would favor rate increases to help bring inflation down to the 2% target in case of a lengthy war,” they further highlight.
Eren Sengezer, European Session Lead Analyst at FXStreet, provides a short-term technical outlook for EUR/USD:
“The technical outlook points to a lack of bullish momentum in the short term. EUR/USD trades slightly above the mid-line of Bollinger Bands and holds above the 100-day and the 200-day Simple Moving Averages (SMA). Additionally, the Relative Strength Index (RSI) indicator on the daily chart moves sideways slightly above 50.”
“On the upside, 1.1800 (Fibonacci 61.8% retracement of the February-April downtrend) aligns as the next resistance level before 1.1870 (upper Bollinger Band) and 1.1900-1.1910 (round level, Fibonacci 78.6% retracement). In case the pair drops below the 1.1700-1.1680 region, where the 100-day and the 200-day SMAs align, and settles there, technical sellers could show interest. In this case, the next important support level could be spotted at 1.1560 (Fibonacci 23.6% retracement) before 1.1500 (static level, round level).”

US Dollar FAQs
The US Dollar (USD) is the official currency of the United States of America, and the ‘de facto’ currency of a significant number of other countries where it is found in circulation alongside local notes. It is the most heavily traded currency in the world, accounting for over 88% of all global foreign exchange turnover, or an average of $6.6 trillion in transactions per day, according to data from 2022.
Following the second world war, the USD took over from the British Pound as the world’s reserve currency. For most of its history, the US Dollar was backed by Gold, until the Bretton Woods Agreement in 1971 when the Gold Standard went away.
The most important single factor impacting on the value of the US Dollar is monetary policy, which is shaped by the Federal Reserve (Fed). The Fed has two mandates: to achieve price stability (control inflation) and foster full employment. Its primary tool to achieve these two goals is by adjusting interest rates.
When prices are rising too quickly and inflation is above the Fed’s 2% target, the Fed will raise rates, which helps the USD value. When inflation falls below 2% or the Unemployment Rate is too high, the Fed may lower interest rates, which weighs on the Greenback.
In extreme situations, the Federal Reserve can also print more Dollars and enact quantitative easing (QE). QE is the process by which the Fed substantially increases the flow of credit in a stuck financial system.
It is a non-standard policy measure used when credit has dried up because banks will not lend to each other (out of the fear of counterparty default). It is a last resort when simply lowering interest rates is unlikely to achieve the necessary result. It was the Fed’s weapon of choice to combat the credit crunch that occurred during the Great Financial Crisis in 2008. It involves the Fed printing more Dollars and using them to buy US government bonds predominantly from financial institutions. QE usually leads to a weaker US Dollar.
Quantitative tightening (QT) is the reverse process whereby the Federal Reserve stops buying bonds from financial institutions and does not reinvest the principal from the bonds it holds maturing in new purchases. It is usually positive for the US Dollar.
United States MBA Mortgage Applications fell from previous 7.9% to -1.6% in April 24
Gold remains depressed below the $4,600 mark heading into the European session, though bears seem hesitant and opt to wait for the crucial FOMC policy decision, due to be announced later this Wednesday. The key focus will be on the post-meeting press conference, where comments from the outgoing US Federal Reserve Chair Jerome Powell will be scrutinized for cues about the future policy path.
Oil: UAE exit reshapes supply outlook – Commerzbank

Commerzbank’s Dr. Henry Hao and Charlie Lay note Brent and WTI extended gains as the United Arab Emirates announced it will leave OPEC (Organization of Petroleum Exporting Countries) on 1 May, after years of tension with Saudi Arabia over output policy. They highlight that the ongoing war and blockade of the Strait of Hormuz are already constraining Persian Gulf exports, so immediate market impacts from the UAE’s exit may stay limited.
UAE departure supports higher prices
“Meanwhile, energy markets faced a historic shakeup as the United Arab Emirates (UAE) announced it will leave OPEC next month. The exit on 1 May culminates years of tension with Saudi Arabia over oil output policy and regional influence.”
“Energy Minister Suhail Al Mazrouei indicated that the disruption caused by the current war created an opportune time for the departure. He said “This is a decision that we took after a very careful and long review of all our strategies”.”
“Despite the UAE’s announcement, immediate market impacts from the exit will likely be limited since the ongoing conflict continues to throttle exports from the Persian Gulf.”
“Brent crude oil prices rose 2.8% to above USD111. It gained for a seventh consecutive session on lingering concerns grow over the protracted peace process.”
(This article was created with the help of an Artificial Intelligence tool and reviewed by an editor.)
Australian Dollar drifts lower after CPI report; focus shifts to Fed decision

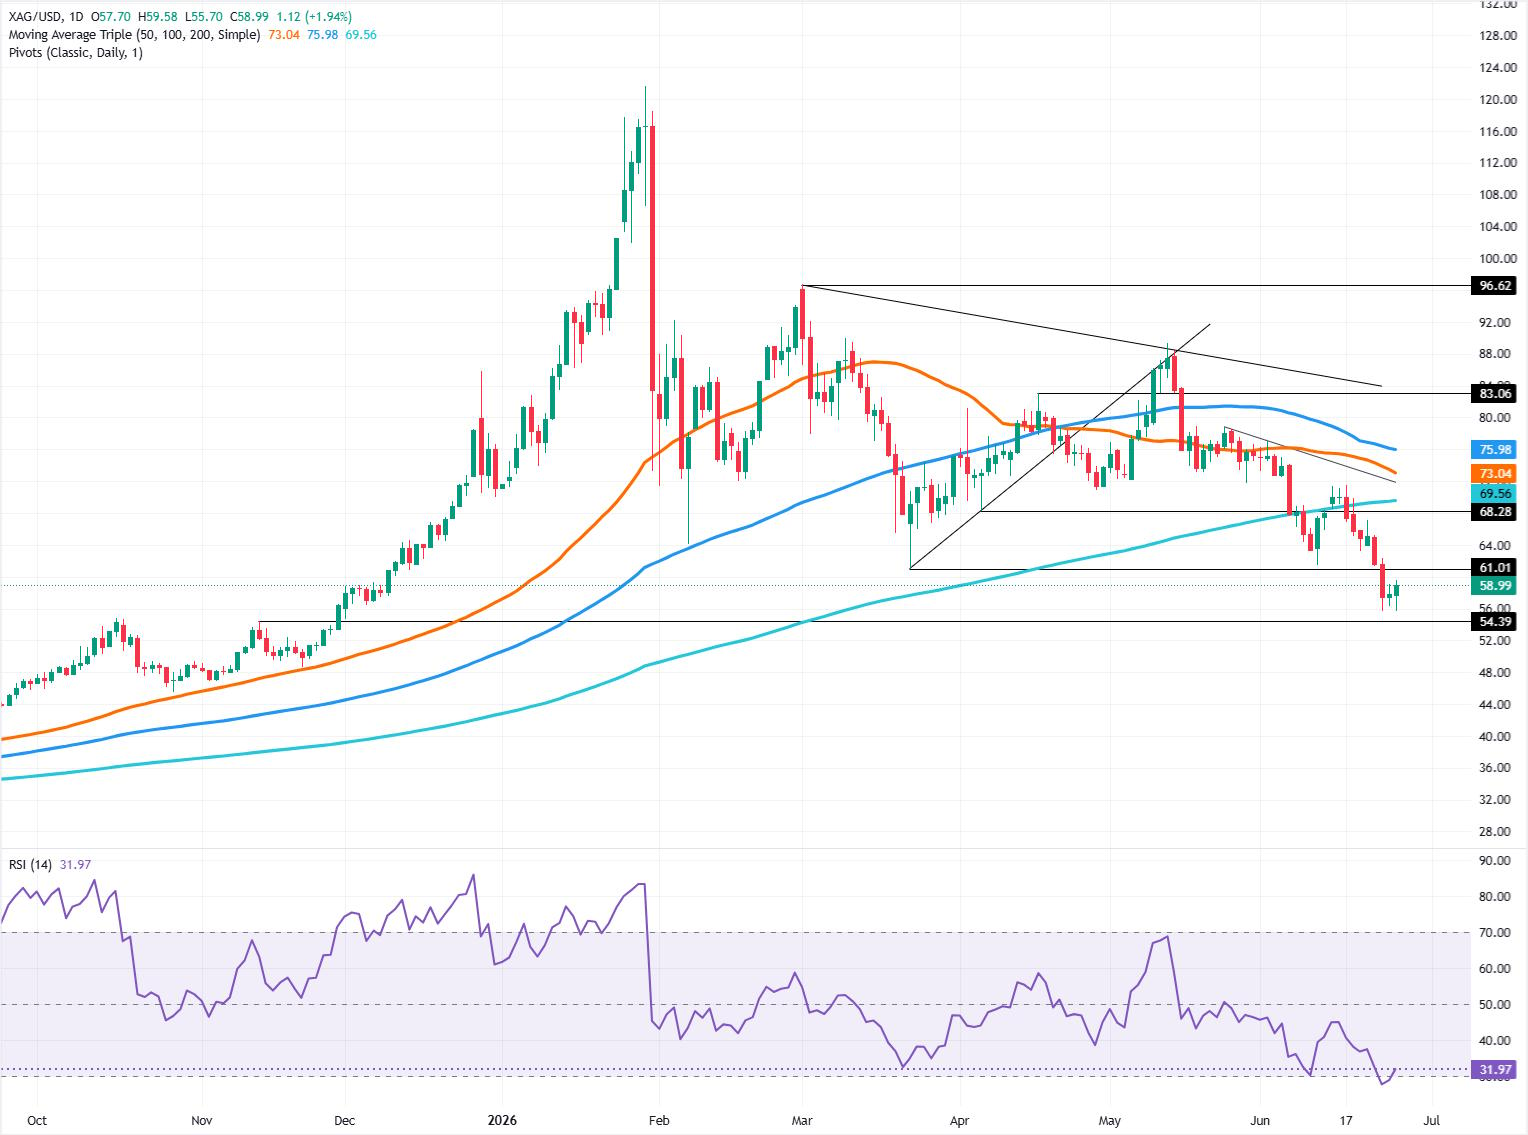
The AUD/USD pair continues with its struggle to conquer the 0.7200 mark and drifts lower following the release of Australian consumer inflation figures during the Asian session on Wednesday. Spot prices slide to the 0.7170 area in the last hour, though the downside potential seems limited ahead of the crucial FOMC policy decision later today.
The Australian Bureau of Statistics (ABS) reported that the headline Consumer Price Index (CPI) rose by 1.4% in Q1, lifting the annual rate to 4.1%. Additional details revealed that the Trimmed Mean CPI rose climbed 0.3% during the January-March period and 3.5% over the year. In the absence of a major surprise from the inflation data, the Australian Dollar (AUD) attracts some sellers amid the cautious market mood due to persistent geopolitical uncertainties.
Meanwhile, the latest data does little to dampen hawkish Reserve Bank of Australia (RBA) expectations. In fact, traders are pricing in a greater chance of a 25-basis-point (bps) rate hike at the upcoming RBA meeting in May. This, along with subdued US Dollar (USD) price action, offers some support to the AUD/USD pair and helps limit the downside. Traders also seem reluctant and opt to wait for the highly anticipated FOMC policy decision, due later today.
Investors will look for cues about the US Federal Reserve’s (Fed) future policy path amid worries that the war-driven surge in energy prices will revive inflationary pressures. In the meantime, the lack of progress in US-Iran peace talks and a standoff over the Strait of Hormuz might continue to underpin the USD’s reserve currency status. This should cap the AUD/USD pair and warrants some caution before positioning for an extension of a one-month-old uptrend.
Economic Indicator
Quarterly Consumer Price Index (YoY)
The Consumer Price Index (CPI), released by the Australian Bureau of Statistics on a quarterly basis, measures the changes in the price of a fixed basket of goods and services acquired by household consumers. The quarterly CPI data series are calculated as the average of the three relevant monthly CPIs. The YoY reading compares prices in the reference quarter to the same quarter a year earlier. A high reading is seen as bullish for the Australian Dollar (AUD), while a low reading is seen as bearish.
Ireland Consumer Confidence dipped from previous 56.7 to 53.3 in April
Information on these pages contains forward-looking statements that involve risks and uncertainties. Markets and instruments profiled on this page are for informational purposes only and should not in any way come across as a recommendation to buy or sell in these assets. You should do your own thorough research before making any investment decisions. FXStreet does not in any way guarantee that this information is free from mistakes, errors, or material misstatements. It also does not guarantee that this information is of a timely nature. Investing in Open Markets involves a great deal of risk, including the loss of all or a portion of your investment, as well as emotional distress. All risks, losses and costs associated with investing, including total loss of principal, are your responsibility. The views and opinions expressed in this article are those of the authors and do not necessarily reflect the official policy or position of FXStreet nor its advertisers. The author will not be held responsible for information that is found at the end of links posted on this page.
If not otherwise explicitly mentioned in the body of the article, at the time of writing, the author has no position in any stock mentioned in this article and no business relationship with any company mentioned. The author has not received compensation for writing this article, other than from FXStreet.
FXStreet and the author do not provide personalized recommendations. The author makes no representations as to the accuracy, completeness, or suitability of this information. FXStreet and the author will not be liable for any errors, omissions or any losses, injuries or damages arising from this information and its display or use. Errors and omissions excepted.
The author and FXStreet are not registered investment advisors and nothing in this article is intended to be investment advice.
EUR/USD rebounds as Fed decision nears and US-Iran tensions cap Dollar downside

The Euro (EUR) trims a part of its intraday losses against the US Dollar (USD) on Tuesday as the Greenback loses momentum, with traders repositioning ahead of the Federal Reserve’s interest rate decision due on Wednesday while continuing to monitor developments in the Middle East. At the time of writing, EUR/USD is trading around 1.1707, rebounding from an intraday low of 1.1677.
Meanwhile, the US Dollar Index (DXY), which tracks the Greenback’s value against a basket of six major currencies, is trading around 98.66, easing from 98.88 up nearly 0.18% on the day. However, the downside remains limited amid persistent uncertainty surrounding US-Iran tensions and firm US Treasury yields, which continue to underpin the Dollar.
The Fed is widely expected to keep interest rates unchanged in the 3.50%-3.75% range, with the outcome largely priced in by markets. Instead, the focus will be on forward guidance, as policymakers navigate risks to both sides of their dual mandate. The recent surge in Oil prices is feeding into inflation expectations, a trend increasingly reflected in recent economic data. This has prompted traders to shift toward a higher-for-longer rate outlook, compared with earlier expectations of two rate cuts before the US-Iran war escalated.
At the same time, traders are pricing in at least two rate hikes by the European Central Bank (ECB) amid mounting inflation risks from higher Oil prices, although the central bank is expected to hold rates steady at 2.00% at Thursday’s meeting as policymakers balance persistent inflation pressures against risks to economic growth, particularly given the Eurozone’s reliance on imported energy.
ECB Bank Lending Survey for the first quarter of 2026, released on Tuesday, showed inflation expectations rising across horizons. Inflation expectations one year ahead rose sharply to 4.0% in March from 2.5% in February, while expectations three years ahead increased to 3.0% from 2.5%, and five-year expectations edged up to 2.4% from 2.3%.
On the geopolitical front, efforts to end the US-Iran war appear to have stalled, with the Strait of Hormuz still largely disrupted, keeping Oil supply tight. Iran is expected to submit a revised peace proposal in the coming days, according to CNN, citing sources, after US President Donald Trump and his national security team expressed skepticism over Tehran’s earlier offer, which deferred nuclear negotiations to a later stage.
Economic Indicator
Fed Interest Rate Decision
The Federal Reserve (Fed) deliberates on monetary policy and makes a decision on interest rates at eight pre-scheduled meetings per year. It has two mandates: to keep inflation at 2%, and to maintain full employment. Its main tool for achieving this is by setting interest rates – both at which it lends to banks and banks lend to each other. If it decides to hike rates, the US Dollar (USD) tends to strengthen as it attracts more foreign capital inflows. If it cuts rates, it tends to weaken the USD as capital drains out to countries offering higher returns. If rates are left unchanged, attention turns to the tone of the Federal Open Market Committee (FOMC) statement, and whether it is hawkish (expectant of higher future interest rates), or dovish (expectant of lower future rates).
Next release: Wed Apr 29, 2026 18:00
Frequency: Irregular
Consensus: 3.75%
Previous: 3.75%
Source: Federal Reserve
Ripple Price Forecast: XRP risks bearish shift as price drops below $1.40
Ripple (XRP) is edging lower below $1.40 at the time of writing on Tuesday, as the broader crypto market faces renewed volatility. The remittance token is under intense sell-side pressure and struggling to hold key support levels amid growing risk-off sentiment.
The conflict in the Middle East continues to drive investors on edge, while the crypto Fear & Greed Index declines to 33 on Tuesday, from 47 the previous day. Despite the United States (US)-Iran ceasefire holding, the Strait of Hormuz is still shut.
Reports say that US President Donald Trump is unlikely to accept Iran’s proposal to open the Strait, which skips Tehran’s nuclear program. Dismantling Iran’s nuclear program remains to be Trump’s hardline point to ending the war.

Risk-off sentiment persists amid muted ETF activity
Institutional interest in XRP digital investment products shows signs of deterioration, as ETFs remained quiet on Monday, with no flows recorded, according to SoSoValue data. Cumulative inflows held at $1.29 billion, while net assets under management averaged $1.06 billion. If sentiment softens further amid deteriorating risk appetite, recovery for XRP could be an uphill battle.

Despite retail demand holding steady with the futures Open Interest (OI) at $2.57 billion, it pales in comparison to the record $10.94 billion reached in July. Low retail demand signals that investors lack conviction in XRP’s ability to sustain the uptrend. Hence, there is an unwillingness to open new positions.

Technical outlook: XRP at risk of extending losses
XRP trades at $1.38, maintaining a bearish near-term bias. The price holds below the 20-day Simple Moving Average (SMA) of the Bollinger Bands around $1.40 and the 50-day Exponential Moving Average near $1.41, confirming a broader bearish outlook.
The Relative Strength Index (RSI) sits just below the 50 midline, around 47 on the daily chart, while the Moving Average Convergence Divergence (MACD) histogram has slipped marginally back below zero, with the signal line turning down. Both indicators suggest waning upside momentum as rallies meet overhead supply.

On the topside, initial resistance is aligned at the Bollinger Bands’ middle boundary at $1.40, followed by the 50-day EMA around $1.41. A stronger recovery would face further caps at the upper Bollinger Band near $1.48, then at the 100-day EMA at $1.53, and the 200-day EMA near $1.75, reasserting the broader bearish structure. On the downside, the lower Bollinger Band at roughly $1.32 serves as the next notable support, with a sustained break below it likely opening the door to deeper losses within the prevailing daily downtrend.
(The technical analysis of this story was written with the help of an AI tool.)
Crypto ETF FAQs
An Exchange-Traded Fund (ETF) is an investment vehicle or an index that tracks the price of an underlying asset. ETFs can not only track a single asset, but a group of assets and sectors. For example, a Bitcoin ETF tracks Bitcoin’s price. ETF is a tool used by investors to gain exposure to a certain asset.
Yes. The first Bitcoin futures ETF in the US was approved by the US Securities & Exchange Commission in October 2021. A total of seven Bitcoin futures ETFs have been approved, with more than 20 still waiting for the regulator’s permission. The SEC says that the cryptocurrency industry is new and subject to manipulation, which is why it has been delaying crypto-related futures ETFs for the last few years.
Yes. The SEC approved in January 2024 the listing and trading of several Bitcoin spot Exchange-Traded Funds, opening the door to institutional capital and mainstream investors to trade the main crypto currency. The decision was hailed by the industry as a game changer.
The main advantage of crypto ETFs is the possibility of gaining exposure to a cryptocurrency without ownership, reducing the risk and cost of holding the asset. Other pros are a lower learning curve and higher security for investors since ETFs take charge of securing the underlying asset holdings. As for the main drawbacks, the main one is that as an investor you can’t have direct ownership of the asset, or, as they say in crypto, “not your keys, not your coins.” Other disadvantages are higher costs associated with holding crypto since ETFs charge fees for active management. Finally, even though investing in ETFs reduces the risk of holding an asset, price swings in the underlying cryptocurrency are likely to be reflected in the investment vehicle too.