EUR/USD now loses some traction and slips back to the area of daily lows around 1.1630 on the back of a mild bounce in the US Dollar. Fresh US data, including the September PCE inflation numbers and the latest read on December consumer sentiment, didn’t really move the needle, so the pair is still on course to finish the week with a respectable gain.
Bitcoin Weekly Forecast: BTC slips under $90K, no santa rally in sight
Bitcoin traders are counting on a year-end rally, awaiting a return above the $100,000 milestone. Bitcoin-based investment products are struggling with declining inflows and weaker institutional demand, relative to the beginning of the year.
As institutional inflows dry up, the market is clear that despite the expectations of rate-cuts and other positive regulatory developments, Bitcoin’s rally is likely close to the end. In this analysis we identify three key catalysts that could drive BTC price higher and identify key levels to watch next week.
Bitcoin’s top three catalysts
Bitcoin holders are watching these three factors closely to identify the next spike in BTC price: Institutional capital inflows to Spot Bitcoin ETFs in the US, Bitcoin dominance and net profit/loss realized by traders.
Institutional capital inflow
Bitcoin’s bull run was likely catalyzed by large institutional capital inflows to ETFs in the US. Giants like Strategy (formerly MicroStrategy) added Bitcoin to their balance sheets, inspiring the playbook among other corporate giants in the US. Institutional demand acted as a key catalyst driving Bitcoin to $100,000 and its all-time high above $126,000. Naturally, as the key players leave the market, institutional demand dries up and Bitcoin struggles to hold above key support at $90,000.
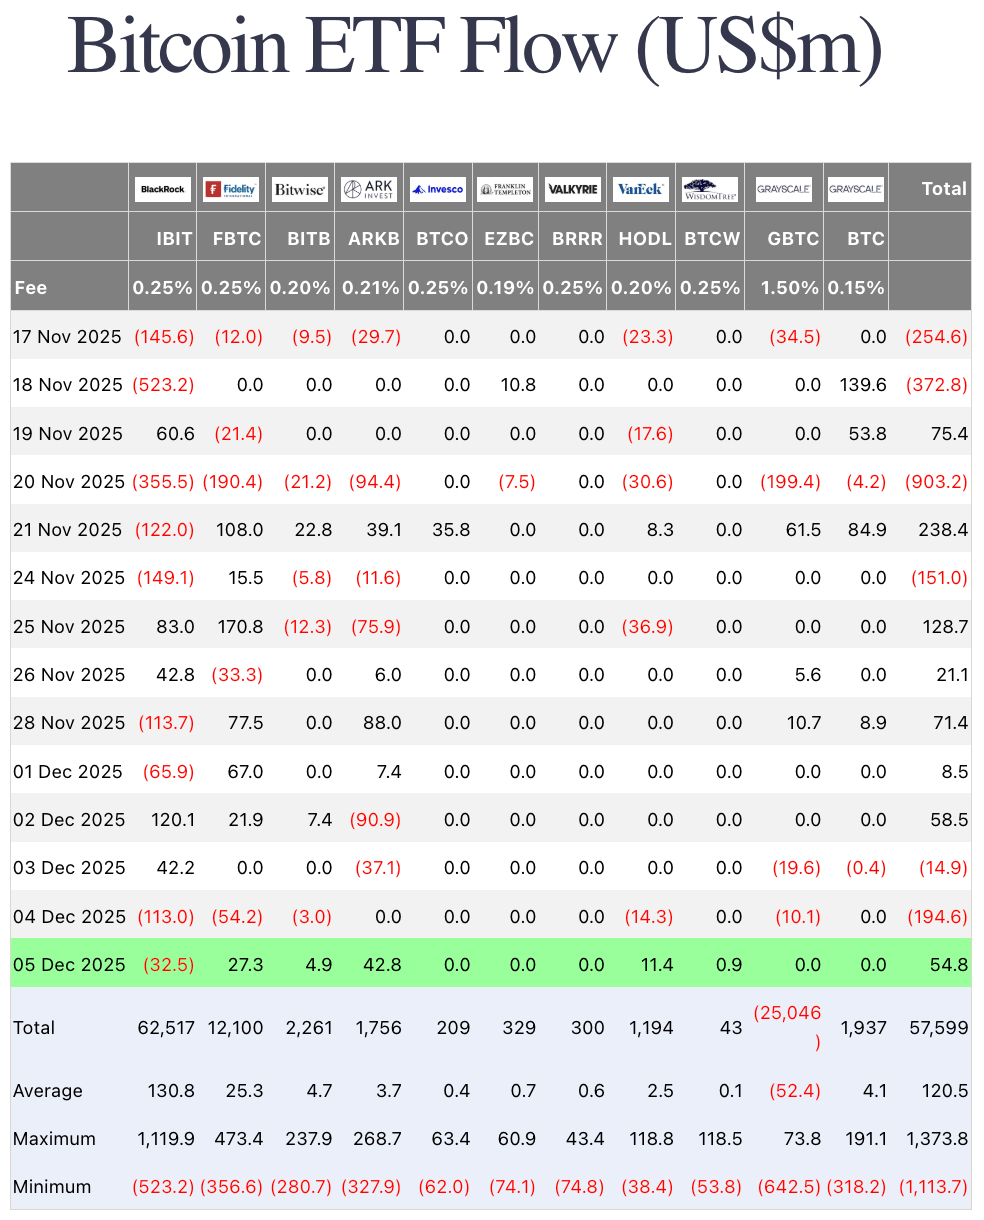
The $100,000 milestone was a support for Bitcoin for several months, the level has been flipped to a resistance and a decisive close above this level could signal a return of the bull market.
Data from Farside shows Bitcoin ETF flows. Nearly $250 million was pulled from Bitcoin ETFs in December.
As capital inflows reduce, other metrics that track Bitcoin’s relevance and demand, like Bitcoin dominance, note a decline.
Bitcoin dominance shrinks, end of the bull run?
Bitcoin dominance measures the relevance of BTC, against other tokens, altcoins in the market. As Bitcoin market capitalization reduces, down to $1.79 trillion on December 6, BTC dominance is in a decline. At the time of writing, Bitcoin dominance is below the 60% mark, 59.31%.
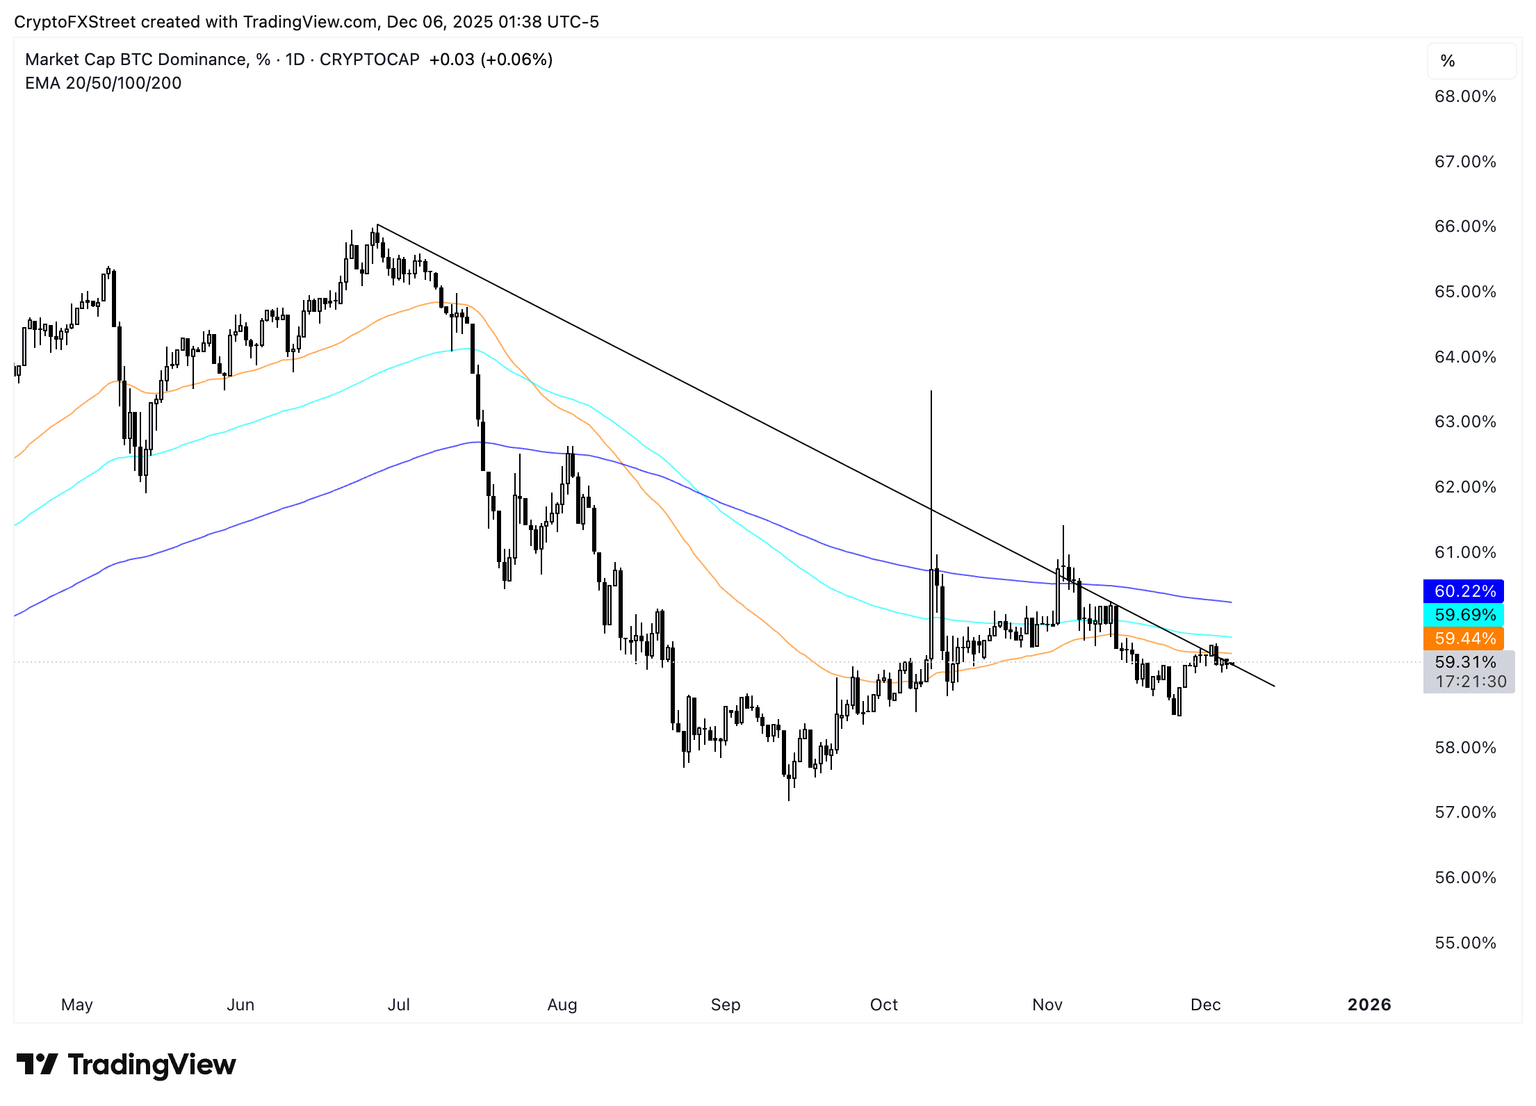
Dominance hovers above 59%, just as it did for the most part in the last two months. An increase in dominance could act as a catalyst for Bitcoin’s recovery.
Typically, decline in Bitcoin dominance signals the end of the bull run and it is followed by capital rotation into altcoins and other tokens in the market.
Traders sell Bitcoin at a loss
If there was one metric to help determine the state of the market, it would be the network realized profit/loss. The on-chain metric on Santiment tracks the net profit or loss realized by traders on a given day. Several days in November and December, the metric shows traders realizing losses, a sign of capitulation or increased selling pressure on Bitcoin.
Large negative spikes in the metric signal a change in Bitcoin price trend. After consistent profit-taking, traders are now realizing losses on their Bitcoin holdings, they likely anticipate further decline in BTC price.
%20%5B12-1765005475835-1765005475835.21.58%2C%2006%20Dec%2C%202025%5D.png&w=1536&q=95)
If a large volume of loss taking continues it could negatively impact the price in the weeks to come.
Besides the three catalysts, macroeconomic developments, rate-cut expectations influence Bitcoin price.
Bitcoin price analysis: Key levels to watch
Bitcoin is hovering above support at $83,828, a key level on the price chart. Two key resistance levels are R1 and R2 at $91,361, and $98,019 respectively. The $100,000 milestone is another key resistance for Bitcoin.
Bitcoin has been consolidating for over two weeks and it remains to be seen whether there will be a recovery or further decline. The two key momentum indicators on the daily BTC/USDT price chart show positive underlying momentum in Bitcoin price trend.
RSI reads 43, climbing towards neutral and MACD shows consecutive green histogram bars.
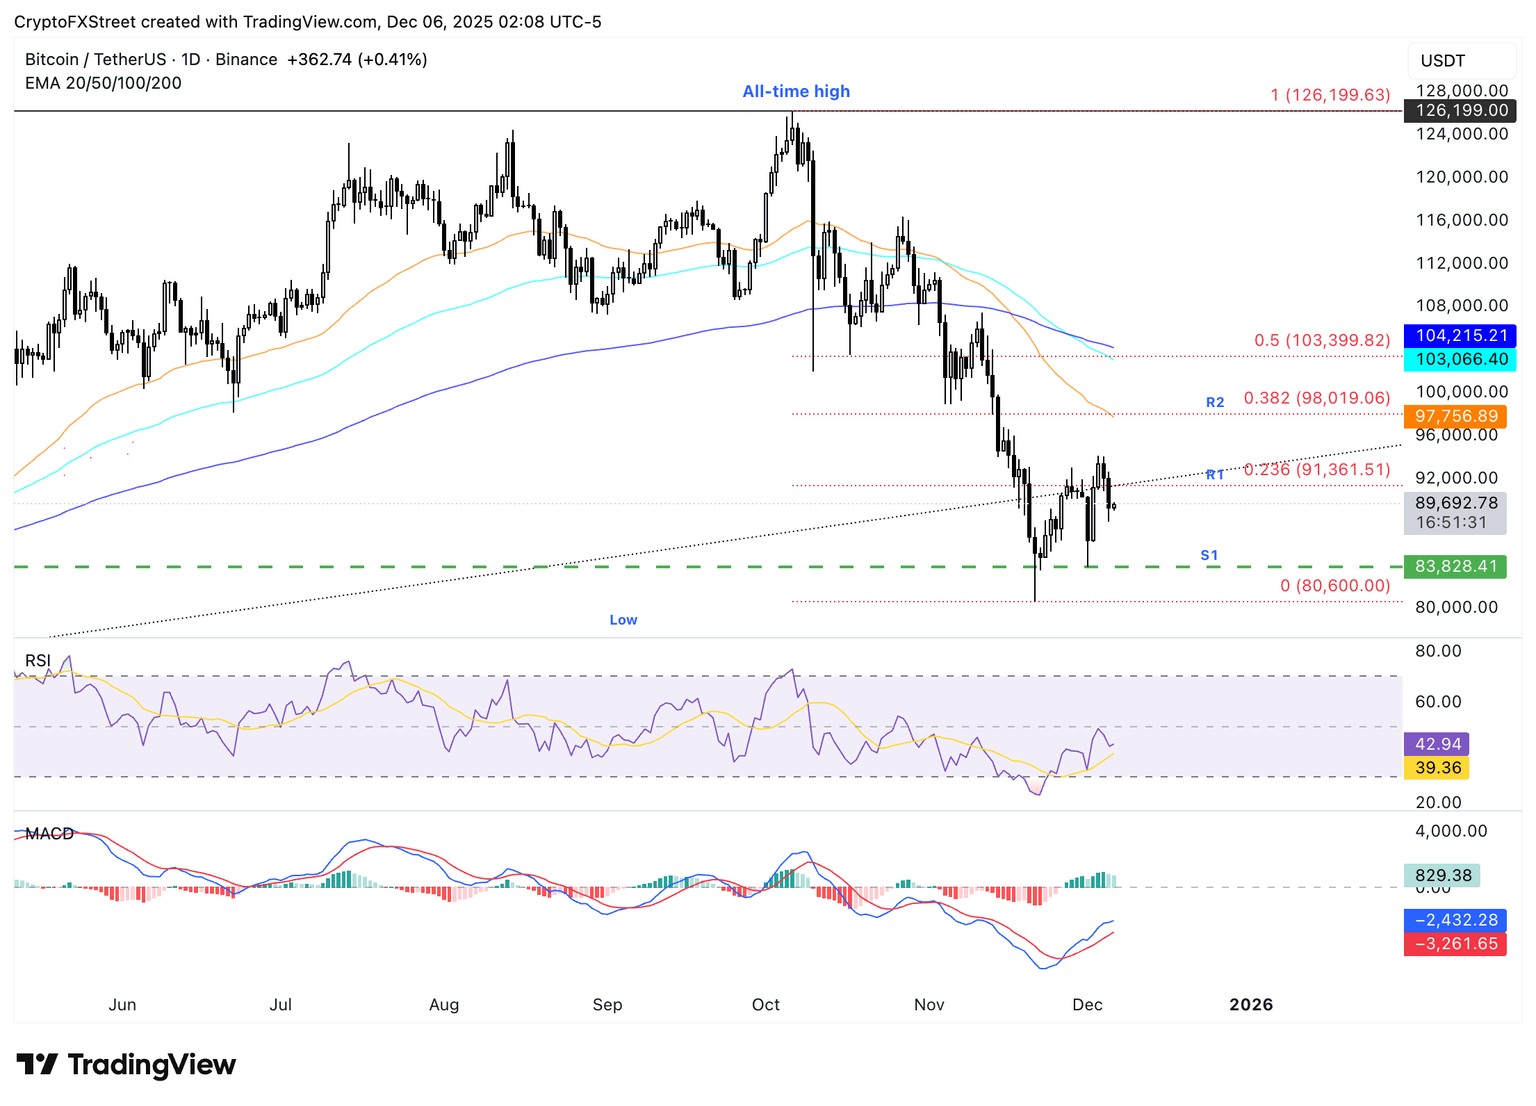
The three Exponential Moving Averages, at the 20,50 and 100 level come into play when Bitcoin sees a daily candlestick close above R2. A correction could send Bitcoin to test the $83,000 support.
Bitcoin, altcoins, stablecoins FAQs
Bitcoin is the largest cryptocurrency by market capitalization, a virtual currency designed to serve as money. This form of payment cannot be controlled by any one person, group, or entity, which eliminates the need for third-party participation during financial transactions.
Altcoins are any cryptocurrency apart from Bitcoin, but some also regard Ethereum as a non-altcoin because it is from these two cryptocurrencies that forking happens. If this is true, then Litecoin is the first altcoin, forked from the Bitcoin protocol and, therefore, an “improved” version of it.
Stablecoins are cryptocurrencies designed to have a stable price, with their value backed by a reserve of the asset it represents. To achieve this, the value of any one stablecoin is pegged to a commodity or financial instrument, such as the US Dollar (USD), with its supply regulated by an algorithm or demand. The main goal of stablecoins is to provide an on/off-ramp for investors willing to trade and invest in cryptocurrencies. Stablecoins also allow investors to store value since cryptocurrencies, in general, are subject to volatility.
Bitcoin dominance is the ratio of Bitcoin’s market capitalization to the total market capitalization of all cryptocurrencies combined. It provides a clear picture of Bitcoin’s interest among investors. A high BTC dominance typically happens before and during a bull run, in which investors resort to investing in relatively stable and high market capitalization cryptocurrency like Bitcoin. A drop in BTC dominance usually means that investors are moving their capital and/or profits to altcoins in a quest for higher returns, which usually triggers an explosion of altcoin rallies.
Colombia Consumer Price Index (YoY) below forecasts (5.45%) in November: Actual (5.3%)
EUR/USD now loses some traction and slips back to the area of daily lows around 1.1630 on the back of a mild bounce in the US Dollar. Fresh US data, including the September PCE inflation numbers and the latest read on December consumer sentiment, didn’t really move the needle, so the pair is still on course to finish the week with a respectable gain.
Colombia Consumer Price Index (MoM) came in at 0.07% below forecasts (0.2%) in November
EUR/USD now loses some traction and slips back to the area of daily lows around 1.1630 on the back of a mild bounce in the US Dollar. Fresh US data, including the September PCE inflation numbers and the latest read on December consumer sentiment, didn’t really move the needle, so the pair is still on course to finish the week with a respectable gain.
EUR/USD consolidates at 1.1650 as US inflation and ECB risks shape outlook
On Friday, the EUR/USD remained steady, poised to finish the week with gains of 0.39%, trade subsided capped by the 1.1650 figure as traders eyed the Federal Reserve’s decision next week.
Euro holds gains; US inflation and sentiment data shape market outlook
Economic data boosted the US Dollar, which trimmed some of its previous losses against the Euro. Inflation data in the US was mostly aligned with estimates, while Consumer Sentiment revealed by the University of Michigan (UoM) showed signs of improvement.
In the Eurozone, growth figures for the bloc showed the economy’s resilience with monthly data exceeding forecast. European Central Bank (ECB) Francois Villeroy said that the current position of the central bank’s policy doesn’t mean a comfortable position. He added that downside risks to inflation are more significant than the upside.
In the meantime, the lack of resolution of the Russia-Ukraine conflict, keeps the Euro pressured, even though news headlines revealed some progress in the meetings between the Kremlin and the White House, and Kyiv with Washington.
Daily market movers: US Dollar trimming losses, weighed on the Euro
- The Core Personal Consumption Expenditures (PCE) Price Index — the Fed’s favorite inflation gauge — hit 0.2% MoM in September, matching both last months and estimates. On a yearly basis, core PCE dipped from 2.9% to 2.8%, aligned with forecasts.
- The University of Michigan Consumer Sentiment index for December improved, with the index peaking forecasts of 52.0, came at 53.3 above November’s final reading of 51.1. Inflation expectations moderated, with one-year expectations falling from 4.5% to 4.1%, while five-year expectations slipped from 3.4% to 3.2%, signaling a further easing in longer-term price concerns among households.
- Despite the backdrop favors a moderately hawkish stance, money markets odds for a 25 basis points (bps) Fed rate cut next week remained unchanged at 84% revealed Capital Edge data.
- The US Dollar Index (DXY), which tracks the buck’s performance against six major currencies, ended with losses of 0.09% at 98.98.

Technical analysis: EUR/USD dips below 1.1650, eyes on 1.1600
EUR/USD holds steady around 1.1650 for a fourth session, forming a narrow consolidation band between this level and 1.1700. Buyers, unable to crack the latter, opened the door for some bearish momentum, as reflected by the Relative Strength Index (RSI), putting at risk a potential attempt to retest 1.1800 before challenging the year-to-date (YTD) high at 1.1918.
A daily close below 1.1650 opens the door to challenge the the 50-day Simple Moving Average (SMA) near 1.1609. Once surpasses, up next lies by the 20-day SMA at 1.1589, and then the 1.1500 psychological level.

Euro FAQs
The Euro is the currency for the 20 European Union countries that belong to the Eurozone. It is the second most heavily traded currency in the world behind the US Dollar. In 2022, it accounted for 31% of all foreign exchange transactions, with an average daily turnover of over $2.2 trillion a day.
EUR/USD is the most heavily traded currency pair in the world, accounting for an estimated 30% off all transactions, followed by EUR/JPY (4%), EUR/GBP (3%) and EUR/AUD (2%).
The European Central Bank (ECB) in Frankfurt, Germany, is the reserve bank for the Eurozone. The ECB sets interest rates and manages monetary policy.
The ECB’s primary mandate is to maintain price stability, which means either controlling inflation or stimulating growth. Its primary tool is the raising or lowering of interest rates. Relatively high interest rates – or the expectation of higher rates – will usually benefit the Euro and vice versa.
The ECB Governing Council makes monetary policy decisions at meetings held eight times a year. Decisions are made by heads of the Eurozone national banks and six permanent members, including the President of the ECB, Christine Lagarde.
Eurozone inflation data, measured by the Harmonized Index of Consumer Prices (HICP), is an important econometric for the Euro. If inflation rises more than expected, especially if above the ECB’s 2% target, it obliges the ECB to raise interest rates to bring it back under control.
Relatively high interest rates compared to its counterparts will usually benefit the Euro, as it makes the region more attractive as a place for global investors to park their money.
Data releases gauge the health of the economy and can impact on the Euro. Indicators such as GDP, Manufacturing and Services PMIs, employment, and consumer sentiment surveys can all influence the direction of the single currency.
A strong economy is good for the Euro. Not only does it attract more foreign investment but it may encourage the ECB to put up interest rates, which will directly strengthen the Euro. Otherwise, if economic data is weak, the Euro is likely to fall.
Economic data for the four largest economies in the euro area (Germany, France, Italy and Spain) are especially significant, as they account for 75% of the Eurozone’s economy.
Another significant data release for the Euro is the Trade Balance. This indicator measures the difference between what a country earns from its exports and what it spends on imports over a given period.
If a country produces highly sought after exports then its currency will gain in value purely from the extra demand created from foreign buyers seeking to purchase these goods. Therefore, a positive net Trade Balance strengthens a currency and vice versa for a negative balance.
United States CFTC Gold NC Net Positions up to $2047K from previous $176.6K
EUR/USD now loses some traction and slips back to the area of daily lows around 1.1630 on the back of a mild bounce in the US Dollar. Fresh US data, including the September PCE inflation numbers and the latest read on December consumer sentiment, didn’t really move the needle, so the pair is still on course to finish the week with a respectable gain.
Japan CFTC JPY NC Net Positions rose from previous ¥70.4K to ¥681K
EUR/USD now loses some traction and slips back to the area of daily lows around 1.1630 on the back of a mild bounce in the US Dollar. Fresh US data, including the September PCE inflation numbers and the latest read on December consumer sentiment, didn’t really move the needle, so the pair is still on course to finish the week with a respectable gain.
United Kingdom CFTC GBP NC Net Positions down to £-203K from previous £-16.8K
EUR/USD now loses some traction and slips back to the area of daily lows around 1.1630 on the back of a mild bounce in the US Dollar. Fresh US data, including the September PCE inflation numbers and the latest read on December consumer sentiment, didn’t really move the needle, so the pair is still on course to finish the week with a respectable gain.
Australia CFTC AUD NC Net Positions down to $-739K from previous $-65.8K
EUR/USD now loses some traction and slips back to the area of daily lows around 1.1630 on the back of a mild bounce in the US Dollar. Fresh US data, including the September PCE inflation numbers and the latest read on December consumer sentiment, didn’t really move the needle, so the pair is still on course to finish the week with a respectable gain.
United States CFTC Oil NC Net Positions climbed from previous 39.8K to 656K
EUR/USD now loses some traction and slips back to the area of daily lows around 1.1630 on the back of a mild bounce in the US Dollar. Fresh US data, including the September PCE inflation numbers and the latest read on December consumer sentiment, didn’t really move the needle, so the pair is still on course to finish the week with a respectable gain.