Gold is back on the front foot Wednesday, reclaiming the key $4,200 level per ounce and reversing Tuesday’s pullback. Stronger risk appetite in equities is still a headwind for the safe-haven trade, but persistent softness in the Greenback is giving the precious metal enough support to stay resilient.
Gold floats around $4,200 amid US Dollar slide and growing Fed-pivot bets
Gold price declines some 0.20% on Wednesday as US economic data, although mixed, reaffirmes traders’ expectations for a rate cut next week at the Fed’s meeting. XAU/USD trades above $4,200 after bouncing off daily highss of $4,240.
Bullion declines after mixed US indicators, as fresh central bank buying reinforces speculation of a December rate cut
Earlier, data from ADP showed that private companies cut jobs in November amid an ongoing economic slowdown, as revealed by the latest reading of the ISM Manufacturing PMI data.
Meanwhile, business activity in the services sector remained stable, reported the ISM. Services businesses account for more than two-thirds of the US Gross Domestic Product (GDP) and were driven by higher-income households.
This, alongside rumors that the White House economic adviser Kevin Hassett could be the next Fed Chair, succeeding Jerome Powell, had pushed the Greenback to hit its lowest level since October.
The US Dollar Index (DXY), which tracks the American currency’s performance against six other currencies, is down 0.44% to 98.87.
Despite this, Bullion declined for the second consecutive day, but it seems poised to test higher prices after the World Gold Council (WGC) revealed that central banks bought net 53 tons of Gold in October, so far, the strongest month of 2025.
Up next, the US economic schedule will feature Initial Jobless Claims for the week ending November 29, the Fed’s preferred inflation gauge, the Core Personal Consumption Expenditures (PCE) Price Index, and the University of Michigan Consumer Sentiment.
Daily market movers: Gold underpinned by central bank buying
- ADP data showed private firms cut 32,000 jobs in November, missing estimates of a 10,000 increase and down from October’s 49,000 gain.
- The US ISM Services PMI held steady in November at 52.6, up from 52.4 and surpassing the forecast of 52.1. While expansion continued, orders slowed, employment stayed weak, and input prices remained elevated.
- Money market instruments currently reflect an approximate 85% probability of a 25-basis point rate reduction, with the yield curve indicating 21.2 basis points of cuts at present. For 2026, investor expectations suggest 88.5 basis points of reductions, implying that the federal funds rate may conclude the year at 2.99%.
- After the data, the US 10-year Treasury Note yield is down 2 bps at 4.071%. US real yields — which correlate inversely to Gold prices, fall three basis points, down at 1.831%, a tailwind for Gold prices.
- The WGC reported that central banks resuming purchases in October. Krishan Gopaul, Senior Analyst, EMEA at the WGC said, “Central bank demand for gold remained robust in October, totaling 53t (+36% m/m) and continuing the strong trend seen throughout the year.” He added “Buying remained concentrated among a small number of central banks, led by the National Bank of Poland which became active again during the month.”
Technical analysis: Gold hovers around $4,200 awaiting a catalyst
Gold’s uptrend is intact, but a daily close below $4,200 increases the chances of challenging lower prices. The Relative Strength Index (RSI), although bullish, shifted slightly flat, an indication of consolidation as traders wait for a fresh catalyst.
If XAU/USD rallies past $4,250, it opens the door to test $4,300, ahead of the record high at $4,381. Otherwise, if Gold tumbles below $4,200, the next support is the 20-day Simple Moving Average (SMA) at $4,113, ahead of $4,100.

Gold FAQs
Gold has played a key role in human’s history as it has been widely used as a store of value and medium of exchange. Currently, apart from its shine and usage for jewelry, the precious metal is widely seen as a safe-haven asset, meaning that it is considered a good investment during turbulent times. Gold is also widely seen as a hedge against inflation and against depreciating currencies as it doesn’t rely on any specific issuer or government.
Central banks are the biggest Gold holders. In their aim to support their currencies in turbulent times, central banks tend to diversify their reserves and buy Gold to improve the perceived strength of the economy and the currency. High Gold reserves can be a source of trust for a country’s solvency. Central banks added 1,136 tonnes of Gold worth around $70 billion to their reserves in 2022, according to data from the World Gold Council. This is the highest yearly purchase since records began. Central banks from emerging economies such as China, India and Turkey are quickly increasing their Gold reserves.
Gold has an inverse correlation with the US Dollar and US Treasuries, which are both major reserve and safe-haven assets. When the Dollar depreciates, Gold tends to rise, enabling investors and central banks to diversify their assets in turbulent times. Gold is also inversely correlated with risk assets. A rally in the stock market tends to weaken Gold price, while sell-offs in riskier markets tend to favor the precious metal.
The price can move due to a wide range of factors. Geopolitical instability or fears of a deep recession can quickly make Gold price escalate due to its safe-haven status. As a yield-less asset, Gold tends to rise with lower interest rates, while higher cost of money usually weighs down on the yellow metal. Still, most moves depend on how the US Dollar (USD) behaves as the asset is priced in dollars (XAU/USD). A strong Dollar tends to keep the price of Gold controlled, whereas a weaker Dollar is likely to push Gold prices up.
JPY advances on narrowing yield spreads to 2022 Lows – Scotiabank

The Japanese Yen (JPY) is strengthening again, up 0.3% against the US Dollar (USD) as USD/JPY moves back toward Monday’s lows and threatens a broader retracement of its mid-November weakness, Scotiabank’s Chief FX Strategists Shaun Osborne and Eric Theoret report.
Markets hold steady on BoJ path with 25bp hike priced by March
“The yen is up 0.3% vs. the USD and a mid-performer among the G10 currencies as it pushes back toward Monday’s highs (USDJPY lows) and threatens a more meaningful retracement of the weakness observed since mid-November.”
“The outlook for relative central bank policy remains supportive and yield spreads are narrowing to fresh multi-year lows at levels last seen in 2022.”
“Domestic rate expectations are little changed with markets pricing 20bpts of tightening for December and a full 25bpt hike by March. There are no major domestic releases scheduled through the end of the weak, leaving the focus squarely centered on broader developments.”
EUR: November eurozone inflation meets expectations – Commerzbank

Eurozone inflation for November came in largely as expected, with headline at 2.2% y/y and core at 2.4%, leaving the ECB’s policy stance unchanged. With no market pressure for rate changes and core inflation above target, the Euro (EUR) remains range-bound as the European Central bank (ECB) continues its pause, Commerzbank’s FX analyst Michael Pfister notes.
Euro lacks momentum amid stable ECB outlook
“Ultimately, it came as no surprise that the Euro zone inflation data for November failed to breathe life into the Euro. At 2.2% year-on-year, the overall rate was slightly above market expectations, while the core rate of 2.4% was exactly in line with expectations.”
“Apart from that, the market is not pricing in any interest rate changes for the ECB until at least April 2026. Yesterday’s data provided absolutely no reason to change that. Core inflation remains stubbornly high and is above the ECB’s expectations of 2.2%, which argues against further interest rate cuts. A slight decline in rates in the future, as expected by our experts, would bring the ECB closer to its inflation target, but would not be a reason to further lower the key interest rate.”
“As long as there are no indications that inflation rates could deviate significantly from the target (in either direction), the ECB can continue to sit back and pause, as our experts expect. It is therefore no surprise that the Euro is currently unable to develop a life of its own; after all, there is a lack of interest rate speculation, which is likely to remain the case for the time being.”
Australian Dollar continues scaling higher as hawkish RBA offsets softer Q3 GDP
The Australian Dollar (AUD) prolongs a two-week-old uptrend against a broadly weaker US Dollar (USD) and climbs to its highest level since late October during the Asian session on Wednesday. Diminishing odds for more policy easing by the Reserve Bank of Australia (RBA) offset the disappointing Australian economic growth figures and turn out to be a key factor that continues to underpin the Aussie.
Apart from this, a generally positive tone around the equity markets acts as a tailwind for the risk-sensitive AUD, which seems unaffected by China’s unimpressive Services PMI. The USD, on the other hand, hangs near its lowest level in over two weeks amid bets that the Federal Reserve (Fed) will cut interest rates next week. This contributes to the bid tone surrounding the AUD/USD pair and favors bullish traders.
Australian Dollar buying remains unabated as RBA’s hawkish tilt offsets dismal Q3 GDP growth figures
- The Australian Bureau of Statistics reported this Wednesday that the economy grew by 0.4% during the July-September period, down from the 0.6% rise seen in the second quarter. The annual Gross Domestic Product growth rate stood at 2.1% compared to 1.8% in the previous quarter. Both the quarterly and the yearly print missed expectations, prompting some intraday selling around the Australian Dollar during the Asian session.
- Speaking before a parliamentary committee earlier today, Reserve Bank of Australia Governor Michele Bullock said that the central bank is looking very hard at recent inflation numbers to see if some of the price pressures are temporary. Bullock added that if inflation proves to be persistent, it would have implications for future monetary policy. This dampens hopes for more policy easing and lends support to the Aussie.
- In fact, Australia’s headline Consumer Price Index (CPI) accelerated from a 3.5% increase reported in the previous month to 3.8% YoY in October. Moreover, the RBA Trimmed Mean CPI rose 3.3% during the reported month from 3.2% in September. This indicated that inflation remains above the RBA’s 2% to 3% annual target and raises questions about just how much headroom the central bank has to cut rates further.
- The latest data published by RatingDog showed that China’s Services Purchasing Managers’ Index (PMI) dropped to 52.1 in November from 52.6 in October. This, however, was better than consensus estimates for a reading of 52 and does little to dent the underlying bullish sentiment surrounding the China-proxy AUD.
- The US Dollar hangs near its lowest level since November 14, touched on Monday, amid dovish Federal Reserve expectations, and contributes to limiting the downside for the AUD/USD pair. According to the CME Group’s FedWatch Tool, traders are pricing in a nearly 90% chance of a 25-basis-point rate cut on December 10. Moreover, speculations of a dovish pick for the next Fed Chair undermine the Greenback.
- Meanwhile, the prospects for lower US interest rates, along with hopes for a peace deal between Russia and Ukraine, remain supportive of a generally positive tone around the equity markets. This further dents the safe-haven buck and benefits the risk-sensitive Aussie. Traders now look to the release of the US ADP report on private-sector employment and the US ISM Services PMI for a fresh impetus.
- The market attention, however, will remain glued to the US Personal Consumption Expenditure (PCE) Price Index, due on Friday, which will be scrutinized for cues about the Fed’s future rate-cut path. This, in turn, will play a key role in influencing the USD and determining the next leg of a directional move for the AUD/USD pair. The fundamental backdrop, meanwhile, remains tilted in favor of bullish traders.
AUD/USD could accelerate the positive momentum once the 0.6600 mark is conquered

The recent breakout through a descending trend-line hurdle extending from the September swing high and acceptance above the 100-day Simple Moving Average (SMA) favors the AUD/USD bulls. Moreover, oscillators on the daily chart have been gaining positive traction and are still away from being in the overbought territory. This, in turn, validates the near-term positive outlook, suggesting that any corrective pullback could be seen as a buying opportunity near the aforementioned confluence resistance breakpoint, currently around the 0.6535-0.6530 region.
This is closely followed by the 0.6500 psychological mark. A convincing break below the latter could make the AUD/USD pair vulnerable to weaken further below the 200-day SMA, currently pegged near the 0.6465 zone, toward challenging a multi-month low, around the 0.6420 region, touched in November. Some follow-through selling, leading to a subsequent fall below the 0.6400 mark, will be seen as a fresh trigger for bearish traders and pave the way for deeper losses.
Nevertheless, the AUD/USD pair seems poised to prolong a two-week-old uptrend and aim to reclaim the 0.6600 mark, above which the momentum could extend further towards the next relevant hurdle near the 0.6660-0.6665 region. Spot prices could eventually climb to test the year-to-date high, levels just above the 0.6700 mark, touched in September.
RBA FAQs
The Reserve Bank of Australia (RBA) sets interest rates and manages monetary policy for Australia. Decisions are made by a board of governors at 11 meetings a year and ad hoc emergency meetings as required. The RBA’s primary mandate is to maintain price stability, which means an inflation rate of 2-3%, but also “..to contribute to the stability of the currency, full employment, and the economic prosperity and welfare of the Australian people.” Its main tool for achieving this is by raising or lowering interest rates. Relatively high interest rates will strengthen the Australian Dollar (AUD) and vice versa. Other RBA tools include quantitative easing and tightening.
While inflation had always traditionally been thought of as a negative factor for currencies since it lowers the value of money in general, the opposite has actually been the case in modern times with the relaxation of cross-border capital controls. Moderately higher inflation now tends to lead central banks to put up their interest rates, which in turn has the effect of attracting more capital inflows from global investors seeking a lucrative place to keep their money. This increases demand for the local currency, which in the case of Australia is the Aussie Dollar.
Macroeconomic data gauges the health of an economy and can have an impact on the value of its currency. Investors prefer to invest their capital in economies that are safe and growing rather than precarious and shrinking. Greater capital inflows increase the aggregate demand and value of the domestic currency. Classic indicators, such as GDP, Manufacturing and Services PMIs, employment, and consumer sentiment surveys can influence AUD. A strong economy may encourage the Reserve Bank of Australia to put up interest rates, also supporting AUD.
Quantitative Easing (QE) is a tool used in extreme situations when lowering interest rates is not enough to restore the flow of credit in the economy. QE is the process by which the Reserve Bank of Australia (RBA) prints Australian Dollars (AUD) for the purpose of buying assets – usually government or corporate bonds – from financial institutions, thereby providing them with much-needed liquidity. QE usually results in a weaker AUD.
Quantitative tightening (QT) is the reverse of QE. It is undertaken after QE when an economic recovery is underway and inflation starts rising. Whilst in QE the Reserve Bank of Australia (RBA) purchases government and corporate bonds from financial institutions to provide them with liquidity, in QT the RBA stops buying more assets, and stops reinvesting the principal maturing on the bonds it already holds. It would be positive (or bullish) for the Australian Dollar.
NZD/USD gathers strength to near 0.5750 on upbeat Chinese PMI, Fed rate cut bets

The NZD/USD pair gathers strength near 0.5745 during the Asian trading hours on Wednesday. The New Zealand Dollar (NZD) edges higher against the US Dollar (USD) after the Chinese economic data. Traders await the release of the US ADP Employment Change and ISM Services Purchasing Managers Index (PMI) data later on Wednesday for fresh impetus.
Data released by RatingDog on Wednesday revealed that China’s Services PMI eased to 52.1 in November from 52.6 in the previous reading. This reading came in better than the estimation of 52.0. The Kiwi remains strong in an immediate reaction to the upbeat Chinese data.
Last week, the Reserve Bank of New Zealand (RBNZ) cut its benchmark Official Cash Rate (OCR) by 25 basis points (bps) to 2.25%, as widely expected. However, policymakers signalled an end to the easing cycle as the economy showed early signs of recovery. This, in turn, provides some support to the NZD against the USD.
Weaker US Manufacturing PMI, a cooling labor market, and dovish remarks from the Federal Reserve (Fed) policymakers might weigh on the Greenback and create a tailwind for the pair. Financial markets anticipate that the US central bank will deliver a 25 bps interest rate reduction at its upcoming meeting on December 9-10, 2025. The CME FedWatch Tool currently shows an approximately 89% chance of a Fed rate cut next week.
Traders brace for the US ADP Employment Change and ISM Services PMI data on Wednesday. These reports could offer some hints about the labor market and the US economy. In case of the stronger-than-expected outcome, this could help limit the USD’s losses in the near term. On Friday, the attention will shift to the US Personal Consumption Expenditures (PCE) Price Index inflation data, which might offer clues about the US interest rate path.
New Zealand Dollar FAQs
The New Zealand Dollar (NZD), also known as the Kiwi, is a well-known traded currency among investors. Its value is broadly determined by the health of the New Zealand economy and the country’s central bank policy. Still, there are some unique particularities that also can make NZD move. The performance of the Chinese economy tends to move the Kiwi because China is New Zealand’s biggest trading partner. Bad news for the Chinese economy likely means less New Zealand exports to the country, hitting the economy and thus its currency. Another factor moving NZD is dairy prices as the dairy industry is New Zealand’s main export. High dairy prices boost export income, contributing positively to the economy and thus to the NZD.
The Reserve Bank of New Zealand (RBNZ) aims to achieve and maintain an inflation rate between 1% and 3% over the medium term, with a focus to keep it near the 2% mid-point. To this end, the bank sets an appropriate level of interest rates. When inflation is too high, the RBNZ will increase interest rates to cool the economy, but the move will also make bond yields higher, increasing investors’ appeal to invest in the country and thus boosting NZD. On the contrary, lower interest rates tend to weaken NZD. The so-called rate differential, or how rates in New Zealand are or are expected to be compared to the ones set by the US Federal Reserve, can also play a key role in moving the NZD/USD pair.
Macroeconomic data releases in New Zealand are key to assess the state of the economy and can impact the New Zealand Dollar’s (NZD) valuation. A strong economy, based on high economic growth, low unemployment and high confidence is good for NZD. High economic growth attracts foreign investment and may encourage the Reserve Bank of New Zealand to increase interest rates, if this economic strength comes together with elevated inflation. Conversely, if economic data is weak, NZD is likely to depreciate.
The New Zealand Dollar (NZD) tends to strengthen during risk-on periods, or when investors perceive that broader market risks are low and are optimistic about growth. This tends to lead to a more favorable outlook for commodities and so-called ‘commodity currencies’ such as the Kiwi. Conversely, NZD tends to weaken at times of market turbulence or economic uncertainty as investors tend to sell higher-risk assets and flee to the more-stable safe havens.
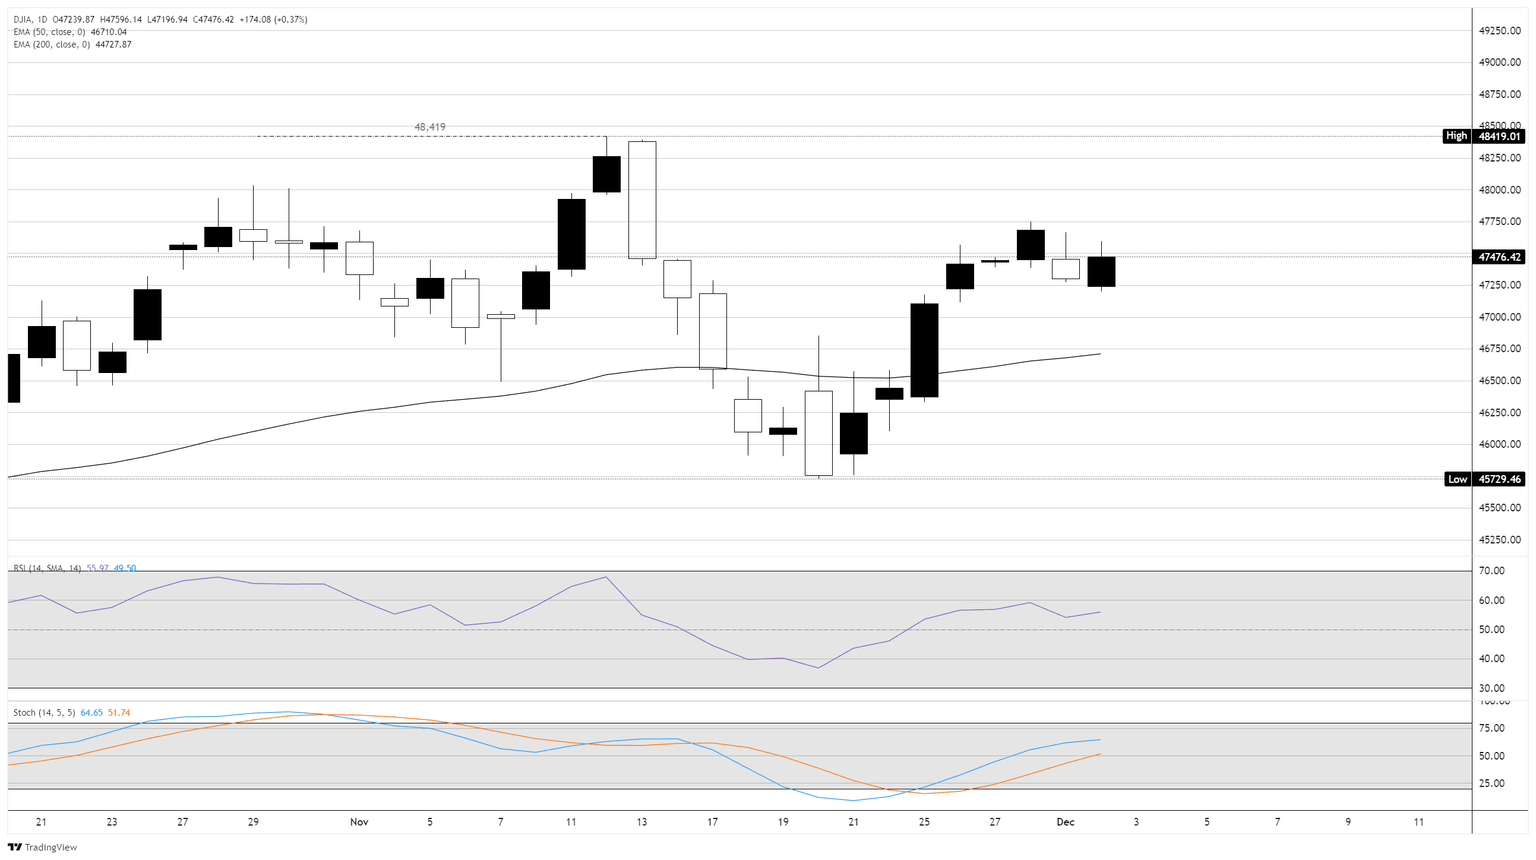
Dow Jones Industrial Average grabs a cautious bullish candle on Tuesday
The Dow Jones Industrial Average (DJIA) faced a messy session on Tuesday, exploring early upside and challenging the 47,600 level before getting knocked back down once again and ending the day on a cautious high note. New-old players in the AI space are cropping up to challenge the long-running Nvidia (NVDA) hegemony in the hardware space, prompting a back-and-forth in major tech names heading into the midweek.
The Dow Jones and the Standard & Poor’s 500 (SP500) indexes struggled to hold onto intraday gains, with the Dow climbing around 175 points or 0.36%, and the SP500 rising a scant 12 points, or 0.17%. The tech-heavy Nasdaq 100 climbed 220 points, or 0.87%, to cross 23,550 as the AI and crypto segments recover their footing.
Crypto rebound looks to grow some legs
Bitcoin (BTC) rebounded around 6.5%, clawing back recent losses as crypto traders pile back into what many speculators hope is the bottom of the crypto plunge that dragged BTC/USD prices down over 36% from all-time highs set in October.
AI hardware race continues to heat up, maybe?
The AI hardware race continues to heat up, and long-time AI champion Nvidia declined from Tuesday’s meager highs after Amazon (AMZN) announced a rushed launch of its own AI-focused chipsets, tailor-made to compete with Nvidia’s AI-servicing GPUs. Amazon rose 1.2% on the headlines before it too fell back toward the previous day’s close, slipping back below $236 per share in the process.
According to Amazon, their new ‘Trainium3’ chipsets will be able to handle demanding calculation loads necessary to train and run AI models. However, a key sticking point that is preventing Amazon stock from running hot: According to the company, its AI-focused chipsets lack extensive function libraries that are bespoke to Nvidia hardware, meaning any cost savings in operating will likely be expended in setup and additional training time, making a transition from pre-existing Nvidia hardware a lateral move.
Political jitters continue to roil just beneath the surface
Never ones to sit idly by and let an equity recovery run unimpeded, the Trump administration is hard at work pumping out eyebrow-raising statements that are raising political jitters among market participants. US President Donald Trump reiterated his frequent promises that the federal government would be handing out supplementary payments to Americans from tariff income. By all accounts, tariff inflows have drastically underperformed expectations from the Trump administration itself, and are overwhelmingly being paid for by US companies and citizens to begin with.
US Treasury Secretary Scott Bessent is working double-duty to walk back Trump’s own “tariff repayment” proposals, highlighting the dysfunction underscoring the Trump administration. According to Bessent, “tariff repayments” are likely to take the form of steep tax rebates, which the Treasury Secretary could be coming as soon as Q1 2026.
Dow Jones daily chart
Dow Jones FAQs
The Dow Jones Industrial Average, one of the oldest stock market indices in the world, is compiled of the 30 most traded stocks in the US. The index is price-weighted rather than weighted by capitalization. It is calculated by summing the prices of the constituent stocks and dividing them by a factor, currently 0.152. The index was founded by Charles Dow, who also founded the Wall Street Journal. In later years it has been criticized for not being broadly representative enough because it only tracks 30 conglomerates, unlike broader indices such as the S&P 500.
Many different factors drive the Dow Jones Industrial Average (DJIA). The aggregate performance of the component companies revealed in quarterly company earnings reports is the main one. US and global macroeconomic data also contributes as it impacts on investor sentiment. The level of interest rates, set by the Federal Reserve (Fed), also influences the DJIA as it affects the cost of credit, on which many corporations are heavily reliant. Therefore, inflation can be a major driver as well as other metrics which impact the Fed decisions.
Dow Theory is a method for identifying the primary trend of the stock market developed by Charles Dow. A key step is to compare the direction of the Dow Jones Industrial Average (DJIA) and the Dow Jones Transportation Average (DJTA) and only follow trends where both are moving in the same direction. Volume is a confirmatory criteria. The theory uses elements of peak and trough analysis. Dow’s theory posits three trend phases: accumulation, when smart money starts buying or selling; public participation, when the wider public joins in; and distribution, when the smart money exits.
There are a number of ways to trade the DJIA. One is to use ETFs which allow investors to trade the DJIA as a single security, rather than having to buy shares in all 30 constituent companies. A leading example is the SPDR Dow Jones Industrial Average ETF (DIA). DJIA futures contracts enable traders to speculate on the future value of the index and Options provide the right, but not the obligation, to buy or sell the index at a predetermined price in the future. Mutual funds enable investors to buy a share of a diversified portfolio of DJIA stocks thus providing exposure to the overall index.
Gold Price Forecast: Further upside could challenge the all-time high
Gold’s rebound hit a bit of a ceiling around Monday’s highs above $4,260, and that paved the way for a pullback below $4,200 on turnaround Tuesday.
The dip comes as the US Dollar makes a modest push higher and Treasury yields send mixed signals: Short-dated yields are slipping a little, while the middle and longer end of the curve hold steadier. Not exactly a risk-off environment.
But if you take a step back, the broader story still looks positive for bullion. The precious metal just logged its fourth straight monthly gain in November, breaking out convincingly from the late-August lull around $3,300. Add in lingering geopolitical tension and ongoing chatter about more Federal Reserve (Fed) rate cuts, and buyers have had plenty of reasons to stay engaged.
Sentiment could shift, however, if global risk appetite suddenly improves. Especially if peace-talk headlines between Russia and Ukraine gain traction, some of gold’s safe-haven shine could fade. But so far, every dip has attracted fresh buying pretty quickly.
Rate expectations also remain a key support. Markets still see the Fed lowering its interest rates again in December, and current pricing points to nearly 88 basis points of easing by late 2026, a helpful backdrop for a non-yielding asset like precious metals.
Technical picture
If buyers regain control, the first big test sits at the December high of $4,264 (December 1). A clean break above that would put the record top at $4,380 (October 17) back into focus, a level that could determine whether this uptrend has more legs.
On the flip side, support isn’t far below current levels. The 55-day SMA around $4,016 lines up nicely with weekly support at $3,997 (November 18). Lose that, and the next safety net sits around at the October floor at $3,886 (October 28), while a deeper slide could drag the 50% Fibonacci of the May–October rally at $3,750 back into the spotlight.
Momentum indicators still lean toward the bulls. The Relative Strength Index (RSI) is receding toward 59, elevated but not screaming “overbought”, which suggests there’s room for further upside. Meanwhile, the Average Directional Index (ADX) hovering near 21 signals an uptrend that’s firming up slowly, not a frenzy, but the kind of measured advance that can last.
Put simply: Momentum is still supportive, and the chart has a decent cushion underneath.
-1764694691396-1764694691397.png&w=1536&q=95)
What’s next?
The near-term direction will come down to familiar drivers: What the Fed says next, how the US economy holds up, and whether global nerves settle or flare up. A softer tone from the Fed, or data hinting at easing labour-market pressure, would keep gold well supported.
And unless geopolitical risks fade meaningfully, the yellow metal doesn’t need fresh turmoil to maintain its bid. As long as the Greenback struggles for traction, the bias stays tilted upward, maybe more of a steady climb than a runaway rally.
Bottom line
Gold’s overall tone remains bullish. Buyers are still calling the shots, and there’s a solid foundation beneath the market if prices wobble.
Gold FAQs
Gold has played a key role in human’s history as it has been widely used as a store of value and medium of exchange. Currently, apart from its shine and usage for jewelry, the precious metal is widely seen as a safe-haven asset, meaning that it is considered a good investment during turbulent times. Gold is also widely seen as a hedge against inflation and against depreciating currencies as it doesn’t rely on any specific issuer or government.
Central banks are the biggest Gold holders. In their aim to support their currencies in turbulent times, central banks tend to diversify their reserves and buy Gold to improve the perceived strength of the economy and the currency. High Gold reserves can be a source of trust for a country’s solvency. Central banks added 1,136 tonnes of Gold worth around $70 billion to their reserves in 2022, according to data from the World Gold Council. This is the highest yearly purchase since records began. Central banks from emerging economies such as China, India and Turkey are quickly increasing their Gold reserves.
Gold has an inverse correlation with the US Dollar and US Treasuries, which are both major reserve and safe-haven assets. When the Dollar depreciates, Gold tends to rise, enabling investors and central banks to diversify their assets in turbulent times. Gold is also inversely correlated with risk assets. A rally in the stock market tends to weaken Gold price, while sell-offs in riskier markets tend to favor the precious metal.
The price can move due to a wide range of factors. Geopolitical instability or fears of a deep recession can quickly make Gold price escalate due to its safe-haven status. As a yield-less asset, Gold tends to rise with lower interest rates, while higher cost of money usually weighs down on the yellow metal. Still, most moves depend on how the US Dollar (USD) behaves as the asset is priced in dollars (XAU/USD). A strong Dollar tends to keep the price of Gold controlled, whereas a weaker Dollar is likely to push Gold prices up.
USD/CHF Price Forecast: Looking for direction around 0.8050
The US Dollar remains practically flat around 0.8050 on Tuesday after whipsawing between 0.8070 and 0.8000 over the previous two trading days. The immediate trend remains bearish, from 0.8100 highs, but the long wicks in the daily chart highlight an indecisive market, and technical indicators support that view.
US macroeconomic data released on Monday failed to support the US Dollar (USD). Business activity in the manufacturing sector contracted for the ninth consecutive month, adding pressure on the US Federal Reserve to cut interest rates further. A somewhat brighter market mood on Tuesday, however, is weighing on the CHF and providing some support to the US Dollar.
Technical Analysis: USD/CHF is trapped between 0.8000 and 0.8070

The USD/CHF trades at 0.8044, practically unchanged on the daily chart. The Moving Average Convergence Divergence (MACD) has turned marginally positive and holds around the zero line, suggesting tentative bullish momentum as the MACD line edges above the signal line. The Relative Strength Index (RSI) remains hovering around the 50 line, showing a lack of a clear bias.
The pair’s correction from the 0.8100 area has found support at the 0.0800 psychological level, right above the 50% Fibonacci retracement of the mid-November uptrend and the November 19 low, at 0.7985. Further down, the target is the November 18 low, near 0.7935.
To the upside, the mentioned 0.8070 level (November 28 low) needs to give way to shift the focus back towards the November 23 and 25 highs, at the 0.8100 area ahead of the August peak, at 0.8130.
(The technical analysis of this story was written with the help of an AI tool)
US Dollar Price Today
The table below shows the percentage change of US Dollar (USD) against listed major currencies today. US Dollar was the strongest against the Japanese Yen.
| USD | EUR | GBP | JPY | CAD | AUD | NZD | CHF | |
|---|---|---|---|---|---|---|---|---|
| USD | -0.02% | 0.07% | 0.33% | 0.07% | -0.12% | 0.16% | -0.04% | |
| EUR | 0.02% | 0.10% | 0.36% | 0.09% | -0.10% | 0.18% | -0.01% | |
| GBP | -0.07% | -0.10% | 0.25% | -0.01% | -0.21% | 0.09% | -0.11% | |
| JPY | -0.33% | -0.36% | -0.25% | -0.27% | -0.45% | -0.18% | -0.37% | |
| CAD | -0.07% | -0.09% | 0.00% | 0.27% | -0.19% | 0.09% | -0.10% | |
| AUD | 0.12% | 0.10% | 0.21% | 0.45% | 0.19% | 0.28% | 0.08% | |
| NZD | -0.16% | -0.18% | -0.09% | 0.18% | -0.09% | -0.28% | -0.20% | |
| CHF | 0.04% | 0.01% | 0.11% | 0.37% | 0.10% | -0.08% | 0.20% |
The heat map shows percentage changes of major currencies against each other. The base currency is picked from the left column, while the quote currency is picked from the top row. For example, if you pick the US Dollar from the left column and move along the horizontal line to the Japanese Yen, the percentage change displayed in the box will represent USD (base)/JPY (quote).
Spain Unemployment Change came in at -18.8K, below expectations (-12.4K) in November
Gold reverses an Asian session dip to sub-$4,200 levels and trades with modest losses just below the highest level since October 20, touched the previous day. The growing acceptance that the US Federal Reserve will lower borrowing costs again fails to assist the US Dollar to capitalize on the overnight modest bounce from a two-week low.