The Australian Dollar spent Monday trying to talk itself into a recovery, and the tape was not buying it. AUD/USD has ridden a China-and-commodities narrative for months, one that conveniently glossed over how shaky both legs of that trade have become, and Friday’s Nonfarm Payrolls print finally forced a reckoning. US employers added 172K jobs against a consensus near 85K, with roughly 93K of upward revisions to prior months and the unemployment rate steady at 4.3%.
Why Silver could be heading to $50 despite booming AI demand
Silver shed roughly 10% in the first week of June and it is almost 50% down from its January record peak. But why? All logic points to Silver trading closer to $200 per ounce than $61, its 2026 yearly low.
As with almost all financial assets, Silver price is affected by different factors. Which one weighs more at a certain time can be unpredictable, but easily explained once it happens.
Risk aversion and record rallies
Two main factors support the case for a Silver record run.
First is, of course, the risk-averse environment, a result of the war in Iran. The second is the still-alive tech boom, particularly the AI one.
Tech demand for the precious metal has not receded. Just take a look at Wall Street’s record rallies from early June, and the latest SpaceX IPO, scheduled for June 12, which has investors pricing it roughly 70% higher.
Silver is used not only for AI, but also for solar energy and electric vehicles, also booming industries. Lower prices are not coming from there.
Also, the white metal tends to benefit from risk-off sentiment, though not to the same extent as its big brother, Gold. The Middle East war grants a continued run to safety that, so far, has only benefited the US Dollar (USD).
Explaining the fall
Silver flirting with yearly lows could be explained by a combination of different factors, some directly linked to those that could have supported the bullish case.
Yes, the Persian Gulf war stands at the top of the list, as, alongside risk aversion, the conflict has sent Oil prices skyrocketing and created mounting inflationary pressures beyond central banks’ comfort zones. Policymakers around the globe were cautiously considering pausing monetary easing and are now suddenly taking a full U-turn, looking to hike interest rates.
The Reserve Bank of Australia (RBA) was the first one to kick the ball, hiking rates even before the war started amid stubborn inflation. The European Central Bank (ECB) will be next, with market players fully pricing in a 25-basis-point (bps) interest rate hike at the June meeting.
And what about the Federal Reserve (Fed)? Well, that’s a whole individual story, but to make it shorter, the Fed is unlikely to hike rates until later in the year, not because it does not need to, but because the central bank is also leading with a new Chairman, appointed by President Donald Trump to lower interest rates against common sense. Indeed, Kevin Warsh has repeatedly highlighted his belief that the Fed should be independent, but it remains to be seen how independent it will be.
And yet, the US Dollar is also strengthening on rate hike speculation, even against currencies whose central banks have already delivered or are about to.
Why is the USD then higher, despite the Fed holding its fire? Expectations. Markets move on expectations. Past, present, and future are all reflected by the current price, as Charles Dow once taught.
Lower lows ahead: $50 comes to play
From a fundamental standpoint, there’s nothing in sight that could make the market sentiment shift. Despite efforts, an end to the Iran conflict seems unlikely, given the multiple parties involved and the long-lasting conflict among most of them. The best markets can hope for these days is an extended ceasefire, though it won’t be a complete one. Investors could also hope for the Fed to hike rates by year’s end, but it is not crazy to think that US policymakers could act before then, delivering a shock that would boost demand for an already strong USD.
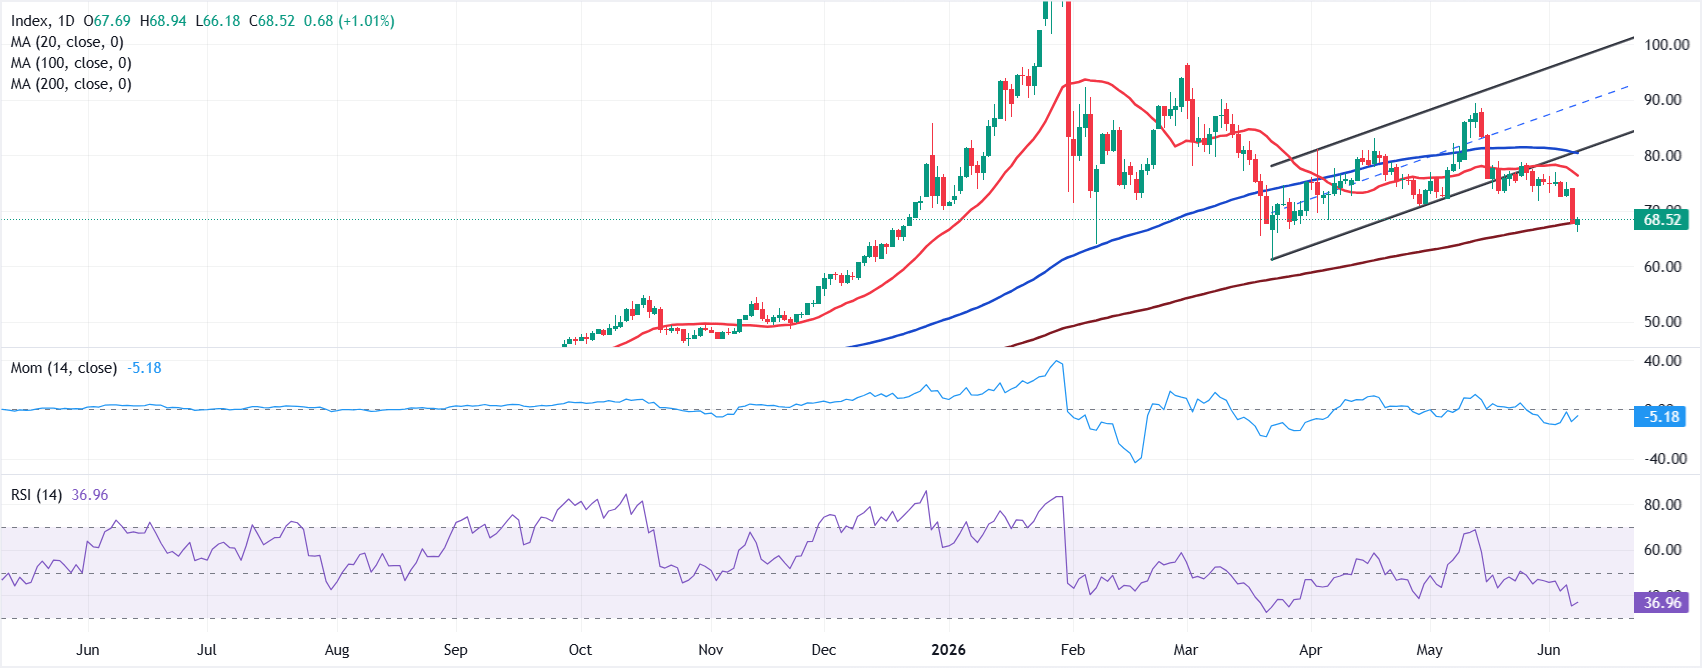
From a technical analysis perspective, XAG/USD is on track to pierce the yearly low, with the psychological $50 mark a potential target. Silver’s daily chart shows that it broke the base of an ascending channel by the end of May and even completed a pullback to it before turning south.
Furthermore, the pair is piercing the 200-day Simple Moving Average (SMA) at around $68.50, the first time it challenges the dynamic support in over a year.
The year low at $61 is the first support level to watch, followed by the $55 region, as it topped around it in October and November 2025 before finally breaking north. A clear break of this region exposes the aforementioned $50 level. Should Silver recover above $80, the case for a steady bearish extension will be in trouble, as the level should attract sellers to maintain the current trend alive.
Euro: ECB hike seen limiting upside versus US Dollar – OCBC

OCBC’s Sim Moh Siong expects the European Central Bank (ECB) to deliver a one-off 25 bp ‘insurance’ hike to 2.25%, with updated projections showing higher inflation and weaker growth. With this move largely priced in, Siong warns EUR/USD may struggle to advance without a fresh catalyst, especially as US‑Iran diplomacy stalls and geopolitical risks linger around the Strait of Hormuz.
Priced-in ECB move caps Euro gains
“ECB Week Risk: Monetary policy meetings return this week. The ECB is set to hike, while a BoC hike would be a clear surprise. Updated ECB projections should show higher inflation and weaker growth, supporting a one-off 25bp insurance hike in our view to 2.25%.”
“With the move fully priced, EUR/USD may struggle to rally without a fresh catalyst. Progress on a US-Iran deal that reopens the Strait of Hormuz could help, but talks appear stalled.”
“Ceasefire hopes are keeping Brent below USD100/bbl for now. However, inventories are falling and the shrinking buffer could drive oil to new highs by late 3Q26 if diplomacy fails to progress.”
(This article was created with the help of an Artificial Intelligence tool and reviewed by an editor.)
Euro: ECB hike but growth worries – BNY
BNY’s Bob Savage notes that an European Central Bank (ECB) rate hike is widely expected, but guidance on future moves and growth risks will be crucial for EUR/USD. The bank argues the Governing Council is unlikely to commit to a prolonged tightening cycle, with the Euro already trading near ECB projections and a modestly weaker Euro (EUR) potentially desirable for exporters.
ECB guidance to shape Euro path
“An ECB hike on Thursday is considered a foregone conclusion but uncertainty remains regarding what happens next.”
“For now, we believe the “don’t forget growth” message is strong enough (at least behind closed doors) such that the Governing Council will not be able to commit to a prolonged cycle, and that would already risk some downside risk in the euro: any increase in exposures which solely responded to the wide gap between ECB expectations versus peers would require some moderation.”
“Compared to 2025, we note that the ECB is no longer playing “catch-up” to the EUR’s performance, as the currency is now trading around the levels anticipated in its past three Staff Projections.”
“This means negligible impact either way, and the ECB should note that the recent surge in hawkish pricing has not supported the currency, both in terms of levels and also positioning – the currency remains underheld in iFlow.”
“If anything, a modestly weaker EUR is probably desirable to help exporters.”
(This article was created with the help of an Artificial Intelligence tool and reviewed by an editor.)
Iran’s ambassador to Moscow: the Strait of Hormuz will be open but with transit fees

Iran’s ambassador to Moscow, Kazem Jalali, said that the Strait of Hormuz will be open but under new conditions to be set by Iran and Oman, including a transit fee, Reuters reported on Monday.
“Of course, this strait will be open, but with new conditions to be determined by the Iranian and Omani authorities,” Ambassador Kazem Jalali said. “We understand that Iran and Oman provide certain services related to this strait. And fees will be charged for those services,” he added.
Market reaction
At the time of writing, the West Texas Intermediate (WTI) is up 4.60% on the day at $92.65.
WTI Oil FAQs
WTI Oil is a type of Crude Oil sold on international markets. The WTI stands for West Texas Intermediate, one of three major types including Brent and Dubai Crude. WTI is also referred to as “light” and “sweet” because of its relatively low gravity and sulfur content respectively. It is considered a high quality Oil that is easily refined. It is sourced in the United States and distributed via the Cushing hub, which is considered “The Pipeline Crossroads of the World”. It is a benchmark for the Oil market and WTI price is frequently quoted in the media.
Like all assets, supply and demand are the key drivers of WTI Oil price. As such, global growth can be a driver of increased demand and vice versa for weak global growth. Political instability, wars, and sanctions can disrupt supply and impact prices. The decisions of OPEC, a group of major Oil-producing countries, is another key driver of price. The value of the US Dollar influences the price of WTI Crude Oil, since Oil is predominantly traded in US Dollars, thus a weaker US Dollar can make Oil more affordable and vice versa.
The weekly Oil inventory reports published by the American Petroleum Institute (API) and the Energy Information Agency (EIA) impact the price of WTI Oil. Changes in inventories reflect fluctuating supply and demand. If the data shows a drop in inventories it can indicate increased demand, pushing up Oil price. Higher inventories can reflect increased supply, pushing down prices. API’s report is published every Tuesday and EIA’s the day after. Their results are usually similar, falling within 1% of each other 75% of the time. The EIA data is considered more reliable, since it is a government agency.
OPEC (Organization of the Petroleum Exporting Countries) is a group of 12 Oil-producing nations who collectively decide production quotas for member countries at twice-yearly meetings. Their decisions often impact WTI Oil prices. When OPEC decides to lower quotas, it can tighten supply, pushing up Oil prices. When OPEC increases production, it has the opposite effect. OPEC+ refers to an expanded group that includes ten extra non-OPEC members, the most notable of which is Russia.
Gold rebounds to near $4,350 despite Middle East tensions

Gold price (XAU/USD) recovers some lost ground to around $4,345 during the early Asian session on Monday. However, the potential upside for the precious metal might be limited amid ongoing tensions in the Middle East and expectations that the Federal Reserve (Fed) will keep interest rates unchanged.
Reuters reported on Sunday that the Israeli military said that it intercepted waves of missiles fired from Iran for the first time since early April. Iranian officials said that any attack from Israel against Lebanon or Iran would be met with a “crushing and comprehensive response.”
US President Donald Trump said that he would call Israeli Prime Minister Benjamin Netanyahu and ask him not to retaliate. Trump further stated that Netanyahu will have ‘no choice’ but to accept a deal with Iran, adding that Iran’s strikes have not changed his desire to conclude US-Iran negotiations.
Escalating tensions in the Middle East continue to fuel concerns over inflation and expectations of elevated interest rates, which weigh on the Gold price, a non-yielding asset.
Data released by the US Bureau of Labor Statistics (BLS) on Friday showed that the Nonfarm Payrolls (NFP) in the United States (US) rose by 172K in May, versus the 179K increase (revised from 115K). This figure came in stronger than the market expectation of 85K by a wide margin.
Meanwhile, the Unemployment Rate remained unchanged at 4.3% in May, in line with the market consensus. The upbeat US jobs report has forced traders to completely price out near-term interest rate cuts, which undermines the yellow metal.
Gold FAQs
Gold has played a key role in human’s history as it has been widely used as a store of value and medium of exchange. Currently, apart from its shine and usage for jewelry, the precious metal is widely seen as a safe-haven asset, meaning that it is considered a good investment during turbulent times. Gold is also widely seen as a hedge against inflation and against depreciating currencies as it doesn’t rely on any specific issuer or government.
Central banks are the biggest Gold holders. In their aim to support their currencies in turbulent times, central banks tend to diversify their reserves and buy Gold to improve the perceived strength of the economy and the currency. High Gold reserves can be a source of trust for a country’s solvency. Central banks added 1,136 tonnes of Gold worth around $70 billion to their reserves in 2022, according to data from the World Gold Council. This is the highest yearly purchase since records began. Central banks from emerging economies such as China, India and Turkey are quickly increasing their Gold reserves.
Gold has an inverse correlation with the US Dollar and US Treasuries, which are both major reserve and safe-haven assets. When the Dollar depreciates, Gold tends to rise, enabling investors and central banks to diversify their assets in turbulent times. Gold is also inversely correlated with risk assets. A rally in the stock market tends to weaken Gold price, while sell-offs in riskier markets tend to favor the precious metal.
The price can move due to a wide range of factors. Geopolitical instability or fears of a deep recession can quickly make Gold price escalate due to its safe-haven status. As a yield-less asset, Gold tends to rise with lower interest rates, while higher cost of money usually weighs down on the yellow metal. Still, most moves depend on how the US Dollar (USD) behaves as the asset is priced in dollars (XAU/USD). A strong Dollar tends to keep the price of Gold controlled, whereas a weaker Dollar is likely to push Gold prices up.
China Foreign Exchange Reserves (MoM): $3.442T (May) vs $3.411T
AUD/USD depreciates after registering minor gains in the previous day, trading around 0.7120 during the Asian hours. The technical analysis of the daily chart shows the pair consolidating sideways within a rectangle pattern, as neither bulls nor bears gain control. The AUD/USD pair is holding a slight bearish tone however as it sits beneath both the nine-day and 50-day EMAs.
Bitcoin briefly tips $60K, stocks decline as strong labor data fuels hawkish Fed expectations

Bitcoin (BTC) briefly fell below the $60,000 mark on Friday as risk assets came under heavy pressure following a stronger-than-expected US jobs report. The US jobs data triggered a sharp repricing of Federal Reserve interest rate expectations, according to an X post by The Kobeissi Letter.
The decline coincided with a broader market sell-off that wiped nearly $2 trillion from the S&P 500.
“The S&P 500 just erased nearly -$2 TRILLION of market cap just hours after the 3rd strongest US jobs report in 18 months,” The Kobeissi Letter wrote.
Bitcoin, stock market plunges following strong US jobs data
The report noted that investors have become increasingly concerned that economic strength could delay future Federal Reserve rate cuts. While strong employment data is traditionally viewed as positive for financial markets, current market sentiment appears to favor monetary easing over signs of economic resilience.
“When the Fed made their first rate cut of 2025, it was specifically because of labor market weakness,” the firm stated, adding that the cut was not because inflation hit the Fed’s 2% target.
Concerns intensified after recent labor market data challenged the narrative of an economy in decline. The Kobeissi Letter noted that US job openings rose by 731,000 in April, bringing the total to 7.6 million, the highest level since May 2024.
As a result, traders have sharply adjusted their expectations for monetary policy. The report added that markets now see a growing possibility of additional rate hikes through 2027, marking a significant shift from earlier-year expectations of multiple rate cuts.
“We have seen the most hawkish shift in Fed expectations since post-pandemic stimulus. The BASE case shows two rate HIKES by early 2027,” The Kobeissi Letter stated.
The changing rate outlook has added pressure to crypto markets, which are more sensitive to liquidity conditions and investor risk appetite. Bitcoin continues to feel the effects of macroeconomic data, now down over 53% from its October peak and posting double-digit losses over the past week.
“Bitcoin is down 20% this week ALONE, with crypto erasing ~$2.5 trillion since October 2025. The bear market gained momentum this week and crushed risk appetite,” The Kobeissi Letter further wrote.
The report also pointed to several factors weighing on equities and crypto simultaneously. These include plans by major technology companies such as Meta to raise significant capital for artificial intelligence (AI) investments.
Others include the upcoming $75 billion SpaceX initial public offering (IPO), which could absorb substantial liquidity from the market.
BTC is trading at $60,720, down 2.8% in the past 24 hours, at the time of writing.
Colombia Consumer Price Index (YoY) came in at 5.84%, below expectations (5.91%) in May
AUD/USD depreciates after registering minor gains in the previous day, trading around 0.7120 during the Asian hours. The technical analysis of the daily chart shows the pair consolidating sideways within a rectangle pattern, as neither bulls nor bears gain control. The AUD/USD pair is holding a slight bearish tone however as it sits beneath both the nine-day and 50-day EMAs.
Colombia Consumer Price Index (MoM) registered at 0.47%, below expectations (0.51%) in May
AUD/USD depreciates after registering minor gains in the previous day, trading around 0.7120 during the Asian hours. The technical analysis of the daily chart shows the pair consolidating sideways within a rectangle pattern, as neither bulls nor bears gain control. The AUD/USD pair is holding a slight bearish tone however as it sits beneath both the nine-day and 50-day EMAs.